INTRODUCTION
In recent years, a tendency to produce coffee leaf tea is emerging as an alternative beverage to other popular drinks such as tea and brewed coffee. Companies such as the Wize Monkey Inc. (Vancouver, BC, Canada), commercially produce and distribute coffee leaf tea around the world since 2014. Historically, coffee leaf tea has been consumed in Indonesia, Jamaica, India, Java, Sumatra, and South Sudan (Chen, Ma, & Kitts, 2018). Nevertheless, coffee leaf tea remains far from popular among regular tea and coffee drinkers in the developed world.
Consumption of tea and brewed coffee is influenced by demographic factors like age, education, and cultural background. Beyond these factors, consumption of such beverages is linked to the health benefits they offer. In both tea and brewed coffee, health benefits are chiefly attributed to the phenols present in them.
In the case of tea, according to Rostagno et al. (2015), polyphenols (particularly catechins) and other biologically active compounds found in tea contribute to the prevention and treatment of diseases. For example, tea consumption reduces the risk of stroke, depression, coronary heart disease, cardiac death, cerebral infarction, and hemorrhage (da Silva Pinto, 2013; Lorenzo & Munekata, 2016). Moreover, tea consumption reduces the rate of progression of cerebral diseases like cognitive disorders and dementia (Ide & Yamada, 2015).
Similarly, coffee is a rich source of phenolic compounds (principally chlorogenic acids) which are credited with the prevention of chronic diseases as well (Rostagno et al. 2015). In fact, chlorogenic acids have a positive effect on cancer, aging, oxidative stress, and inflammation (Chen et al. 2018).
Some studies have focused on the phenolic content of coffee leaves (Campa et al. 2012; Salgado et al. 2008; Talamond et al. 2008; Campa & Petitvallet, 2017). For instance, the study by Salgado et al. (2008) provides a summary of phenolic compounds of leaves depending on the maturity of the tree and whether it is in the productive phase or not. A main result of their work is that there is a greater concentration of phenols in young, fruit-producing plants. By contrast, the studies by both Campa et al. (2012) and Talamond et al. (2008), focus specifically on the identification and analysis of a distinctive phenolic compound: Magiferin. Yet, only the study by Chen et al. (2018) analyzes the effects of processing methods of coffee leaves and how these methods affect their phytochemical profile.
Central to the processing, distribution, and preservation of tea or coffee leaves is the drying process. Leaves, in general, have a high moisture content, so the drying process may take a considerable amount of time to reach an equilibrium mass (dry weight) when using low temperatures. In contrast, when employing elevated temperatures, the time needed to reach a final dry mass is reduced, but this may have adverse effects on the phenolic composition. In the case of ginger leaves, Chan et al. (2009) demonstrate that thermal drying methods drastically reduce their total phenolic content. A notable exception is the freeze-drying process in which hot temperatures do not play a role, therefore this process avoids the deleterious effects of elevated temperatures on the product. In the study by Chen et al. (2018), coffee leaves were dried using air and an electric tea dryer as used in the processing of white, green, oolong, and black tea.
A single drying method employing non-freezing temperatures may seem impractical in the drying of food products because of the effects on their physical and dietary properties. Furthermore, it may not be suitable in some foodstuffs. For example, temperature sensitive products will react by changing their organoleptic properties, thus making them less apt for consumption. One simple example is garlic. As expressed by Cui et al. (2003), unwanted chemical reactions affecting the flavor and nutritional properties of garlic occur from the drying method. Thus, proper selection of the drying method is critical to preserve the quality of the product. The researchers, in this case, combined both hot-air drying with microwave-vacuum drying to obtain a desirable quality. In fact, their results show that such combination provided results similar to using freeze-drying methods. Similarly, for coffee leaves, a combined method should provide better final organoleptic properties and phenolic composition.
Along with the preservation quality, time and energy consumption were considered as requirements for selecting a combined drying method. One motivation for producing coffee leaf tea is the manufacturing feasibility to compete with both traditional tea and brewed coffee. Hence, the drying process should not place a heavy economic burden on its production. To reduce the time and energy required for drying, high-temperature short-time (HTST) drying is a promising technique for the initial drying process and the remainder is done by convective oven drying at a lower temperature for a longer time. As a starting point, both HTST and convective drying is a combination that could achieve the desired quality requirements of drying coffee leaves.
One concern is that the elevated temperatures in the HTST will affect the total phenolic content. To argue in favor of HTST, in the case of olive leaves drying, for instance Kamran et al. (2015) determined that drying at high temperatures for a short time improved the “recovery of antioxidant biophenols.” In that study, the researchers tested different drying techniques to ascertain the optimal drying parameters to maximize the oleuropein content, a biophenol of interest. Furthermore, these authors comment on the paradox that drying at elevated temperatures produces thermal decomposition, yet doing so for a brief time yields optimum results. Thus, HTST is an ideal option to complement the convective part of the drying process.
Currently, and to our knowledge, there are no studies examining the phenolic content of coffee leaves subjected to HTST and convective drying. The objective of this research is to analyze the phenolic content of dried coffee leaves to ascertain the optimal drying parameters for producing coffee leaf tea in short time period with minimum damage to the total phenolic content.
MATERIALS AND METHODS
Plant material. Mature, fruit-producing plant leaves were gathered during the second and fourth week of March in 2017 (average temperatures 20°C day and 16°C night, humidity 77%). The geographic location of the site is 5º3’10’’N, 73º30’29’’W, at 1860 m above sea level. After picking the leaves, they were placed in sealed plastic bags within a Styrofoam container with an ice pack to prevent premature damage. The in situ picked leaves were transported after 24 hours to the drying laboratory of the Department of Chemical and Environmental Engineering - Universidad Nacional de Colombia - Bogotá D.C. At the laboratory, the bags were kept refrigerated at an average of 10°C. Atmospheric conditions at the laboratory were: 53% relative humidity and an average of 21°C throughout the day.
Drying Experiment. To examine the effect of the HTST pretreatment, a central composite rotational design (CCRD) with k=2 and three center points was used. Both temperature (T) and thickness (th) served as the independent variables, and total phenolic content (TPC) and time (t) as the dependent variables.
For the HTST pretreatment, an upper value of 110°C was selected based on the results obtained by Kamran et al. (2015). The lower value of 80°C was selected based on consensus among the authors of this paper. Most natural products are died at 60°C; hence, a value of 80°C would provide a range of values closer to the optimal temperature value of 105°C found by Kamran et al. (2015). With those two extreme values, the calculated temperatures in the CCRD were as follows: 84.4°C, 95°C, and 105.6°C.
As for the thickness, an upper value of 3cm and a lower value of 1cm were selected based on consensus among the authors of this paper. With those two extreme values, the calculated thicknesses in the CCRD were as follows: 1.3cm, 2cm, and 2.7cm. Table 1 shows the distribution of testing samples according to the CCRD. To determine the sample thickness, the leaves were stacked on top of each other, and an approximate thickness value was determined using a caliper. Then, the samples were arranged in ordered layers and placed in aluminum foil (non-perforated) pans (8cm x 12cm x 6cm), and these were placed in the oven at the preset temperature for 15 minutes.
Table 1 CCRD experimental design with temperature (T) and thickness (th) as independent variables corresponding to the HTST pretreatment.
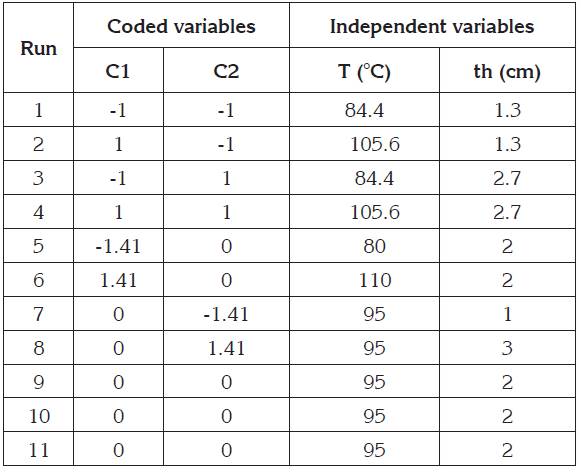
Two samples were tested every other day. On the first week, a total of six samples were tested using the initial batch of coffee leaves gathered. On the second week, for the remaining five samples, a new batch of leaves were tested. Furthermore, the samples corresponding to the central points of the CCRD were distributed at the beginning, middle, and end of the experiment.
After the HTST pretreatment, the leaves were removed from the oven and weighed on an analytical balance. Weight measurement took place in an adjacent room. The initial weight measurement served as the starting point for the convective part of the experiment.
For the convective treatment, the leaves were introduced in a secondary oven adjacent to the primary oven at 60°C. Such temperature was selected as an upper limit for consideration in future experiments.
Weight measurement took place every 10 minutes for the first four measurements as done for the initial measurement. After, it took place every 20 minutes until reaching an equilibrium mass; at that point, the final time value was selected. Such arbitrary cutoff point was selected to examine the effects of both temperature and thickness on the drying kinetics of the leaves for all of the samples.
Upon finishing the drying process, the final, approximate, thickness was measured and the leaves were placed in sealed plastic bags. Lastly, the dried leaves were tested for their total phenolic content.
To further contrast the effects of the combined drying procedure, a parallel experiment without the HTST pretreatment was run. To juxtapose the effects of the run with the highest temperature employed and the run with the lowest temperature employed, the thickness used for the leaves was 2cm. We refer to this auxiliary sample trial as run (0).
Total Phenolic Content. Prior to the total phenolic content analysis, the dried leaves were coarsely ground using a food processor to facilitate the water mixture and phenol extraction. Using the Folin Ciocalteu method (Blainski et al. 2013) with gallic acid as a calibration pattern, we determined the total phenolic content. To create the calibration curve, gallic acid solutions were prepared from 200mg/L until 12.5mg/L.
To simulate a tea infusion, 50mL of deionized water at 80oC and 0.5g of leaves were mixed. The mixture was left to brew for five minutes. Then, 2.5mL of the aqueous mixture was taken and diluted in 1:1 relation with deionized water before applying the Folin Ciocalteu reagent along with sodium carbonate and sodium tartrate buffer solution to stimulate the reaction. After combining the reagent, leaves, and sodium carbonate, the mixture rested for two hours before proceeding with the colorimetric analysis.
For the colorimetric analysis, absorbance was measured at 700nm. With the calibration curve, the total phenolic content was determined expressed as milligrams of gallic acid per gram of leaves.
Drying Curves. Initially, the analysis started with Fick’s second law to determine the water mass flow per unit area. However, early results showed that the decreasing slope region or falling rate period behaved erratically. The discussion section of this paper elaborates on the reasons of such behavior. As an alternative representation of the drying curves, the empirical Page’s model (Eq. 1) was used.
Y=(X-Xeq)/(Xo-Xeq)=exp(-ktn) (Eq.1)
where: Y is the dimension less moisture content ratio, X is the average moisture content, Xeq is the equilibrium moisture content, Xo is the initial moisture content, k and n are the model constants, and t is the time.
The experimental data were fitted into Page’s model and the model constants were determined using Statistica © v.10 (StatSoft inc. OK, USA) by implementing a nonlinear estimation with the Quasi-Newton method. Additionally, the CCRD creation and analysis was also conducted with Statistica ©.
Equipment. Coffee leaves were dried in a universal oven (Daihan Labtech model LDO-060E) with capacity for 56 L and heat range from room temperature to 120°C with accuracy of +/- 1.0°C. The mass changes were controlled with a Mettler analytical balance AB204-S with sensibility ranging from 0.001g to 220.0g and precision of 0.1mg. Colorimetric determination of phenolic compounds took place in a Thermo Scientific spectrophotometer Genesys 20 model at 700nm.
RESULTS AND DISCUSSION
Time Reduction. To determine the drying time, the coefficients of the Page’s model were used while setting Y to 0.05 (an acceptable value for the moisture content ratio) and solving for (t) in equation 1. Table 2 shows Page’s k and n values for each individual run with their corresponding R2 value. The corresponding graph for each run is shown in figure 1.
Table 2 Page’s Coefficients and corresponding R2 values for convective drying part of the experiment.
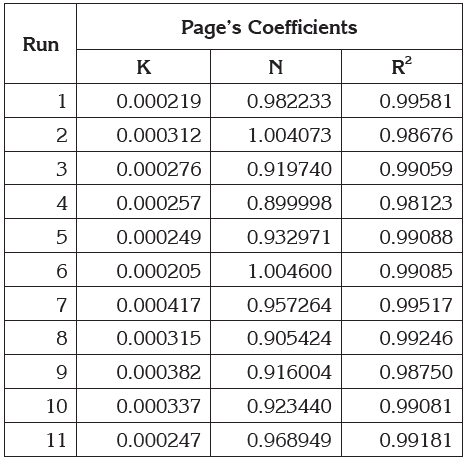
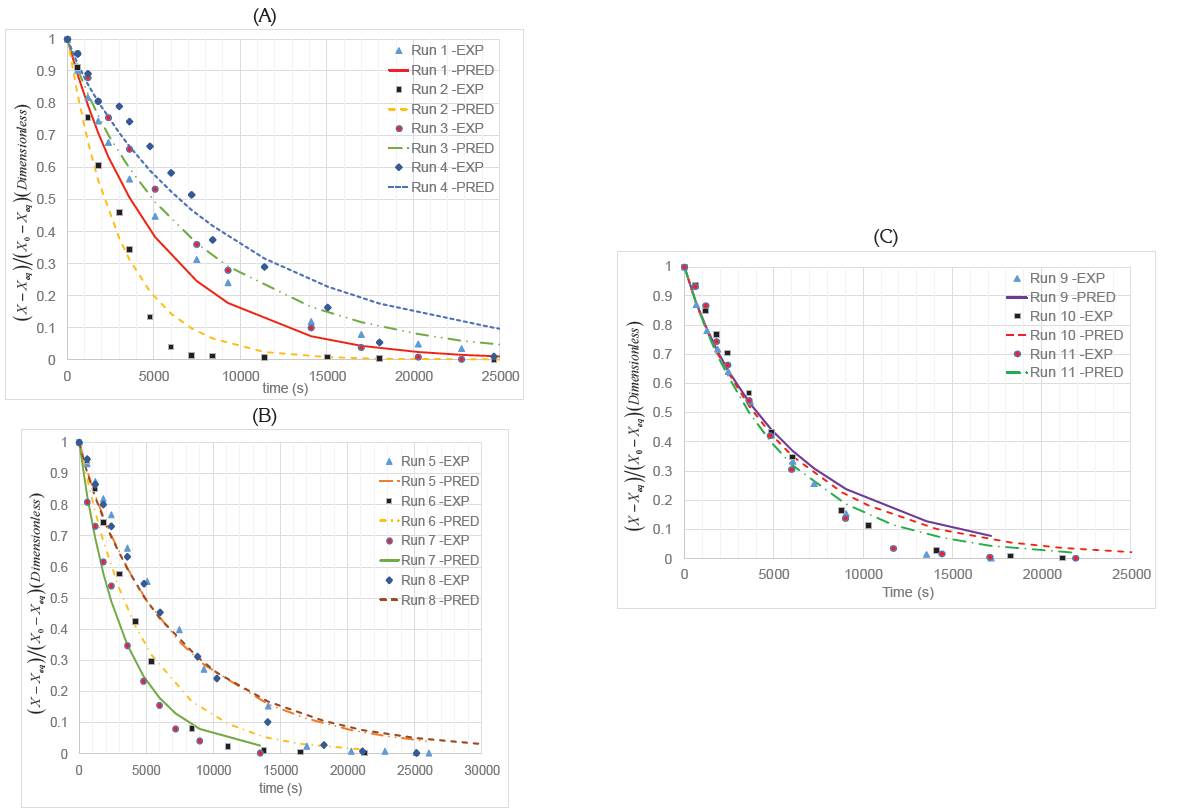
Figure 1 Experimental (EXP) and predicted (PRED) curves using Page’s empirical model for the convective part of the experiment: (A) factorial points; (B) axial points y (C) central points.
The first observation from the curves is the agreement with the dissimilar effects that temperature and thickness have on each run for both the factorial and axial points. As for the central points, graphically there is agreement with results obtained at different times during the experiment. Moreover, the curves exhibiting the fastest drying rates are runs (2,7,6,1), respectively.
To determine the effect of both temperature and thickness on the time needed to reach the arbitrary 5% db moisture content, a response surface was created from the CCRD analysis. The estimate effect, standard error, and significant level p for time at Y=0.05 is shown in table 3.
Table 3 CCRD analysis statistical results for the Y=0.05 time response.

*th corresponds to thickness and T to temperature as described in equation 2.
The validity of the data for the regression coefficients in table 3 was verified with an ANOVA based on an F-test. At an alpha level of 0.05, the analysis indicated that the model is both significant and valid and the model explains 82% of data variation (Fcal(1,10)=17.9, R2=0.82). Thus, with the regression coefficients, equation 2 represents the response surface; the corresponding surface is shown in figure 2.
t=19004.52+6482.25*th+3893.04*T*th (Eq.2)
With the response surface, the temperature (T[oC]) and thickness (th[cm]) effect on the drying kinetics is clearer: the quickest drying time (t[s]) takes place as temperature increases and thickness decreases, as long as the thickness is lower than 2cm. This result indicates that the HTST impact can significantly reduce the drying time even if it is applied for 15 minutes. With run (0), the time response was 25606.75 seconds, which in terms of percentage difference with run (6) is 58.51% more and with run (5) is 7.95% more. This information is now contrasted with the total phenolic content.
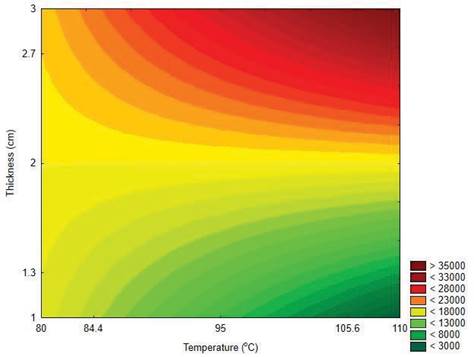
Figure 2 Response surface according to equation (3) relating the regression coefficients for time (t) when Y=0.05.
Total Phenolic Content. The CCRD analysis with total phenolic content as response variable did not yield statistically significant results. Therefore, the HTST did not have a statistical effect on the total phenolic content. Table 4 displays the total phenolic content of leaves for each of the samples as obtained from the calibration curve.
Additionally, to contrast the results in table 4, the total phenolic content for run (0) was 5.28739mg/g leaves. If we put the results of run (0) with runs (5, 6, 9-11) side by side, there is no causality between the HTST pretreatment and the total phenolic content. Ordering the results from higher to lower temperatures, (i.e. run (6, (9,10,11), 5, 0)), the total phenolic content increases; however, at the lowest temperature, it decreases. Namely, at lower temperatures a higher total phenolic content is expected, but that is not the case for run (0).
Table 4 Total phenolic content (TPC) analysis and results using Folin-Ciocalteu colorimetric method.
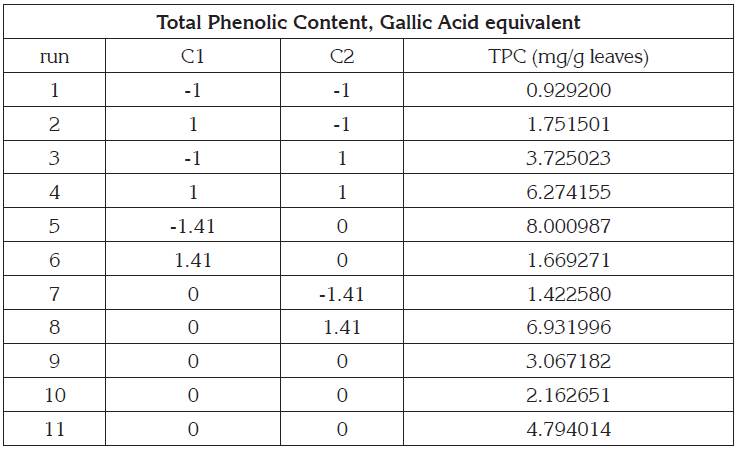
In essence, any of the combinations from the response surface (Figure 2) which yield the lowest drying time may be used without affecting the total phenolic content. Although temperature does influence the total phenolic content, it is not clear why from run (1) to (2) and from (3) to (4) the total phenolic content increases, yet from (5) to (6) it decreases.
Limitations. Considerations regarding the quality of the experiment include the following limitations: First, when measuring the weight, the leaves were removed from the oven and transported to an adjacent room. Therefore, humidity was gained during this process and actual weight differs from the one initial one at the oven; second, instead of placing one tray at a time in the oven, two trays were positioned simultaneously in the same oven, therefore, altering the heat and mass transfer characteristics as opposed to individual tray drying; third, the sealed plastic bags containing the fresh leaves were placed in a refrigerator containing other chemical food-stuff products. Therefore, contamination may have occurred affecting the total phenolic content; fourth, measuring the actual thickness of dried leaves was impractical. As leaves dry, their form changes; thus, an approximate average value was taken for the final thickness; finally, fifth, when working with agricultural products, there is an inherent variability in plant characteristics, thus making it impossible to control the total phenolic content of each leaf.
Fick’s second law did not yield appropriate results because portions of the falling rate period experienced both gains and losses in the moisture content. The initial results were akin to convective-vacuum drying. A possible explanation is that, as the leaves dried, a change on thickness affected the results.
Based on the obtained results, it could be concluded that the HTST helps to achieve a reduction in the drying time without negatively affecting the total phenolic content. Any of the combinations from the control surface that achieve a fast- drying time is applicable for the conditions tested as there is no dependence on the total phenolic content. Further experiments should consider altering such conditions (HTST temperature and time, and convective temperature) to see how the total phenolic content of dried coffee leaves changes. Consequently, it may be possible to optimize the drying time while maximizing the total phenolic content, which is of interest for the health benefits phenols offer.


