


 English (pdf)
 Article in xml format
 Article references
 Send this article by e-mail
 Cited by SciELO
  Cited by Google
  Similars in
SciELO
Similars in
SciELO  Similars in Google
 Permalink
Introduction
Respiratory allergy frequency and etiological complexity are growing in Latin American countries. These allergies involve the interaction of genetic and environmental factors (Drake, et al., 2008; Mukherjee & Zhang, 2011; Asher, et al., 2020). Two transversal studies conducted in six Colombian cities have shown a clear increase in the cumulative prevalence of asthma symptoms over the last decade (Dennis, et al., 2004; Dennis, et al., 2012) reporting a total prevalence of 12.1% in the country and of 14.5% in the city of Barranquilla on the Caribbean coast (Dennis, et al., 2012).
In tropical countries, asthma cases are strongly associated with exposure to indoor allergens whose main source is house dust mites such as B. tropicalis (Bt) and Dermatphagoides sp (Dsp) (Milián & Díaz, 2004; Andiappan, et al., 2014). In fact, there is a dose-response relationship between exposure to those allergens and the risk of developing allergen sensitization (Marks, 1998; Huss, et al, 2011). Epidemiological evidence shows that continual exposure to allergens is a risk factor for the development of asthma. Accordingly, the promotion of interventions to reduce allergen exposure, especially in indoor environments, has recently increased (Winn, et al., 2016; Vojta, et al., 2001; Paufler, et al., 2001). In most cases, a reduction in allergen exposure has resulted in clinical benefits for asthma patients with a significant impact in terms of public health as well (Morgan, et al., 2004; Halken, 2004).
Asthma poses a considerable social and economic burden on patients and their families (Kamble & Bharmal, 2009). A study based on the Medical Expenditure Panel Survey (MEPS) findings estimated asthma-related direct and indirect medical costs in the USA in 2007: Annual direct costs per person were estimated at US$ 1,999.17, hospitalization costs at US$ 703.39, and drug-prescription costs at US$ 624.81 while average annual indirect costs per person amounted to another US$ 628.84 (Rappaport & Bonthapally, 2012). In Colombia, studies on asthma-related direct and indirect costs have also shown the high economic burden associated with this disease (Londoño-Trujillo & Celis-Preciado, 2016; Rodríguez-Martínez, et al., 2017).
The development of high-quality antibodies and detection reagents for immunoassays is of great importance for diagnosing allergic diseases such as asthma and allergic rhinitis as they can quickly identify specific allergen levels in home environments, a primordial step to control them adequately. The concept of "low allergen levels for life" is frequently used in Europe and many tools already exist in the market for allergen detection and monitoring (Portnoy, et al., 2013). Unfortunately, the majority of these are not readily available for the asthmatic population of underdeveloped countries.
Blomia tropicalis (Bt) and Dermatophaglides sp (Dsp) are the most clinically important mite species in the tropic. Currently, commercially available antibodies for mite-allergen detection in indoor environments are mainly mouse and rabbit IgG class antibodies. Companies such as Indoor Biotechnologies (Charlottesville, Virginia) produce monoclonal and polyclonal IgG antibodies against the major allergens of D. pteronyssinus (Der p 1 and Der p 2), D. farinae (Der f 1 and Der f 2), and B. tropicalis (Blo t 5). Immunoassays based on IgG-antibodies (Multiplex Array for Indoor Allergens -MARIA® from Indoor Biotechnologies and Dust Mite Screen Check from Environmental Diagnostics Laboratory, Clearwater, Florida) are also available for dust-samples analysis in the laboratory (Portnoy, et al., 2013). To the best of our knowledge, presently there are no commercially available IgY antibodies for the detection of house dust mite allergens.
Here, we show the utility of two polyclonal avian antibodies (IgY) for detecting Dsp and Bt allergens in house dust samples from two Colombian Caribbean cities. Our results evidenced that they may be used as immunoreagents for the primary detection of mite allergens. Future studies should explore the design and development of immunoassays for rapid and efficient detection of mite allergens based on IgY-PO2 and IgY-PO4 antibodies.
Materials and methods
Antibodies
Two polyclonal avian antibodies (IgY) from Hy Line Brown hen eggs were produced against non-glycosylated synthetic oligopeptides designed in silico based on sequences from dust mite group-1 allergens Bt (named PO2) and Dsp (named PO4) (Patent US9416163 B2) (Barrera, et al., 2016). We determined antibody titers by ELISA while in a previous study (Egea, et al., 2018), mite protein concentration and the ability of antibodies to recognize Bt and Dsp group-1 allergens had been determined by Western Blot.
Mite extracts
Whole body Dsp and Bt extracts were prepared from mite cultures done in the immunology and molecular biology laboratory at Universidad del Norte following the methodology previously described (Mendoza, et al., 2011) and then used to determine IgY-antibody detection limits and as a positive control in the ELISA assays. An allergenic extract from the cockroach Periplaneta americana (Pa) was used to evaluate IgY antibody specificity in the indirect ELISA (kindly donated by Dr. Enrique Fernández-Caldas, Scientific Director at Inmunotek, Spain). The total protein concentration in the Dsp extract was 1.42 mg/mL, in the Bt extract, 1.67 mg/mL, and in the Pa extract, 2.80 mg/mL. All extract concentrations were determined using the Quick Start™ Bradford Protein Assay kit from Bio-Rad.
House dust samples
Samples were obtained from asthmatic people's homes in the metropolitan area of Barranquilla and Santa Marta, two Colombian cities on the Caribbean coast with a high prevalence of asthma symptoms (Dennis, et al., 2012; Mendoza, et al., 2008). We took all the samples from the mattresses of the asthmatic individuals' wooden beds participating in the study. Housing characteristics met public health criteria and the patients' indoor conditions corresponded to those required in primary and secondary care.
We collected 100 samples between March and September 2016 (50 samples from Barranquilla and 50 from Santa Marta). For the sampling, we used a Eureka® Mite II vacuum hoover (The Eureka® Company, Bloomington, IL) placing a 19 x 90-mm nitrocellulose extraction cartridge (Whatman International Ltd., Maidstone, UK) at the end of the hoover extension tube and sealing the joint with a rubber ring. We hoovered a 2-m2 area in each mattress at 0.5 m2/min according to the US EPA 747-R-95-001.14 protocol (Environmental Protection Agency - EPA, 1995). Extraction cartridges containing dust samples were stored in labeled plastic bags, sealed, and finally stored at 4 °C until their processing. We sieved the samples using a 500-um mesh and then analyzed them on the microscope to identify and quantify the mites as previously described (Acuña, et al., 2015). Briefly, 50 mg of each sample were treated for 2 hours with a PBS (1X, pH 7,2) solution (1:1, v/v) at 40°C. Afterwards, mites were visualized using a Nikon SMZ-1 (4X) microscope, isolated with a fine needle, and fixed on slides for their identification using taxonomic keys (Collof & Spieksma, 1992; Smiley & Gorham, 1991). The number of Bt and Dsp (D. pteronyssinus and D. farinae) mites was determined by a standard method (Arlian, et al., 1999) and results were expressed as the number of mites per gram of dust (m.p.g).
Extraction of mite allergens from dust
To determine the optimal time for dust extraction, we used a randomized complete block experimental design with five treatments and three blocks. We analyzed two dust samples, one with a low density of mites (<300 m.p.g.) and the other with a high density of mites (>500 m.p.g.). We mixed 100 mg of dust in 1 mL of PBS 1X for each sample. The extraction was performed at room temperature on a Gemini twin Shaking Water Bath (Robbins Scientific®) at 60 rpm for 30, 15, 10, 5, and 2 min. Dust extracts were centrifuged for 10 min at 5,000 x g in a Beckman refrigerated centrifuge (GPR model). We collected the supernatants in Eppendorf vials and used them immediately to evaluate the mite allergen content by ELISA. The results were expressed in absorbance values at 450 nm. Once the extraction time was determined, the same procedure was set up using the 100 samples whose dust mite densities and compositions had been previously determined through microscopy analysis.
ELISA assay
We conducted an exploratory study to detect the usefulness of IgYPO2 and IgYPO4 in the detection of Bt and Dsp allergens in 100 house dust samples. Mite allergens were detected by an indirect ELISA test as previously described (Barrera, et al., 2016; Egea, et al., 2018). We coated polystyrene plates with 96 wells (Nunc Maxisorp®) with 100 μL of antigen (mite extracts or dust extracts) and incubated the plates in a wet chamber at room temperature for 18 hours. Unbound molecules were removed from the plate and each well was subsequently blocked with 200 μL of blocking solution (PBS 1X, 0.05 % v/v Tween-20, and 5 %w/v skimmed milk) for 2 hours. Each well was then washed three times with PBST (1X PBS, 0.05% v/v Tween-20) using an RT-2600C microplate dishwasher (Rayto®). Primary antibodies were then added for one hour (100 μL of IgY-PO2 or IgY-PO4 at 1 μg/well). We minimized non-specific binding using four PBST wash steps. We detected the IgY-allergen complex using 100 μl/well of secondary IgG anti-chicken antibody conjugated with horseradish peroxidase (Promega G1351). The secondary antibody was diluted 1/2,000 in antibody dilution buffer (1X PBS, 0.025% v/v Tween-20 and 2.5 %w/v skimmed milk). Subsequently, the plate was washed four times in PBST. The reaction was developed with 100 μL of the peroxidase substrate and 3,3',5,5'-tetramethylbenzidine (Sureblue Reserve™ TMB Microwell Peroxidase Substrate). After 15 min, the reaction was stopped with 1N HCl, and the yellow color read at a 450 nm wavelength in a Synergy HTX (BioTek® Instruments, Inc.) multimodal plate reader. We used mite extracts at 1 μg/mL (0.1 μg/well) as the positive control in the final dust samples analysis and a pool of dust samples obtained from new mattresses as the negative control. The cut-off point to differentiate between positive and negative samples was the arithmetic mean plus 3 standard deviations of negative controls. We diluted those samples with absorbance values >1.0 at 450 nm (A450). All samples, including controls, were analyzed in triplicate.
Detection limit and specificity
We defined the detection limit as the smallest amount of allergen detected by each antibody above the noise of the ELISA test; in this regard, we included several reactions with PBS 1X (without extract) and pre-immune antibody (with extracts) in each plate to detect the noise (Supplement 1). Besides, we prepared two-fold serial dilutions of the mite extracts in PBS 1X (range of total protein from 0.05 - 20 μg/mL equivalent to 5 - 2000 ng/ well) and then analyzed them. We also analyzed whole body Pa (cockroach) extracts to evaluate the specificity of the antibodies.
Calibration curve
We designed a standard curve in the ELISA linearity range for each antibody. For IgY-PO2, we used known concentrations of Bt whole body extract total protein while for IgY-PO4, we used the Dsp whole body extract and then we calculated allergens relative concentrations in the dust samples through the standard curves, whereas allergen levels were calculated using equation 1(Eq. 1), and expressed in μg of allergens per gram of dust (μg/g).

where C is the relative allergen concentration (μg/mL) calculated through the standard curve, F, the dilution factor of the dust extract in the ELISA test, V, the volume of dust extract (1 mL), and M, the amount of dust sample in the extract (0.1 g).
Precision and accuracy test
Precision was determined by measuring the allergen levels of the same sample during five days (intertest) in five replicates (intratest) applying the same experimental procedure under predetermined conditions. For this test, we selected three dust samples with different mite densities at random. We calculated the results, expressed as a coefficient of variation (CV), using the following equation (Eq. 2).

The accuracy was evaluated through a recovery test in which three dust samples from new mattresses were spiked with a known concentration (1 μg/mL) of Bt and Dsp whole body extract for IgY-PO2 and IgY-PO4, respectively. We calculated the accuracy using the following equation (Eq. 3).
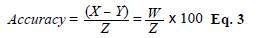
where X is the allergen concentration (μg/mL) in spiked samples, Y, the allergen concentration (μg/mL) in unspiked samples, W, the difference between X and Y, and Z, the experimental concentration of mite extract added to the samples.
Data analysis
Results were expressed as averages, medians, standard deviations (SD), and minimum and maximum ranges. Differences between treatments were evaluated using a oneway variance analysis (ANOVA) with a significance level of 0.05. Multiple (pair-wise) comparisons were done by Tukey's honestly significant difference test (Tukey's HSD) and results were presented as 95% confidence intervals (95 % CI). All statistical tests and plots were performed with the free access Software "R" (http://www.r-project.org).
Results
Mite allergen extraction
Allergen extraction was not significantly influenced by the extraction time when considering samples with a mite density greater than 500 m.p.g. (p>0.05). In contrast, when considering samples with a low mite density (< 300 m.p.g.), extraction times below 5 min significantly decreased allergen detection with IgY-PO2 (Figure 1). Therefore, the extraction time used for all the dust samples was 5 min.

Figure 1 Extraction times of mite allergens proteins in dust samples with (1a) high densities of mites (> 500 m.p.g.) and (1b) low densities of mites (< 300 m.p.g.). Allergens were detected with the polyvalent IgY antibodies IgY-PO2 and IgY-PO4 using ELISA. Each bar represents a different protein extraction time. Bt extract was used as a positive control at 1 μg/mL. Results are expressed as average values ± 1 SD. Assays were performed in triplicate.
Detection limit and specificity
Both IgY-PO2 and IgY-PO4 antibodies recognized allergenic proteins from Dsp and Bt extracts, even at the lowest tested concentration of 0.05 μg/mL (equivalent to 500 ng/g of dust). On the other hand, a linearity range was observed between the allergen concentration and the absorbance values using IgY-PO2 (0.05 - 1.5 μg/mL of Bt extract) and IgY-PO4 (0.05 - 2 μg/mL of Dsp extract) (Figure 2). We used this result to establish the protein concentration range in the calibration curves for the allergen quantification in the dust samples.

Figure 2 Detection limit of IgY-PO2 and IgY-PO4 antibodies. Different concentrations of Blomia tropicalis, Dermatophagoides sp, and Periplaneta americana extracts (0.5 - 20 μg/mL equivalent to
An ANOVA showed a significant difference (p<0.005) between the reactivity of the antibodies towards the three different allergenic extracts (Bt > Dsp > Pa). The low reactivity of both IgY-PO2 and IgY-PO4 towards the cockroach extract is indicative of relevant antibody specificity.
Allergen detection in dust samples
Both antibodies were able to recognize allergenic proteins of Bt and Dsp in the dust samples collected in indoor environments. The allergens levels in the dust samples were determined by standard calibration curves with Bt and Dsp whole body extracts using IgY-PO2 and IgY-PO4, respectively (Supplement 2). On the other hand, we used dust samples collected from new mattresses to define the cut-off point of positive and negative samples at A450 ≤ 0.145 for IgY-PO2 and A450 ≤ 0.122 for IgY-PO4.
Table 1 shows the ELISA assay global results according to the sampling site (Barranquilla or Santa Marta). The dust samples collected in Barranquilla displayed higher levels of mite allergens in the ELISA experiments with IgY-PO2 and IgY-PO4, which is consistent with the higher total density of mites in these samples compared with the Santa Marta samples (mean difference = 378.57; 95% CI = 225.77 - 531.37, p = 3.8E-06). Furthermore, IgY-PO4 showed greater reactivity when the samples collected in Barranquilla were analyzed (mean difference = 9.66; 95% CI = 5.95 - 13.37, p = 0.000) compared with those from Santa Marta (mean difference = 1.86; 95% CI = 0.44 - 3.28; p = 0.0107).
Table 1 Mite density and mite allergen levels (B. tropicalis and Dermatophagoides sp) in dust samples collected in Barranquilla (N = 50) and Santa Marta (N = 50)

a Numbers of mites per gram of dust (m.p.g.)
b μg of Blomia tropicalis (Bt) allergens per gram of dust (μg/g)
c μg of Dermatophagoides sp (Dsp) allergens per gram of dust (μg/g)
LCL: Lower confidence limit; UCL: Upper confidence limit
The correlation analysis of mite density and allergen levels detected with IgYPO2 and IgYPO4 showed a linear relationship that can be explained by a simple linear model (Y = βo + β1*X), i.e., an increase in the mite density of a dust sample results in an average increase in allergen levels corresponding to the value of the regression coefficient (β1) (Supplement 3). Additionally, a high correlation coefficient (R2 = 0.744) was observed in Bt and Dsp allergen levels, which could be attributed to the cross-reactivity of B. tropicalis with Dermatophagoides species (D. ptheronyssinus and D. farinae) (Cheong, et al., 2003; Liu, et al., 2019).
The results of the intertest and intratest precision experiments are presented in Table 2. The ELISA test with IgY-PO2 yielded coefficients of variation (CV) of 15.81 to 20.55% (intertest) and 3.05 to 10.94% (intratest). IgY-PO4 yielded CVs of 7.63 to 8.71% (intertest) and 6.18 to 6.99% (intratest).
Table 2 Coefficients of variation (CV) in the ELISA assay using IgY-PO2 and IgY-PO4 antibodies
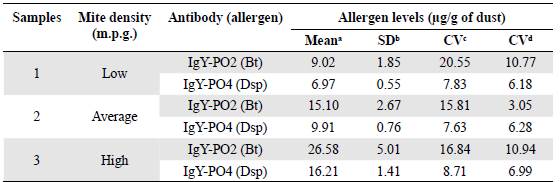
1 Means of three replicates for each dust sample (n = 3)
b SD: Standard deviation
c CV: Coefficient of variation inter-test
d CV: Coefficient of variation intra-test
The accuracy test confirmed that, regardless of the antibody used (IgY-PO2 or IgY-PO4), there was no significant difference between spiked and unspiked samples with the mite extracts (p>0.05). Furthermore, the percentage of allergen recovery was between 86.12 and 102.90% for IgY-PO2 and between 80.62 and 100.39% for IgY-PO4 (Table 3).

Discussion
Indoor dust mite contamination evaluations have been conducted for different sampling places and geographic sites. Typically, the most used technique for this type of allergen quantification is an enzymatic immunoassay based on IgG monoclonal antibodies (Platts-Mills, et at., 1997; Mistrello, et at., 1992). Although the ELISA test using IgG antibodies has shown good sensitivity and specificity (Liao, et at., 2013; Chapman, et at., 2001), the use of these type of antibodies has great limitations, among them, the high production cost of the assay, which limits its use in the routine indoor, workplace, and public sites monitoring and control of mite biological contamination. Developing alternative efficient, sensitive, and reproducible low-cost methods would be highly advantageous for the primary prevention of indoor mite contamination.
A method currently available on the market, the "Acarex®" test, is based on the semiquantitative determination of guanine. It is very simple and easily performed by inexperienced staff in the patient's house (Manjra, et at., 1994; Haouichat, et at., 2001). However, as guanine is a final product of purine digestion - a compound generally excreted by many arthropods including mites and spiders - this assay is not specific. Therefore, if spiders, for example, are present in the domestic environment, they could interfere with the assay (Mistrello, et at., 1992; Saijo, et at., 2007).
Recently, our group used IgY technology to produce polyclonal antibodies against dust mite group 1 allergens (cysteine protease). These antibodies showed high reactivity and sensitivity towards D. farinae, D. pteronyssinus, and B. tropicalis allergenic proteins including group-1 mite allergens (Egea, et at., 2018; Egea, et al., 2019). Here, we used two of these IgY antibodies (IgY-P02 and IgY-P04) to explore their applicability for detecting mite allergens in dust samples using an indirect ELISA test.
IgY technology has successfully been used in experimental allergology to produce antibodies against food allergens such as peanuts (Arachis hypogaea L) (Kiio & De Meulenaer, 2012; Iqbal & Ateeq, 2013). Moreover, other studies have applied IgY technology in the simultaneous detection of multiple food allergens such as oat proteins, Brazilian nuts, and peanuts obtaining detection limits between 1.0 and 0.1 μg/g and proving the viability of using them in immunochemical tests for multiple allergen detection (Blais, et at., 2003).
Here we determined that the limit of detection of IgY-P02 and IgY-P04 antibodies was 0.05 μg of mite allergens per milliliter of extract (corresponding to 500 ng/g of dust). Our results with the dust samples showed significantly higher (47 ng/g - 45.53 μg/g) allergen levels than those previously reported in the Colombian Caribbean. In this respect, in a study conducted in Cartagena (Colombia), the maximum levels of the Der p 1 and Der f 1 allergens were 109.49 ng/g and 1,600 ng/g, respectively (Mercado, et al., 1996), detected with a commercial sandwich ELISA test using IgG monoclonal antibodies. The IgY antibodies used in the present study were polyvalent in nature, which would explain their greater reactivity. Despite the use of specific synthetic peptides for chicken immunization, IgY antibodies recognize both group-1 allergens and others present in mites' whole body extracts as reported in a previous study (Egea, et al., 2018). It is clear to us that to establish the specific detection of mite group 1 allergens from dust it is necessary to perform calibration curves with standardized allergen extracts, which were not used in the present study.
The correspondence between the mite allergen levels (detected with the IgY antibodies) and the mite density present in the dust samples indicated that IgY antibody-based ELISA allergen measurements could be used to substitute the direct counting of mites considerably reducing analysis time. Moreover, higher intertest (CV ≤ 8.71%) and intratest (CV ≤ 6.99%) precision and accuracy (80.62 - 100.39 %) obtained with the ELISA test using IgY-PO4 substantially increase the reliability of the results. Préster, et al. (2007) reported similar results for precision (intra-assay CV <6.9%, inter-assay CV<13.3%) and accuracy (91% to 93%) using the enzyme immunoassay with two monoclonal antibodies for the detection group-1 mite allergens (Der f 1 and Der p 1). Consequently, the detection of mite allergens using IgY antibody-based immunoassays stands out as an alternative to the currently available guanidine method, since they are specific for mite allergens and not those of other arthropods (such as cockroaches).
Future studies will be focusing on the quantification of the major Der f 1, Der pi, and Blo t 1 allergens in dust samples using specific calibration standards. The diagnostic performance and the sensitivity of the ELISA assay will be determined and compared with other commercially available reference tests. At present, several studies comparing different methods based on IgG antibodies for the detection of mite allergens in indoor environments have been published showing differences in sensibility and specificity (Saijo, et al., 2007; Rim, et al., 2016). To the best of our knowledge, presently there are no studies comparing IgG- and IgY-based tests, which would be the next step in our research.
Conclusions
Our study showed that polyclonal avian antibodies (IgY-PO2 and IgY-PO4) directed against dust mite group-1 allergens were efficient in monitoring mite levels of intramural dust samples using an indirect ELISA assay. IgYPO4 could be used for controlling mite infestation and prove beneficial to allergy-sensitive patients suffering from clinical asthma symptoms.

