Introduction
Low soil moisture level is regarded as the main environmental factor limiting plant survival and crop production worldwide (Passioura 2007; Lambers et al. 2008), and is considered the abiotic factor most responsible for variations in dry matter yield among forage plants (Barker and Caradus 2001; Islam and Obour 2014).
Among interrelated effects of water deficit on plant functioning are: a decrease in cell division and extension; reduction of net CO2 assimilation by either stomatal or non-stomatal limitations; reduced shoot and/or root growth; and alteration of water relations, oxidative defense, mineral nutrition and water use efficiency (Turner and Begg 1981; Ludlow 1989; Farooq et al. 2012).
Among perennial plants (including herbaceous grasses and legumes), 2 basic strategies to survive water deficits have been identified, i.e. high and low tissue sensitivity to dehydration (Fisher and Ludlow 1984; Ludlow 1989). High sensitivity to water deficit involves an "escape" or "evasion" strategy; plants of this functional group close stomata (see below) at the onset of drought to control water loss and maintain higher leaf water potentials during the drought spell. In addition, turgor loss and tissue death can be delayed/avoided by other plant traits associated with efficient use of soil water, e.g. deep and extensive root systems, low or high root-stem hydraulic conductivity, reduced leaf and canopy area and leaf movements, until air evaporative demand can no longer be balanced by soil water uptake (Blum 2005; Bacelar et al. 2012). Plants with low sensitivity to soil desiccation can "tolerate" progressive drought stress mainly by physiological mechanisms. Here, a significant decrease of leaf water potential may occur, while tissue turgor and hence CO2 exchange for growth are maintained by osmotic adjustment or changes in cell wall elasticity (Bacelar et al. 2012; Sanders and Arndt 2012). In this case, plant growth may or may not be affected (Bacelar et al. 2012).
Since stomatal closure is the most rapid and effective mechanism to reduce early water loss during drought, "isohydric" plants show a very effective stomatal control during the day, to maintain high leaf water potential values within a narrow range and are thus less exposed to hydraulic failure as drought develops. This plant response is classified as an evasive strategy. On the contrary, "anisohydric" plants can tolerate more negative leaf water potentials and maintain photosynthesis (though with the penalty of continuous water loss) as soil water deficit increases (McDowell et al. 2008; Vilagrosa et al. 2012). Conservative water usage may imply high water use efficiency and probability of survival during relatively short-term events of low soil moisture, as long as avoidance strategies sustain tissue hydration. Anisohydric plants are predictably more resistant to xylem cavitation, thus displaying essentially tolerant mechanisms to cope with soil water deficits. This may sustain C fixation and growth at very low soil water levels during prolonged drought periods, until tissue turgor can no longer be sustained (Bacelar et al. 2012; Vilagrosa et al. 2012).
Despite this broad separation of water and C economy into 2 functional types, species may respond with a combination of structural and physiological traits of either short- or long-term-adaptive value (Baruch and Fisher 1991; Pang et al. 2011; Rao 2014).
Schultze-Kraft and Clements (1990; and references therein), Keller-Grein et al. (2000) and Rodríguez et al. (2003) noted the importance of Centrosema as a forage source for improving pasture productivity in the Neotropics. Nevertheless, to our knowledge, there is little published work linking potential for dry matter production in species of this forage legume and plant strategies to cope with water stress under drought conditions. Pot and field studies on several Centrosema species and related forage legumes (Ludlow et al. 1983; Fisher and Ludlow 1984; Sheriff et al. 1986) confirmed the above contrasting responses to drought: a) high tissue sensitivity to reduction in soil water potential, with complete stomatal closure at relatively high leaf water potentials (i.e. ± -1.9 MPa), and other common plant traits typical of drought avoider plants (e.g. Macroptilium atropurpureum cv. Siratro) such as deep rooting and early leaf senescence; and b) low tissue sensitivity to reduction in soil water potential, with water potentials at zero-leaf conductance within the range: -4.2 to -8.0 MPa, and variable levels of osmotic adjustment associated with drought-tolerant plants, e.g. C. brasilianum, C. molle and C. pascuorum. Meanwhile, several combinations of avoidance (escape) and tolerance characters within Centrosema species have been reported (Clements 1990; Guenni et al. 2007). They can vary from an annual life cycle, rapid growth rate, narrow leaflets, high seed production and tolerance of very low water potentials (C. pascuorum), to perennial behavior, slow growth, thickened leaves and the presence of underground storage organs (C. venosum).
In this field experiment over 3 consecutive dry seasons, we studied rate of moisture depletion from the initial stored soil water, and the relationship between soil water content and leaf water relations and photosynthesis of 2 herbaceous perennial tropical forage legumes: C. molle (formerly known as C. pubescens) and C. macrocarpum. These legumes were selected because they represent two of the most promising forages for animal feeding in savanna ecosystems. The aim of the study was to identify those plant characters involved in dry matter production and acclimation to progressive drought conditions, and to assess the role of particular plant strategies in enabling these forage legumes to persist in seasonally dry tropical environments.
Materials and Methods
Site, weather conditions and soil measurements
The field study was performed at the Animal Production Institute, Agronomy Faculty of Universidad Central de Venezuela (UCV), Maracay (10°16' N, 67°36' W; 459 masl), during 3 consecutive years (2011 -2013). According to Kõppen-Geiger classification, the local climate is regarded as tropical dry to sub-humid (Aw), with a mean annual rainfall (1995-2015) of 1,074 mm (USICLIMA 2016). Around 95% of the annual precipitation falls between April and November (wet period), with a dry period extending from December to March. Average minimum and maximum temperatures (1995-2015) are 19.5 oC and 32.1 oC, respectively (USICLIMA 2016). Daily temperatures during the experiment were recorded at the meteorological station of the Institute of Agricultural Engineering (UCV), located about 1 km from the experimental site. Rainfall data were collected from an automatic station installed nearby (ca. 300 m from the field plots). Plant and soil measurements were restricted to the dry period of each year.
The soil is classified as Mollisol (Fluventic Haplustoll, Soil Survey Staff 2014) that presented no mechanical or chemical restrictions to rooting depth. Soil samples (0-20 cm depth) were collected and analyzed to give mean values (n = 3) of the following properties: loam to loamysand texture; pH (1:2): 5.5; EC (dS/m): 0.12; OM (%): 1.8; P (Mehlich I extraction), K, Ca and Mg: 36, 23, 847 and 327 mg/kg, respectively. From 5 different soil-pits located across the experimental site, non-disturbed soil samples were taken at the following depths: 10, 20, 30, 40, 60 and 100 cm, and bulk density determined in the laboratory. The tension plate technique was used to develop the water retention curve at each of the previous soil depths. Bulk density values were used to transform gravimetric water content to volumetric soil water content (6, v/v). Total transpirable soil water (TSW) in each soil layer was calculated as: 6 at field capacity (FC, Ppm = -0.01 MPa) minus 6 at permanent wilting point (PWP, Ppm = -1.5 MPa).
Species, plant establishment and plot management
Seed of 2 Centrosema accessions ENT#091;C. molle Mart. ex Benth. CIAT 15160 (cv. Barinas), and C. macrocarpum Benth. CIAT 5713ENT#093; was scarified with sand paper and sown on plastic trays containing a commercial organic substrate; then seedlings were maintained in a greenhouse with daily irrigation. In July 2010, 45-day-old seedlings were transplanted into the field. Field plots (4.4 x 3.6 m) were planted at a density of about 60 plants/m2. After 30 days of growth, plants within a plot were supplied with a mixed fertilizer (12:11:18:3:9) of N:P:K:Mg:S at 200 kg/ha. Weeds were controlled by hand. By December 2010 plots were considered established and the first uniformity cut (±20 cm height) was performed by using a mower, with fertilizer applied at the same rate as before. At the beginning of 2011, a second uniformity cut was applied 30-40 days before day 0 (when measurements started). During this regrowth period, all plots were watered weekly with an irrigation hose (» 6-8 mm of water). Additionally, the whole experimental area was flooded a week before day 0 in order to bring the entire soil profile to field capacity. The same plot management was performed during 2012 and 2013 before measurements started, but weekly irrigations were increased to 10 mm/plot. The measurement periods were: 10 March-4 May 2011 (47 days); 15 February-12 April 2012 (64 days); and 5 February-11 April 2013 (57 days). During the wet periods of those years, plots were maintained by an annual fertilizer application and regular cuts every 90 days.
Treatments consisted of: 1) half of all plots for each species were maintained at about field capacity down to 20 cm depth, by weekly irrigations (watering/irrigated treatment: WT); and 2) the remaining half of the plots received no watering (drought/unwatered treatment: DT), except for occasional rainfall events.
An access tube was installed at the center of each plot, so soil water contents at 10, 20, 30, 40, 60 and 100 cm depth were monitored once or twice a week, by the use of a PR2/6 sensor probe connected to a data logger (HH2, Delta-T Devices Ltd, Cambridge, UK). For calibration purposes and in order to have some estimate of soil evaporation, in 2011 2 access tubes were installed outside the plots, and bare soil maintained around the tubes. In 2013, an additional control tube was set up near the plots. For each plot and bare soil, soil water content at depth was estimated by converting the sensor probe reading (mv) into 6. In this case, the required bulk density value at depth was obtained from the nearest soil-pit. To compare patterns of change in soil water with depth, the fraction of transpirable soil water ENT#091;FTSW (mm/mm of TSW) x 100ENT#093; was plotted over time.
Plant measurements and harvesting
As soon as water treatments started, the central leaflet of the trifoliate leaf immediately below the most recently developed one on a selected stem or stolon, was chosen weekly to record: a) leaf water potential (Ψl) at dawn (6.00-7.00 h) during 2011 and 2013, and at midday (11.00-13.00 h) during 2012, by using a pressure pump (3005, Soil Moisture Equipment Corporation, Goleta, CA, USA); b) leaf relative water content (RWC) (Guenni et al. 2004); and c) leaf gas exchange (9.00-11.00 h), with a portable IRGA (CI-340, CID Bio-Science Inc., Camas, WA, USA), during 2011 and Lci-ADC, coupled to a leaf chamber LCA2 (ADC BioScientific Ltd., Hoddesdon, UK) during 2012-2013. Derived measurements from the IRGA included net CO2 exchange (A, umol/m2/s) and stomatal conductance (gs, mol/m2/s). At each sampling date, 3-4 leaves per plot were selected for water relations and gas exchange measurements. In addition, by the end of the 2013 drought period, 3 consecutive daily courses of 'chlorophyll a' fluorescence were recorded. After selecting 2-3 leaves per plot, the central leaflets were darkened during the day with special clips and the ratio of variable to maximum fluorescence (Fv/Fm) of Photo-system II (PSII) was then measured from 8.00 to 16.00 h with a portable chlorophyll fluorometer (OS-30p, OPTI Sciences, Hudson, NH, USA).
Field plots were harvested at the end of the dry period in 2011 (± 50 days after the start of DT), and more frequently in 2013: 1, 15, 30 and 45 days after watering ceased in the DT plots. At each harvest, aerial biomass (green leaves, stems and standing dead) was collected from a randomly selected area (0.5 x 0.5 m) within the plots. Plant material was oven-dried (60 oC) for dry matter (DM) determination. A subsample of green leaves was taken to calculate specific leaf area (SLA, cm2/g), and afterwards the leaf area index (LAI) was derived as leaf DM (g/m2) x SLA (m2/g).
Experimental design and data analysis
A complete randomized block design was used with 4 repetitions. Each repetition (block) consisted of 4 plots representing the combinations of 2 accessions x 2 irrigation treatments. Since sampling dates differed among years, comparisons between sampling dates, species and treatments were analyzed separately by year, using analysis of variance in accordance with the experimental design. Normality condition of the field data was tested with the UNIVARIATE procedure (Shapiro-Wilk test, SAS Institute 2002). Thus, data were transformed to the log10(x+1) or arcsine when necessary; otherwise, data were analyzed with non-parametric statistic through the RANK procedure (Friedman test, SAS Institute 2002). The ANOVA procedure was used for balanced data, whereas the GLM procedure (SAS Institute 2002) was applied for unequal number of replicates within treatments. To detect differences between measurement dates, species and treatments, means of all recorded variables were compared with the Tukey's HSD test (P=0.05).
Results
Environmental conditions during the field study
Figure 1 shows the daily maximum and minimum temperatures and precipitation during each evaluation period. Minimum temperatures varied within the range 15 -20 o C, whereas maximum temperatures were always above 30 o C, and around 35 o C by 2013 (Figure 1). Isolated rains occurred mostly during the second half of each dry period, totaling 41, 75 and 31 mm for 2011, 2012 and 2013, respectively. Atmospheric evaporative demand estimated as vapor pressure deficit, resulted in mean ± SD daily values of 1.30 ± 0.34, 1.41 ± 0.27 and 1.94 ± 0.25 kPa for the dry periods of 2011, 2012 and 2013, respectively. Therefore, the 2013 measuring period was considered the driest of the 3 evaluated.
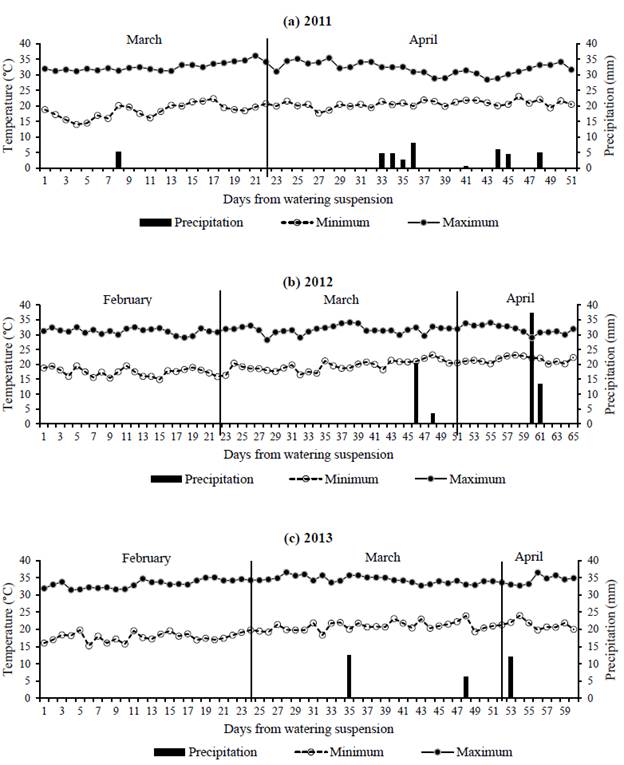
Figure 1 Daily rainfall (mm) and maximum and minimum air temperatures (°C) during the dry periods of: (a) 2011; (b) 2012; and (c) 2013.
Pattern of water depletion down the soil profile
Total transpirable soil water (TSW) for the entire profile (0-100 cm, n = 5) was 252.3 ± 55.5 mm. The corresponding values for 0-20, 20-60 and 60-100 cm segments of the profile represented 19 (46.8 ± 8.3 mm), 38 (97 ± 30.1 mm) and 43% (108.5 ± 24.9 mm) of the total TSW, respectively.
Across the entire soil profile, moisture reduction in all irrigated (WT) plots was around 20% (Figure 2), with slight increases after isolated rains occurring from day 30 onwards in each dry period (see Figure 1). For C. molle, the fraction of available water in unwatered (DT) plots during 2012 and 2013 was almost always significantly lower (P<0.05) than in irrigated (WT) plots, and followed more closely the trend over time observed with bare soil (Figures 2b and 2c). Minimum FTSW values in DT plots (Figures 2a-2c) were within the range: 48 (Year 2013) -58% (Year 2011). This corresponds with maximum losses from initial available moisture of 23 (Year 2011) to 56% (Year 2013). For C. macrocarpum, FTSW in DT plots was significantly lower (P<0.05) only in 2012, at day 43 after watering ceased and before rain replenished soil water to levels comparable with those in WT plots (Figure 2e). Over all dry periods, minimum FTSWs in DT plots of C. macrocarpum were always above 60%, with a 36% maximum reduction of initial available moisture (Figures 2d-2f).
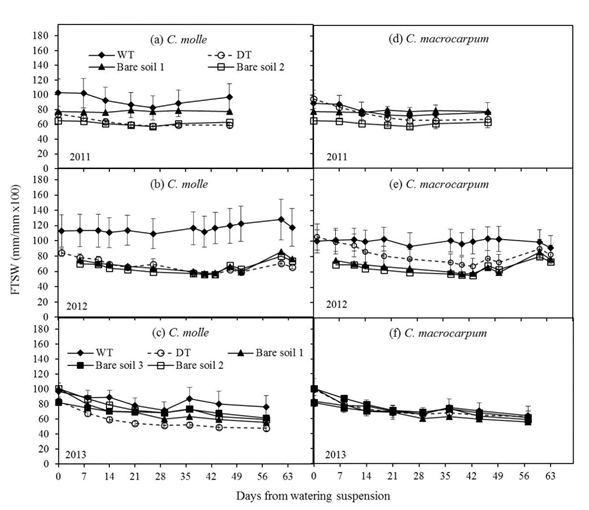
Figure 2 Changes in the fraction of transpirable soil water (FTSW) for the entire profile (0-100 cm), in plots (n = 4) of C. molle and C. macrocarpum during the dry periods of 2011, 2012 and 2013. WT: irrigated treatment, DT: drought treatment. Recorded values for bare soils (1 -2 for years 2011 and 2012; 1 -3 for year 2013) are included. Vertical bars denote standard errors.
Major decreases in the fraction of transpirable soil water (FTSW) were recorded at 0-20 cm depth (Figure 3). For both legumes, the pattern of soil moisture loss in 2011 was similar between treatments (Figures 3a and 3d), with minimum FTSW values for DT plots, which were in the range: 39 (C. macrocarpum) to 56% (C. molle). Accordingly, maximum percentages of moisture loss were 70 and 53% of initial stored soil water, respectively. For the drier periods of 2012 and 2013, reductions in the initial available soil moisture were more evident. Regardless of species, significant differences (P<0.05) were found between WT and DT plots within a week of watering suspension in the DT plots (Figures 3b-3f). Lowest values of FTSW were recorded in 2013 (13-20%), followed by 2012 (25-30%). By 2013, this implied a near complete depletion of soil moisture at 20 cm depth (85-90% reduction of initial TSW). The sudden and large increases in FTSW at this depth in both years were the result of isolated showers (see Figure 1). The unexpected and significant decreases of available water in the WT plots were probably related to insufficient irrigation to counter evapotranspiration. However, these drops of FTSW did not affect water relations in either legume (as discussed below). The relatively higher differences in the time trend of FTSW among bare soils at 0-20 cm (Figure 3) when compared with 0-100 cm (Figure 2) may reflect a much higher soil variability in water holding capacity in the upper soil layers.
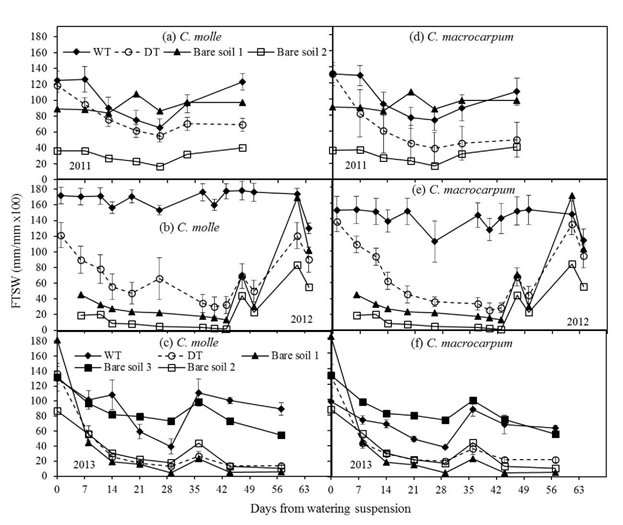
Figure 3 Changes in the fraction of transpirable soil water (FTSW) for the topsoil (0-20 cm), in plots (n = 4) of C. molle and C. macrocarpum during the dry periods of 2011, 2012 and 2013. WT: irrigated treatment, DT: drought treatment. Recorded values for bare soils (1 -2 for years 2011 and 2012; 1 -3 for year 2013) are included. Vertical bars denote standard errors.
At 20-60 cm depth, changes in FTSW over time were similar for both legumes, with no significant differences (P>0.05) between WT and DT plots and relatively small losses of stored moisture (15-30% reduction across years) (data not shown). Changes in FTSW for WT and DT plots were very similar to those in bare soils, and changes in soil water content at 60-100 cm depth were negligible (data not shown). Smaller differences in FTSW among bare soils indicated a rather lower soil variation in texture of these soil layers.
Dry matter yield and biomass partitioning, SLA and LAI
In general, total forage yields were 37-207% greater in 2013 than 2011. By the end of the 2011 dry period, aerial biomass of both species and treatments was relatively similar among plots, varying from 93 ± 35 g/m2 (C. molle, WT) to 120 ± 14 g/m2 (C. macrocarpum, DT) (Table 1). Similarly, partitioning of shoot biomass was not affected by drought (P>0.05, Table 1). Dry matter yields of green leaf, stem and standing dead varied, respectively, within the ranges: 53 ± 24 (C. molle, DT) to 74 ± 16 g/m2 (C. macrocarpum, DT); 27 ± 10 (C. molle, WT) to 45 ± 8 g/m2 (C. macrocarpum, DT); and 2 ± 2 (C. macrocarpum, DT) to 10 ± 5 g/m2 (C. molle, WT) (Table 1), while leaf:stem ratio remained relatively constant (1.7-2.3). In each species, SLA and LAI did not differ significantly between watering treatments (P>0.05). Overall, SLA varied from 220 ± 26 (C. macrocarpum, DT) to 310 ± 33 cm2/g (C. molle, WT), whereas the corresponding range for LAI was 1.3 ± 0.6 (C. molle, DT) to 1.7 ± 0.6 (C. molle, WT; C. macrocarpum, WT and DT) (Table 1).
Table 1 Leaf, stem, standing dead and total aerial biomass (g/m2), leaf:stem ratio (L:S), specific leaf area (SLA, cm2/g) and leaf area index (LAI) of 2 Centrosema species. Data were recorded from plots harvested at 47 (2011) and 45 days (2013) after watering of the drought treatment ceased. WT: irrigated treatment, DT: drought treatment.
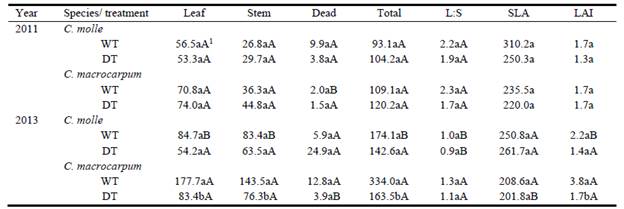
1For each year and plant trait, different lower- and upper-case letters denote significant differences (P<0.05) between treatments within species, and between species within treatments, respectively.
For the 2013 harvest, differences in forage biomass were more evident, with WT plots of C. macrocarpum having a higher LAI, and yielding more than C. molle (P<0.05, Table 1). Differences between WT and DT were present only in C. macrocarpum, especially after 30 days of regrowth (data not shown), with nearly 50% reduction of LAI and above-ground biomass (P<0.05) by the end of the experiment (day 45, Table 1). Lower forage yields in DT plots were associated with proportional reductions in green leaf and stem DM; thus the leaf:stem ratio (1.2 ± 0.1) remained unaffected (P>0.05) by low soil moisture (Table 1). Likewise, leaf morphology (expressed by SLA) in both legumes was not altered by drought, with mean values within the range 202-262 cm2/g (Table 1). However, DT plants of C. macrocarpum produced lower (P<0.05) leaf area per unit dry weight than C. molle (Table 1). The highest production of dead biomass (25 g/m2) was recorded in DT plots of C. molle, in comparison with only 4-6 g/m2 in C. macrocarpum (Table 1).
Leaves of both legumes showed paraheliotropic movements during the day: the 3 leaflets of each trifoliate leaf folded parallel to the direction of incoming solar radiation (Plate 1). Daily leaf movements in both species started earlier in DT plots.
Plate 1. Leaf movements in C. molle and C. macrocarpum. The corresponding leaf water potentials (Pi) are: (a) -0.2 to -0.1 MPa (well-watered plants); (b) -0.6 to -0.4 MPa (mild water stress); and (c) <-0.7 MPa (severe leaf wilting).
Plant water relations and gas exchange
During 2011 (data not shown), time trends in leaf relative water content (RWC), Pi and net photosynthesis (A) were similar between WT and DT plots of both species. However, in DT plots of C. molle there was a significant (P<0.05) decline in dawn Pi, RWC and A a week after watering ceased, when FTSW at 0-20 cm was still above 55-60% (see Figure 3a). Lower values in water relations and A persisted for 2 more weeks, when they started recovering in comparison with WT plots due to associated rains at the end of the dry period (Figure 1b). Average leaf RWC, Pi and A for the 2 species were within the ranges: 69-90%, -0.8 to -0.3 MPa and 11-25 umol/m2/s, with no differences between species.
In 2012, variations in leaf water relations and net photosynthesis within both species followed similar patterns, responding again to changes in soil water content in the upper soil layer. Here, a rather progressive drop in water relations was observed as surface soil dried during the first 4-6 weeks after watering ceased (Figure 4). Centrosema molle was more affected by dry soil conditions, DT leaves at day 40 showing significantly (P<0.05) lower RWC (75.5 vs. 84.0 %), and A (11.1 vs. 15.0 umol/m2/s) when compared with leaves on irrigated plants; this resulted in net declines from WT plot values of 10 and 26% in RWC and A, respectively (Figures 4a and 4c). In irrigated treatments, minimum midday leaf water potentials varied from -1.25 MPa (C. molle) to -0.91 MPa (C. macrocarpum). Subsequently, and with the exception of leaf RWC, an increase in midday Pi and A in both WT and DT leaves was recorded (Figure 4), in response to the incidence of isolated rains at the end of that dry period (Figure 1b) that recharged surface soil water levels (Figures 3b and 3e).
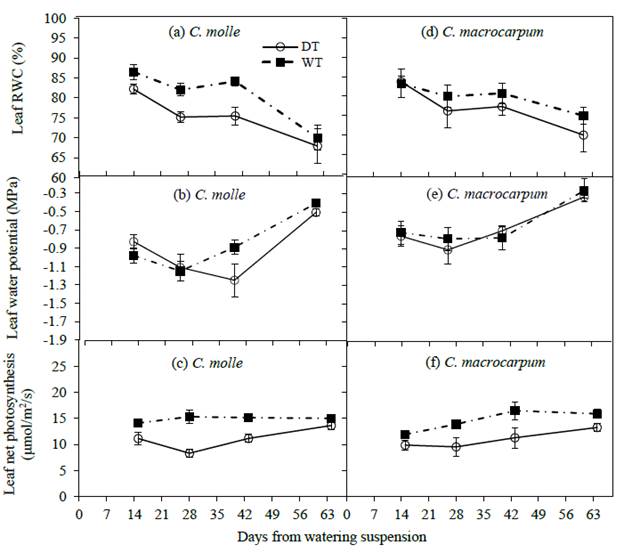
Figure 4 Changes in leaf relative water content (RWC), water potential (Ψl) and net photosynthesis (A) in C. molle and C. macrocarpum (n = 12-16) during the 2012 dry period. WT: irrigated treatment, DT: drought treatment. Vertical bars denote standard errors.
During the driest months of 2013, significant declines (P<0.05) in water relations and A in DT plots occurred as soon as 2-3 weeks after drought conditions were imposed (Figure 5), as surface soil moisture was rapidly depleted following suspension of watering (Figures 3c and 3f). As expected, net photosynthesis began declining earlier when Ψl at dawn was still not affected by dry conditions, though FTSW values were already low (i.e. 13%, see Figure 3c). Drought effects were more evident in C. molle, for which the greatest differences between WT and DT leaves were observed. Indeed, droughted leaves of C. molle showed final percentage reductions (compared with respective values for WT leaves) of 430% in Ψl (-0.3 to -1.6 MPa), 18% in RWC (85 to 70%) and 68% in A (25 to 8 umol/m2/s), in contrast with 60% (-0.25 to -0.4 MPa), 7% (81 to 75%) and 32% (22 to 15 umol/m2/s) for C. macrocarpum. In addition, RWC, dawn Pi and A in droughted leaves of C. molle did not recover (Figures 5a-5c) following the isolated rains received by the end (day 45 onwards) of the dry period (Figure 1c). Lower Ψl values in this species were also associated with strong leaf wilting (see Plate 1).
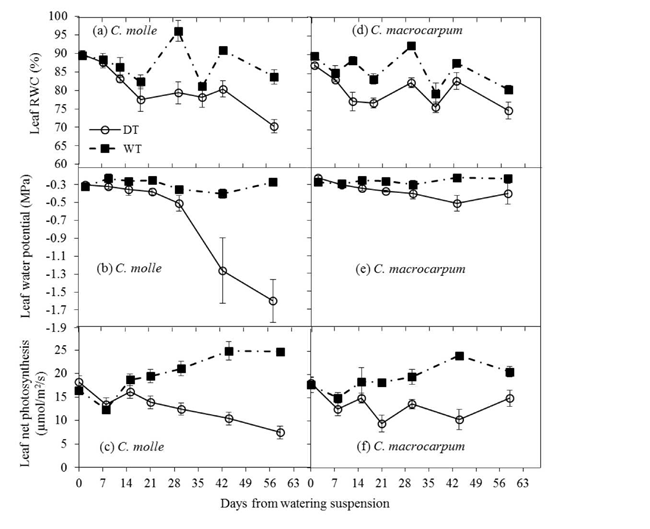
Figure 5 Changes in leaf relative water content (RWC), water potential (Ψl) and net photosynthesis (A) in C. molle and C. macrocarpum (n = 12-16) during the 2013 dry period. WT: irrigated treatment, DT: drought treatment. Vertical bars denote standard errors.
The Fv /Fm ratio showed a common trend of decreasing by midday, with a slight recovery late in the afternoon. However, the accumulated effects of drought on chlorophyll a fluorescence appeared to be more detrimental for C. molle than C. macrocarpum. By day 55 of drought (year 2013), the lowest value of the Fv /Fm ratio in stressed plants of C. molle was 0.53 compared with 0.70-0.75 in irrigated plants (P<0.05), with no apparent recovery of PSII by the end of the day. By comparison the respective daily values for C. macrocarpum were always above 0.70, with no significant differences (P>0.05) between watering treatments (Figure 6).
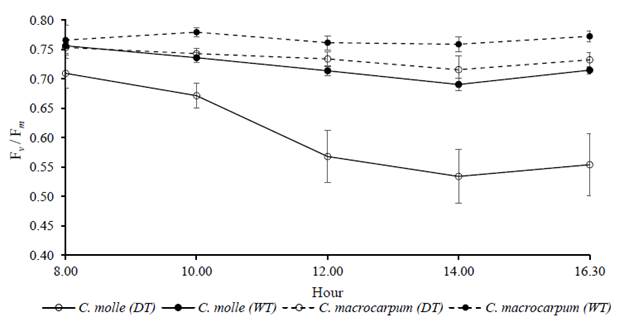
Figure 6 Daily courses of chlorophyll a fluorescence (measured as Fv /Fm ratio) at day 55 of drought (year 2013), in leaves (n C. molle and C. macrocarpum. WT: irrigated treatment, DT: drought treatment. Vertical bars denote standard errors.
Data from both species during the 2013 dry period showed a common and rapid decline of stomatal conductance (gs) within a rather narrow range of leaf water potentials (-0.4 to -0.2 MPa), which was close to that maintained by well-watered plants (Figure 7).
Discussion
Effects of drought conditions on plants depend on duration, frequency and intensity of water deficits. The 3 consecutive dry periods evaluated in this study simulated this variability as water stress conditions were of variable duration and intensity, because of differences in air evaporative demand and water supply by sporadic rains. Overall, our study showed that C. molle and C. macrocarpum had a common response to progressive soil water depletion, while some contrasting acclimation traits to cope with long water stress conditions were evident. Some differences between treatments failed to reach significance because of variability in measurements. A larger number of replications may have shown more of the differences as significant.
Growth and dry matter production under water-limited conditions
To optimize C assimilation and usage during drought, DM accumulation is reduced in all plant components, though with different magnitudes (Farooq et al. 2012). In forage plants, a decrease in growth and development of leaf area is the first sign, resulting in smaller leaves and reduced LAI (Sanderson et al. 1997). In addition, rates of leaf and stem production are affected and depend on species and water stress conditions (Likoswe and Lawn 2008). Turgor loss seems the primary factor limiting growth by blocking cell elongation and division (Farooq et al. 2012). Declines in plant growth and DM production in herbaceous legumes can vary between and within species (Likoswe and Lawn 2008; Pang et al. 2011) and in this study the magnitude of the reductions in DM production appeared to vary according to plant age. The absence of effects on DM yields in both legumes in 2011 may be a consequence of transpiration demands of the young plants (leaf:stem ratio about 2.0) being fully supplied by the stored soil water. On the contrary, during the drier period of 2013 larger plants, especially those exposed to continuous drying, demanded more water than was available in the upper soil layers. Consequently, for C. macrocarpum reductions in growth of leaf and stem on unwatered plots resulted in lower forage yields than on irrigated plots. We expected similar results in C. molle, since field observations showed an even higher level of wilting and leaf senescence in unwatered plots of this legume, which was associated with a larger decline in water relations and gas exchange after 40 days of soil water stress (see below). As mentioned earlier, high variability in forage biomass (with a variation coefficient in shoot DM near 70% among replicates) may explain the lack of significant differences in DM production between WT and DT plots of this species.
Morphological traits contributing to drought acclimation in the field
Drought evasion is related to the ability to sustain initial plant water status for a longer time by increasing access to deep soil water or minimizing water losses through transpiration (Blum 2005), and plasticity in leaf expansion, transpiration control and root proliferation are essential for drought resistance (Turner and Begg 1981).
During the first dry period, small variations in LAI within legumes were the result of very small variations in SLA and leaf biomass among treatments. In this case, comparable patterns of soil water extraction with time may suggest similar plant responses between watering treatments in response to evapotranspiration demand. On the contrary, during the driest evaluation period, the smaller accumulation of LAI in unwatered plots of C. macrocarpum when compared with irrigated plots, was due to reduced C investment in assimilatory (leaves) and supporting organs (stems), resulting in reduced leaf area production per unit dry weight (SLA). Therefore, it appears that C. macrocarpum controlled transpiration primarily by a reduction in leaf area, since leaf senescence appeared to be delayed by the relatively higher level of leaf stiffness (De Micco and Aronne 2012) present in this species. Conversely, field observations indicated a shorter leaf lifespan and a higher level of leaf turnover in C. molle. These species appeared to use different strategies to cope with water deficit, i.e. increased leaf wilting and senescence in C. molle, and a decline in leaf biomass production in C. macrocarpum. Under water-limited conditions, SLA decreases due to active accumulation of cell wall components (Barker and Caradus 2001), which aids in reducing transpiration (De Micco and Aronne 2012; Farooq et al. 2012). However, this study showed the low plasticity of SLA (or alternatively, LMA: leaf mass area) to reduced water availability. Indeed, in forage grasses and legumes, opposite effects of water stress on cell wall contents have been reported (Wilson 1983; Sanderson et al. 1997; Guenni et al. 2002). Hence, in these Centrosema species, parallel modifications of equal magnitude in leaf area and cell wall content may result in SLA (or LMA) having low potential for acclimation to drought. Under water stress, reduction in relative growth rate (RGR) has been positively related to decrease in SLA, leaf mass ratio (LMR) and leaf area ratio (LAR), though there is a high variability of responses among species and growth habits (Lambers et al. 2008; Pang et al. 2011).
An alternative approach to diminish transpiration without compromising surface area for gas exchange is through a daily change in leaf orientation angle (Turner and Begg 1981; 11). Leaflets of both Centrosema species turned to almost vertical orientation by midday (Plate 1). As soil water depletion advanced during the dry period, this condition became more obvious (starting earlier during the day) in unwatered plants. This active leaf movement allows a reduction in heat load on the leaf, and is common in arid environments (De Micco and Aronne 2012), as well as in many cultivated plants, including forage legumes ( Fisher and Ludlow 1984; Bell et al. 2007; Pang et al. 2011).
Another complementary strategy to delay negative effects of soil drying is to increase access to deep water in the soil profile, especially when combined with higher stomatal control (Sheriff and Ludlow 1984; Wang and Yamauchi 2006). In this study, though we did not measure root growth and distribution, the pattern of water depletion down the soil profile provided an insight of particular strategies for water use during drought. In both Centrosema spp. water needs were rather low. Indeed, most of the extracted soil water (driven mainly by evaporative demand) came apparently from the upper (20 cm) layer, which represented only about 20% of the initial moisture available in the soil profile. This was followed by a much smaller usage from the 20-60 cm stratum, with no apparent utilization of water deeper in the soil profile. This pattern of water usage may not represent a typical evasion strategy for these species with a tap root system, as deep root systems or increased root biomass/lengths at depth in herbaceous legumes (Pang et al. 2011) and grasses (Guenni et al 2004; Cardoso et al. 2015) are traits which potentially improve water extraction. Certainly, this pattern of water usage is opposite from what has been reported for these and other tropical forage legumes growing on deep sandy soils (Guenni et al. 2007). A predominantly sandy soil with lower water retention capacity may induce more root growth to extract water from deeper soil horizons (Guenni et al. 2007). For the loamy soil characteristic of this study, water utilization from only the upper layers appeared to be sufficient to maintain minimum growth and compensate for transpiration demands, but with a possible metabolic cost associated with root nodule activity, which have shown to be adversely affected by water stress (Wery et al. 1986; Silveira et al. 2001). Overall, conservative use of stored water, rather than water extraction from deeper in the profile, was likely to be more advantageous to maintain forage production under the soil conditions of the experimental site. Ultimately, plant survival will depend upon access to deep soil moisture.
Physiological acclimation to drought conditions in the field
Both Centrosema species showed a drop in water relations and leaf gas exchange with prolonged drying of soil in the absence of irrigation, similar to other forage and grain legumes (Ludlow et al. 1983; Collinson et al. 1997; Hamidou et al. 2007; Bell et al. 2007; Pang et al. 2011). Without an apparent loss of turgor in leaf tissue during the first 4-5 weeks of the drying cycles, stomatal conductance was very sensitive to a given change in leaf water potential, though net CO2 exchange was affected only when a significant drop in leaf water content occurred. These effects were again, both time- and species-dependent.
Overall, detrimental effects of soil water deficit were more obvious when the dry period was more severe, with surface FTSW being depleted below a threshold value (ca. ± 25%). Under such conditions, stomatal conductance and photosynthesis in C. molle had the highest reductions (about 70%), with predawn leaf water potentials <-0.7 MPa and decreases in relative water contents to 70% at the end of the drying cycle. In contrast, the lower reduction (± 40%) in gas exchange in C. macrocarpum was always associated with leaf water potentials and RWCs greater than -0.5 MPa and 70%, respectively. Similar fluctuations in water relations and photosynthesis for these and other herbaceous perennial legumes have been reported elsewhere (Guenni et al. 2007; Pang et al. 2011). Interestingly, Guenni et al. (2007) reported lower reductions in these physiological traits in C. macrocarpum when grown in a deep sandy soil during the dry season. This suggests an effective control of water loss as found in Macroptilium atropurpureum cv. Siratro (Fisher and Ludlow 1984; Pang et al. 2011), though at the expense of reduced DM production (Turner and Begg 1981; Farooq et al. 2009; Pang et al. 2011).
Therefore, the proposed less effective control of water loss in C. molle resulted in a rapid drop in C assimilation as soil continued drying. Subsequently, as stated for C3 plants by Flexas and Medrano (2002), Medrano et al. (2002) and Farooq et al. (2009), a damage to the biochemistry of photosynthesis occurred later as drought became more intense, when water reserves at the soil surface reached minimum values and leaf water potentials were much lower than in C. macrocarpum. This situation may trigger considerable leaf senescence to prevent further water losses, thus affecting production of green forage for the remaining dry period. Nevertheless, biochemical damage to the photosynthetic quantum efficiency caused by photo-inhibition under water stress (Pastenes et al. 2005; Lauriano et al. 2006), and possibly increased by high radiation and/or temperature conditions (Lambers et al. 2008), seemed to be easily reversible, due to the rapid regrowth of C. molle after the onset of the rainy season.
As no visual wilting was observed in C. macrocarpum even after 40 days of low soil moisture levels, it is proposed that leaf turgor and higher leaf water potentials and photosynthetic rates at harvest were sustained mostly by a strong leaf isohydric behavior (Lambers et al. 2008; Limpus 2009). On the other hand, osmotic adjustment in C. molle was likely to be more responsible for the maintenance of minimum photosynthesis after the sharp drop in leaf water potential and RWC, which occurred nearly 4-5 weeks after the imposition of water stress. Furthermore, leaves of this species may have been slowly preconditioned for osmotic adjustment during previous milder water stress conditions. Evidence of dehydration tolerance through osmotic adjustment exists in a range of Centrosema species (Ludlow et al. 1983; Fisher and Ludlow 1984; Guenni et al. 2007). This physiological strategy may be important as the intensity of water deficits increases, allowing the maintenance of cell turgor and hence soil moisture extraction for minimum photo-synthetic activity and biomass production during the last part of the drying cycle (Ludlow et al. 1983; Pang et al. 2011; Farooq et al. 2012). Furthermore, as many species respond at a rather lower range of critical water potentials and a single species can even shift between isohydric and anisohydric behavior (Maseda and Fernández 2006; Limpus 2009), leaves of C. molle might have then behaved as partially isohydric (or anisohydric) at more negative soil matrix potentials. This acclimation to water stress should be accompanied by a reduction in leaf area and narrower xylem conduits to avoid embolism and sustain a balance between growth and water loss by transpiration at very low water potentials (Maseda and Fernández 2006; Bresta et al. 2011). The possible link between osmotic adjustment and induced structural changes in xylem hydraulics to drive survival of both Centrosema species under prolonged dry conditions deserves more investigation.
Conclusions
This study has confirmed that, to survive in seasonally dry tropical environments, both species of Centrosema exploited a combination of water stress postponement strategies and some degree of tolerance of progressive soil drying. In our study, both legumes, in spite of having a taproot system, extracted water mainly from the topsoil, while regulating further water usage from deep storage in the soil profile by a primary control of stomatal opening and the size of leaf area exposed to solar radiation. Subsequently, though not explored in this study, tolerance mechanisms aided by osmotic adjustment and perhaps a reduced vulnerability to embolism, complement the set of plant strategies for survival under seasonal water stress conditions. However, the present results suggest that the expression of such combinations of adaptive traits depends on species plasticity, and the duration and intensity (magnitude) of seasonal low soil moisture conditions. Therefore, the observed expression of morpho-physiological characters and forage production responses to seasonal drought results in enhanced C. molle performance in tropical pastoral areas with relatively short dry periods, and C. macrocarpum having an advantage in environments with longer dry periods as indicated by Cook et al. (2005). Further studies with a range of accessions/genotypes drawn from different geographical sites within the natural distributions of both species are warranted to corroborate and complement the present findings.


