


 English (pdf)
 Article in xml format
 Article references
 Send this article by e-mail
 Cited by SciELO
  Cited by Google
  Similars in
SciELO
Similars in
SciELO  Similars in Google
 Permalink
1. Introduction
Over recent years, urban transport planners have attempted to promote the bicycle as an alternative mode of transportation. Reducing car usage would not only create positive social and economic effects but also positive effects for the individual. Bikes are cheaper and more efficient that cars and public transport, but in large cities the use of bikes has huge obstacles. The main hurdle is the long distances that people have to travel to commute or study. In this respect, complementing public transportation with cycling could improve its performance. However, implementation is more complicated in developing countries as, on a psychological level, people think that owning a car is synonymous with well-being.
This research tries to evaluate the location of the bike-sharing system’s users as well as the location of the bike stations. The users are first located with Google API, which obtains their coordinates based on their address. The location-allocation problem is subsequently resolved with the network analyst toolbox in Arcmap 10.2.
1.1. City being analyzed
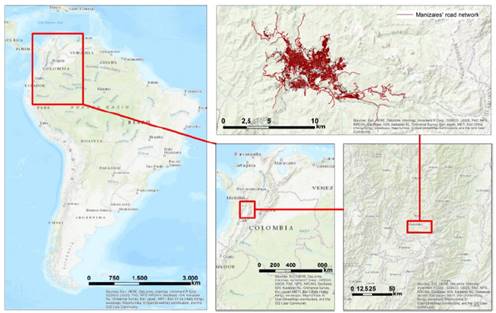
As can be observed in Fig. 1, Manizales is the capital city of Caldas (one of the smallest Colombian departments), which is located in the Colombian Central Mountain Range. According to IGAC1 this city has an extension of 508 km2, and, according to Mobility Urban Plan of Manizales, the urban transport network is about 749 km in length. According to DANE2, the city has 415.124 residents distributed in 114 neighborhoods3. The city has a BSP program called “Manizales en Bici”, which has been operating for two years and has 135 bikes distributed throughout eight (8) stations. It can be seen in Fig. 2

The literature on cycling has grown rapidly over the past decade as it has become a popular mode of transportation. Since 1965, cycling has become an alternative mode of transportation due to a scheme called “bike-sharing system” [1-3], which is a public service: people who need to travel from one point to another can pick-up a bicycle from a station near their origin and return it to a different station near their destination [4]. From 1965 to date, BSS have been implanted in more than 1,188 cities around the globe and have a total of more than 2,294,600 bicycles [5,6]. This shows the positive impact that BSS has generated and has the potential to generate despite the fact that the car is currently more widely used in urban areas [7].
Over the last decade, several manuals, such as the OBIS4 project, have tried to establish the way BSS needs to be implemented [8]; however they lack technical experience due to the field´s recent development. The more critical guides that have been elaborated are the planning guide suited for the American experience [9] and the global experience guide [10]; both detail the variables that need to be evaluated in order to plan a BSS in a modern city. The latter has four principles to plan a system:
Minimum coverage of the system must be 10 km2.
It was estimated that a value within a range of 10 and 30 bikes per 1000 inhabitants is an optimum value.
Station density: a value between 10 and 16 stations per square kilometer was recommended.
There should be between 2 and 2.5 spaces to anchor each bike.
These principles were used to propose a relevant indicator that analyses the context of transportation system coverage [11]. The first step to improve BSS coverage is to establish the optimal location of the bike stations [12,13]. Stations must be located close to other stations to give people the facility to make short trips as well as being located in residential, commercial, and cultural areas to increase the number of origins and destinations and provide the possibility of trips on bikes for commuting or studying [14].
In large cities, BSS have become important and complementary to public transportation; they help raise the transportation system’s radius of influence. For this reason, stations must be located near the public transportation network [15]. In Europe and Japan, many BSS have been installed in areas closest to the rail and Metro stations [1,15].
Defining the optimal location for urban facilities is an important issue, not only for BSS, but also for issues relating to urban planning. Since the location-allocation problem was analyzed [16-19], there have been many studies to find the best location for different types of urban facilities: the most frequent are the following: health care facilities [20], schools [21], open-space planning [22], container yards, waste disposal [23], conservation-reserve planning [24], optimal location of bike stations [12,25,26], and feasibility roads infrastructure, etc.
Optimal location models for locating any type of equipment are contained in many GIS software packages. This study used the location-allocation problem by ArcGIS Network Analyst. For most Network Analyst problems, the principal algorithm is the multiple shortest path of the Dijkstra algorithm [27]; however, in this case, we used a solver for the facility location problem by ArcGIS Network Analyst (location-allocation package). We also used Heuristics to solve the location-allocation problems. This solver begins by creating an origin-destination matrix of shortest-path costs (time, distance, impedance, etc.) between identified demand point locations and all the target facilities along the network. Given M demand points with a weight and N candidate facilities, the solver process choose a subset of the facilities, P, so that the sum of the weighted cost (time, distances, impedances, etc.) from each M to the closest P is minimized [28].
2. Methodology
The methodology used in this research has five stages: First, Manizales’ transport network was updated to accurately develop the model, and the data related to the speed between each link of the network was analyzed and established. Two alternatives were then defined based on the city’s characteristics. The second stage was geolocating the Manizales bike-sharing system’s registered users with Google API Open Refine. The third stage is calculating the location-allocation problem using ArcGIS for the current situation and the two alternatives; in this stage, we used the Institute for Transportation and Development Policy (ITDP) guide, which states that each station has a 500 meter sphere of influence [10]. The fourth stage involves analyzing the results. The fifth is the comparative analysis with the current situation and the two alternatives. An overview of the methodology is presented in Fig. 3.

2.1. Updating the transport network and the new proposals
The principal tool to develop accessibility models is a transport network, composed of nodes and arcs: nodes represent intersections and arcs represent road segments in which the average speed is loaded. In some cases, additional nodes are located to improve the interpolation of data.
Manizales’ transport network was created in the 2010 PMM, and it was updated based on official documents such as the Territorial Management Plan (POT for its acronym in Spanish) and non-official documents including the Alcaldía de Manizales’ aerial photos, google maps, street view, and open street maps.
“Manizales en Bici” was planned without demand studies, and its bike stations were implanted intuitively in places where people usually go on a daily basis. It is for this reason that the two alternatives studied are based on sociodemographic data and the population distribution that are both included in the current POT.
For the first alternative, the same approach was used: crowded places marked new stations. 29 bike stations (8 current stations and 21 new stations) were implanted, which increased the number of stations in the system by 262.5%. See Fig. 4.

For the second alternative, new bike stations in residential areas were used based on POT sociodemographic information. 46 bike stations (8 current stations and 36 new stations) were implanted, increasing the number of stations in the system by 475%. See Fig. 5. The operational speed was stored in the road segments as it provides information that can be used to calculate the travel time in the arcs: we defined the theoretical walking speed. Previous research showed that average walking speed is about 4.32 km/h and is affected by the network slope: 0.36 km/h for 10% [29].

2.2. Bike-sharing users’ location
The database with the users’ addresses was obtained from “Manizales en Bici”, the company which operates the system. In the database, each user is identified with only one ID and one home address. First the database was cleaned as it registered some inaccurate values. For example, the cells had different ways of registering the word “Carrera”, (one name for a street): “KR”, CR”, and “Kra”. The main goal was to unify the words in all the rows in the database. For that reason, we developed a unification criteria:
Initial Code: refers to the principal name of the street: “Carrera”, “Calle”, or “Avenida”.
First Number: refers to the number of the main street.
Symbol “#”
Second Number: number of the second main street.
Symbol “- “
Door: door number.
In this order, the code would be:
Initial Code_First Number_#Second Number-Door.
Calle 24 #21-30.
Afterwards, in Google’s API Open Refine, the database was updated. A first column was created to obtain the general data from Google using the command:
http://maps.googleapis.com/maps/api/geocode/xml?address='+escape(value,'url')+',+Manizales,+Caldasandsensor=false'.
The next stage was to obtain the latitude and longitude from the data.
Latitude value.parseHtml().select("geometry")[0].select("location")[0].select("lat")[0].replace("<lat>","").replace("</lat>","")
Longitude value.parseHtml().select("geometry")[0].select("location")[0].select("lng")[0].replace("<lng>","").replace("</lng>","").
After obtaining the coordinates for each user, the data was uploaded in Arcmap. Overall, the data contains 3,314 registered users.
2.3. Location-allocation problem
“Location-allocation (LA) problem is to locate a set of new facilities such that the transportation cost from facilities to customers or customers to facilities are minimized and an optimal number of facilities have to be placed in an area of interest in order to satisfy the customer demand.” [30].
The basic components of the location-allocation problem consist of facilities, and customers. In this research, facilities consist of the bike stations, and customers consist of system’s registered users.
If it is assumed that there are a number of customers (n) and several facilities (m), the main goal of this algorithm is to reduce the total cost of transportation between the facilities for customers (φ).
The eq. (1) resumes the formulation of the location-allocation problem, where Wij is the quantity supplied to customer j by facility i; d(xi,aj) is the distance between a customer j and a new facility i; xi are the coordinates of the new facilities i=1, 2, …., m.

The model, in this case, has only one constraint; the maximum distance which the station could cover is 500 meters, d (xi, aj) <=500.
3. Results
3.1. Current situation
Fig. 6 presents the results of the location-allocation problem for the current situation. It shows that users are almost uniformly distributed throughout the city. However, there are not many people within 500 meters of the stations. The system works for around 698 of the 3,314 registered users, which represents only 21.06% of users who were registered by June 2016 who have an average of 332 meters to get to any station. Those 698 users represent 0.17% of the city’s total population. If only 0.17% of population are registered, the system has no efficient coverage, and it needs to be improved.

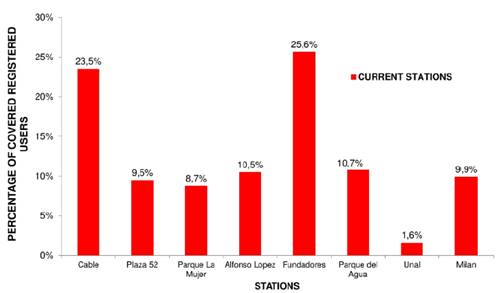
Fig. 7 shows the distribution of registered users covered by each station. Fundadores station and Cable station are the most important stations in the system. Both stations service almost the 50% of users in the city while Unal station has only 1.6% of users. Despite not having many users near the station, Unal station is important as it is located near the university zone in Manizales: an area which attracts many trips during the day.
3.2. First alternative
Fig. 8 presents the results of the location-allocation problem for the first proposal. Increasing the number of stations improves the system’s coverage. However, the system works for around 1,423 out of 3,314 registered users, which represents only 42.94% of users who were registered by June 2016 and who have an average of 324 meters to get any station. The 1,423 users represent 0.34% of the city’s total population. Between the current situation and the first proposal, coverage increased by only 0.17%: meaning that there was low coverage despite increasing the number of stations.
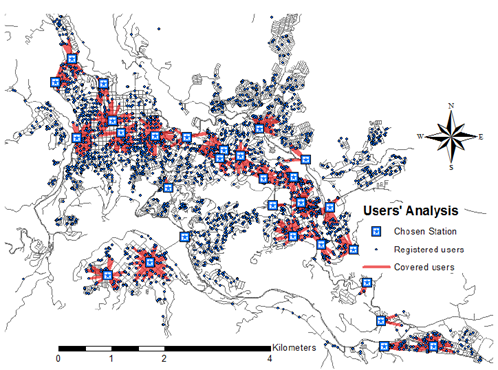
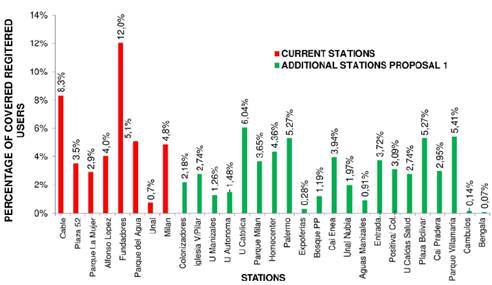
Fig. 9 shows the distribution of registered users in the stations. Fundadores station and Cable station continue to be the most important stations in the system. Both serve almost 20% of registered users in the system. Despite not having many users near the station, Unal station, Expoferias station, Cambulos station, and Bengala stations, are in zones that have a high number of trips. Users who are not assigned to any station are those people who, despite being registered, have no station within 500 meters.
3.3. Second alternative
Fig. 10 presents the results of the location-allocation problem for the second alternative. The system services around 2,022 of 3,314 registered users, which represents only 61.01% of users who were registered by June 2016 and who have an average of 332 meters to get to any station. Those 2022 users represent 0.49% of the city’s total population. Coverage increased by 0.32% from the current situation.

These results show that Sena station, Licorera station, and Maltería station do not cover any of the system’s users; for this reason, they appears in red in the figure.
Fig. 11 shows the distribution of registered users covered by the stations. Fundadores station and Cable station continue being the most important stations. This trend has been shown in the current situation and the two new alternatives, and it indicates that the implementation of these stations was correct from the beginning as they generate and attract several trips throughout the day.

3.4. Comparative analysis between current situation and the two alternatives.
Fig. 12 presents the comparative coverage of the current situation and the two alternatives. Increasing the number of stations will increase the number of users who are within 500 meters of the stations. These users could use a bicycle to commute or study. The second alternative shows 61% of registered users; however, on comparing this value with the city’s total population, only 0.49% of population is covered.

5. Conclusion
This research was developed based on the location of the stations and the location of the users registered in June 2016. Data related to the trips in the system could not be obtained, so the analysis only emphasizes in spatial coverage. The system should collect all data related to trip origins and destinations, user profiles (to understand their behavior), and common users’ socioeconomic characteristics.
Manizales bike-sharing system needs to be improved to become an alternative mode of transportation. Technical studies need to be carried out for system expansion. It has been shown that despite having users throughout the entire city, the system cannot be used for daily trips by more than 90% percent of population as they would need to travel long distances and spend a considerable amount of time to get to where the stations are currently located. Specialized studies by experienced transport planners need to be undertaken to enhance the system’s performance.
In this research, distance was used as the impedance to analyze the influence of a bike station; however, in the future, it is highly important to evaluate monetary costs, physical impediments, slopes, bike road tracks, meeting points, and social behavior to obtain a better understanding of bike sharing users. This is because accessibility based on travel time and distance may favor faster modes rather than slower modes.
Future research needs to prove that one of the system’s the main characteristics should be bike stations that are close to bus stops. As such, the bike-sharing system can be used as an extend form of public transportation, which would solve the first and last mile of travel and increase Manizales transport system’s radius of influence.

