


 English (pdf)
 Article in xml format
 Article references
 Send this article by e-mail
 Cited by SciELO
  Cited by Google
  Similars in
SciELO
Similars in
SciELO  Similars in Google
 Permalink
INTRODUCTION
Worldwide quality in natural resources has been suffering a growing spoiling nowadays specially in water resources because of the effusion of huge amount of home and industrial debris into them under the race of development. Among those debris commonly found in water bodies, paint industry waste is mostly effused. Wastewater resulting from these processes have an opposite impact in terms of Total Organic Carbon (TOC), hanged up solids, salt level, color in a wide range of pH and organic recalcitrant compound such as colorants “azo”. The relation DBO/DQO in the rank between 0.2 to 0.5 indicates that these affluents have a great amount of organic material non biodegradable 1. Though pigments or colorific make the world glower, at the same time it is a serious problem both biological and aesthetical as well, because of water coloration and changes or stopping photosynthesis process in the water ecosystem. Pigments in water or stain is the most obvious and common pollutants gauge and, effusion with high synthetic concentration of dye may cause a great damage to water bodies because of toxic compounds, mutagenic or carcinogenic 1,2,3, so it is necessary to treat all debris before effusion.
Pigments removal in wastewater has been a very great challenge for a long time trying to find both a cheaper and effective treatment 4. Some of these substances can stand biodegradation or changes because they are xenobiotic compounds in nature; there are very versatile microorganisms with a typical or distinctive metabolic system, which let them biodegradation these compounds bringing out decoloration and mineralization of them; Due to this, in recent years biotechnology is being used as an applied science for wastewater treatment of this kind 4,5, because they are environment friendly, they produce lower sludges at a lower cost 1. In this way, microalgaes are a good option for dyed wastewater bioremediation 6.
The decoloration mechanism with algaes may include adsortion, enzymatic degradation or a combination of both 7. The capacity of biosortion is attributed to its high surface area and its great affinity for bond 8,9. Functional groups such as hydroxyls, carboxylates, amines and phosphates in the cell surface are considered as direct responsible by means of electrostatic attraction and complexation, to remove pollutants from wastewater 4,10. Alike bacterias, algaes can degrade colorants “azo” through azoreductase that starts breacking the “azo” bond, producing aromatic amines 1,11-13. Oxydative enzymes also play part in this decoloration process 13.
Many species of micoralgaes such as Clorella sp. (14), Scenedesmus sp., or Desmodesmus sp. 15,16, Neochloris sp., Chlamydomonas sp. 17, Nitzschia sp., and Cosmarium sp. 18, have been used for many water treatments close to biodiesel production under controlled sterilized and non-sterilized conditions. Species like Chlorella, Scenedesmus, and some cianobacterias are the most used because their high growing speed, high tolerance to environment and their high capacity of amassing lipids/starch 14,19. On the other side, Chlorella sp., is widely used in wastewater treatments because of its better capacity of nitrogen, phosphorus removal and chemical oxygen demand (COD) 20.
This research tested the Chlorella sp., live microalgae capacity to treat decoloration biologically in wastewater from a paint factory in Barranquilla (Colombia), changing the initial concentration of microalgae, in absence or not of nutrients and the effect when it is immobilized.
MATERIALS AND METHODS
C hlorella sp . , growth. Microalgae used in this research was supplied by Photosynthetic Microorganism Laboratory from the Zulia University, Maracaibo (Venezuela). It was made a “stock” cultivating activity during a 15 days period time using a complex fertilizer NPK “Nutrifoliar” (Colinagro, Bogotá, Colombia), of composition: nitrogen total (200 g/L), P2O3 (100 g/L), K2O (50 g/L), MgO (10 g/L), S (14 g/L), B (1.5 g/L), Cu (2.5 g/L), Fe (1.0 g/L), Mn (1.0 g/L), Mo (0.03 g/L) y Zn (5.0 g/L); diluting 25 mL up to a volume of 500 mL with sterile water. This solution supplies both essential macro and micronutrients for a normal cell grow. To let microalgae grow 14 mL of the cultivated medium was placed inside a bioreactor in order to get a final concentration of 4 mM of nitrogen 21. Microalgae growth was tested during these days measuring chlorophyll absorbance at a wavelength (λ) 665 nm 22. Inoculation of microalgae Chlorella sp., was developed in glass bioreactors under sterile conditions at a temperature from 25 ± 1°C, in light photoperiods day/night of 12 hours with airing and continuous shaking at a flow of 1 mL/min using oxygen pumps made ac-1500, following the methodology described by Steffan et al 23.
Inoculums used are based on the normal behavior of a curve of growing for microorganism which indicates different adaptation phases, growing, stationary and death.
Wastewater sample. Wastewater sample was taken at the final effusion point at the paint factory and bottled in a plastic container. Sample was ready for biotests without any later treatment.
Biotests with live microalgae Chlorella sp., in suspension. In different previously sterilized 250 mL capacity glass bottles it was filled separately 200 mL of wastewater and 14 mL microalgae biomass at 0.10, 0.20, and 0.30 units of absorbance measured at a wave length λ= 665 nm 22, with and without nutrients, at a temperature of 25 ± 1°C, with a smooth shaking, making use of air pumps and photoperiods of time day/night of 12 hours. At the same time a growth control was taken to Chlorella sp., cultivation in sterile medium at the same absorbance values as biotested in wastewater.
At the end of these biotests aliquots samples were taken from bioreactors, then centrifuged at 3500 rpm for 7 minutes. From the overfloating liquid, absorbance was measured by spectrophotometry and calculated the rate of colorific removed, replacing values in equation 1 24,25:

Whereas is the initial absorbance of the medium and is absorbance in decolorated medium.
The calibration curve used consisted in relating the concentration of different dilutions wastewater without treatment volume/volume percentage and their respectively absorbance.
Analysis of DBO5 and DQO were made according to Standard Methods methodology, method 5210B (DBO5) and 5220D (DQO) only to that bio-test that recorded a higher decoloration percentage.
Analysis of results by analytical techniques. Chlorella sp., growth was tested through absorbance measured as λmáx = 665 nm conformable to chlorophyll absorption 22, making use of a UV-Vis spectrophotometer model LKB ultrospec II with a fixed λ (Biochrom Ltd. Cambridge, Great Britain). Concentration of dye wastewater samples was determined at λmáx = 514 nm obtained by scanning in a range between 200 and 750 nm.
Biotests with immobilized Chlorella sp . The immobilization of the microalga was carried out by the ion exchange gelation process, consisting of the dropwise addition of kappa carrageenan (Sigma, St Louis, MO) dissolved in a 2% KCl solution (Merck KGaA, Darmstadt, Germany) to live microalgae Chlorella sp., in suspension, at a concentration percentage of 0.66% m/m in order to get it encapsulated and immobilized. The relation used was 1 g of microalgae live in suspension by mL of kappa carrageenan 26,27.
All biotests were developed three times under the same laboratory conditions.
RESULTS
In the growth curve of Chlorella sp., (Figure 1a) you can see a linear behavior until day six with absorbance of 0.7. Thereafter you can see a slightly smooth growth from day six till day ten, which is the maximum absorbance with a value of 0.8 and, at the end, it begins a smooth slope that belongs to the same microalgae death phase later.

Figure 1 (a) Growth curve of microalgae Chlorella sp. (b) Calibration curve between absorbance and concentration in %v/v from dye wastewater dilutes, measured in absorbancy ranks between 0.02 y 1.6.
Calibration curve that set the removal of dyes percentage values is shown in Figure 1b. Adjustments of experimental data to a straight line carried out a correlation coefficient of 0.998, which offers a direct dependency between absorbance and concentrations of prepared dilutions.
Daily tracing of biotest absorbance with live Chlorella sp., in suspension with nutrients under respective controls are shown in Figure 2a and, the values of maximum absorbance and decoloration percentages are shown in Table 1. The growth of microalgae Chlorella sp., in the controls show a typical behavior: you can see an adaptation phase, then a strong development of microalgae amount and then, a stability and decrease, not shown in Figure. Inoculating it into wastewater it stops growing and stabilizes its development, meanwhile it keeps growing in the controls.
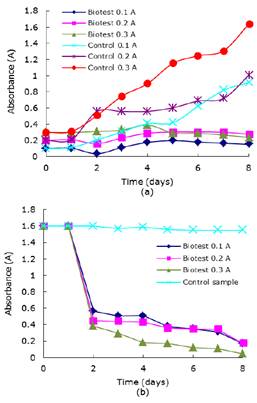
Figure 2 (a) Shows Chlorella sp., growth curve in wastewater with nutrients and their controls. (b) Chlorella sp., variation of absorbance in time with nutrients.
With regard to results related to microalgae decolorated wastewater with nutrients are shown in Figure 2b. Absorbance values decrease in wastewater reflects the remotion process made by the microalgae day by day. Performing the mathematical calculations it yields the decoloration percentage at the maximum growth day (Table 1). The biotest with initial absorbance of 0.3 showed the best percentage exceeding 80% in the maximum growth day.
Table 1 Chlorella sp., wastewater decoloration results with nutrients and its proper growth control.
| Biotest of Chlorella sp., with nutrients | Growth control | |||||
|---|---|---|---|---|---|---|
| Initial absorbance (A) | 0.10 | 0.20 | 0.30 | 0.10 | 0.20 | 0.30 |
| Maximum absorbance (A) | 0.20 | 0.30 | 0.39 | 0.92 | 1.00 | 1.64 |
| Maximum growth day | 5 | 6 | 4 | 8 | 8 | 8 |
| Decoloration percentage during maximum growth day (%) | 72.6 | 69.0 | 86.8 | |||
The results of the kinetic of growing of the microalgae and absorbance of wastewater without nutrients are shown in Figures 3a y b respectively and, in Table 2 decoloration percentages values are compiled. So absence of nutrients can affect growth and therefore the process efficiency and biotest initial absorbance of 0.1 yielded the higher percentage in decoloration.

Figure 3 (a) Chlorella sp., growth curve in wastewater without nutrients and its controls. (b) Variation of absorbance of Chlorella sp., in time in wastewater without nutrients.
Table 2 Results of Chlorella sp., decoloration in wastewater without nutrients and its proper growth control.
| Biotest of Chlorella sp., without nutrients | Growth control | |||||
|---|---|---|---|---|---|---|
| Initial absorbance (A) | 0.10 | 0.20 | 0.30 | 0.10 | 0.20 | 0.30 |
| Maximum absorbance (A) | 0.20 | 0.28 | 0.39 | 0.45 | 0.59 | 0.88 |
| Maximum growth day | 6 | 4 | 2 | 9 | 9 | 9 |
| Decoloration percentage in the maximum growth day (%) | 81.7 | 69.7 | 58.3 | |||
The Biotests making use of Chlorella sp., in kappa carrageenan show higher percentage of biodegradation than those reported in suspension, but it spent more days to match those rates reported in the last day test (Table 3).
Table 3 Results of immobilized Chlorella sp., decoloration of wastewater by kappa carrageenan.
| Properties | Value | ||
|---|---|---|---|
| Initial absorbance (A) | 0.40 | 1.60 | |
| Average decoloration percentage (%) | 72.60 | 78.40 | |
| Maximum growth day | 5 | 4 | |
| Last day (11) decoloration percentage (%) | 89.7 | 92.0 | |
The experiments performed show that making use of live microalgae in suspension with nutrients with initial absorbance of 0.3 yields a higher percentage of remotion in the maximum absorbance, consequently, it was chosen in order to evaluate the process efficiency. Table 4 shows the results from analysis of DBO5 and DQO for a liter of sample.
Table 4 Efficiency results of Chlorella sp., in decoloration of wastewater with nutrients.
| Characteristic | Valor |
|---|---|
| Initial absorbance (A) | 0.30 |
| Maximum absorbance (A) | 0.38 |
| Maximum growth day | 3 |
| Live microalgae decoloration rate (%) | 93.60 |
| Dead microalgae decoloration rate (%) | 94.34 |
| Percentage of DQO removed (%) | 84.80 |
| Percentage of DBO5 removed (%) | 78.00 |
DISCUSSION
In the curve of growth of Chlorella sp., there are four different phases from the parameters of evolution: the phase of adaptation to new ambient conditions, the phase of exponential or logarithmic, the stationary phase and at the end, the phase of dead. The phase of adaptation happened in a faster way because of the valuable contribution of macronutrients and oil elements supplied by fertilizer, and nitrogen was one of the most influencing elements in the microalgae biochemical structure and, after carbon, the great dry ingredient supplier to live cells. Also it is important to highlight air supplied to bioreactors that contains CO2 from atmosphere (almost 0.03%), which is useful as a source of carbon. So thanks to this proper ambience there is an accelerated increase of exponential factor because of an accelerated increase of chlorophyll. Subsequently the stationary phase is shown nutrients became exhaust because of an increase of the population in the last phase and, therefore the dead phase because the growth decreases due to lower values of absorbance.
Comparing the growth curves of Chlorella sp., with nutrients in time with their own controls it can be seen a notorious decrease mainly in the logarithmic phase. While biotests of 0.1, 0.2 and 0.3 of initial absorbance reached values of 0.2, 0.3 and 0.39 of maximum absorbance respectively, control readings taken the same days were 0.4, 0.6 y 1.2 following an increasingly tendency. This results show the importance of light effect in the cultivation. The presence of dissolved dyes in the water acts as xenobiotic compounds that may change microalgae metabolic process, greatly decreasing light penetration and consequently decreasing photosynthesis activities and the growth speed as well 3. Moreover, it’s been reported that inhibition can be caused because by the interaction between dyes and Chlorella sp., cell walls changing its enzymatic activities 28. Same behavior is shown in tests without nutrients.
The very notorious difference among biotests with or without nutrients is plenty shown at controls. Maximum values of absorbance of 0.45, 0.59 y 0.88 (Table 2) compared to 0.92, 1.00 and 1.64 (Table 1), read at initial absorbencies of 0.1, 0.2 y 0.3 respectively, show a decrease. The absence of the necessary nutrients and the appropriate chemical conditions inhibit the growth of the microalga, being the nitrogen one of those determining elements. If there are lower levels of this element in the cultivating process it will decrease both the amount of protein in the cells and photosynthetic pigments that help cell to grow.
The removal of colour in wastewater was notorious in the first days of all biotests. Percentages of decoloration of 72.6, 69.0 and 86.8% with initial absorbance of 0.1, 0.2 and 0.3 respectively with nutrients, calculated during the maximum growth day, show the effectiveness of these biological treatments. Without nutrients, the percentages were 81.7, 69.7 and 58.3% for initial absorbencies of 0.1, 0.2 and 0.3 respectively. Previous studies have shown that the main mechanism used by the microalgae Chlorella sp., for the removal of colour is by biosorption. The cells surface show functional groups of carboxylates, amines, sulphates, phosphates and imidazoles associated to polysaccharides, proteins and alginic acid that allows make bond with pollutants 20. Both this characteristic and its great surface and faster growth make the algaes great adsorbents. Also, it’s very important to point those “azo” compounds as chromophorous groups of the colorants can be used by the algaes as a unique source of carbon and nitrogen. In the reduction of these colorants by the algaes, double bond “N=N” is broken by azoreductase enzyme producing aromatic amines 29,30. Moreover, it was found that algaes can use aromatic amines and mineralize them completely. It is outlined till the last decline days there was a removing process used by the death biomass, because of photosynthesis inhibition. And finally, with a low percentage, roughly 0.34% belongs to colorant photodegradation as you could see the slightest change in absorbancy in the control samples from figures 2b and 3b. Although results show the best decoloration percentage obtained with initial absorbancy of 0.3 with nutrients (86.8%), we can suggest not to use it considering that the percentage of decoloration achieved without nutrients at an initial absorbancy of 0.1 was 81.7%.
Results in biotests with immobilized Chlorella sp., in kappa carrageenan showed a higher decoloration speed compared to those tested in suspension. From the second day of the experiments this behavior was evident, although the end it spent more days to percentage values of removal rates close to those obtained by the live microalgae in suspension such as in Table 3. Microalgaes are autotrophs microorganisms that inmovilised in kappa carrageenan depending on the position of bioreactor, some cells can remain exposed to gel surface, while others remain inside. This is the proper condition for photoinhibition and photolimitation respectively, decreasing anabolic activities. On the other side, it’s important to note the effect of immobilization over colorant transportation speed in the gel due to resistance for diffusion.
The test of efficiency of Chlorella sp., as a biotechnological way for decolorating wastewater poured out from paint factories yielded values, before treatment of 543 and 2221.5 mg/L O2 for DBO5 and DQO respectively. Samples were taken at the final point of drain in the industrial process, not including water from daily human usage inside the factory. The difference among those values of DBO5 and DQO is due to the great amount of biodegradable substances in the samples.
New data of DBO5 and DQO were 340 and 118 mg/L of O2 respectively, after treatment with microalgae. This shows a removal total percentage of the total organic load of 84.8% and 78% biodegraded material, calculated from initial to final values.
This research job allows us to come to the conclusion that treatment of coloured wastewater coming out from paint factories using microalgae Chlorella sp., depicts an efficient alternative method achieving a high percentage of removal.

