


 English (pdf)
 Article in xml format
 Article references
 Send this article by e-mail
 Cited by SciELO
  Cited by Google
  Similars in
SciELO
Similars in
SciELO  Similars in Google
 Permalink
1. Introduction
With the accelerated development of the global economy and the energy dependence on fossil fuels, concerns have been generated since they are not renewable energy sources [1]. Wind energy is being widely implemented worldwide due to its non-polluting characteristics [2].
Numerous investigations have been carried out in relation to the statistical analysis of wind characteristics. Xiangyun Qing [3], performed a statistical analysis of the characteristics of wind energy in Santiago Island, Cape Verde. The study presents an analysis of wind power and speed data in 2014, using a Weibull distribution of two parameters to model the wind speed and determine the wind potential in Santiago Island, Cape Verde. The average annual wind speed was 8.57 m/s with a standard deviation of 3.29 m/s. The average annual power density obtained was 560.94 W/m2 showing that Santiago Island has a good wind potential.
Chaurasiya P., Ahmed S., Warudkar V. [4], performed a comparative analysis of the weibull parameters using measurement techniques with meteorological towers (Met Mast) and remote measurement techniques SODAR (Sound Detection and Ranging) and LIDAR (Light Detection and Ranging), obtaining an acceptable level of equivalence between both measurement techniques. Previous studies show an excellent agreement and high correlation between the measurements of remote instruments (SODAR & LIDAR) and meteorological towers (Met Mast) [5] [6] [7] [8] [9] [10] [12] [13].
Hernández Q., Espinosa F., Saldaría R., Rivera C. [14], made an evaluation of the wind potential for the generation of electric power in the state of Veracruz, Mexico. This study was carried out in 16 anemometric stations at 50 m height, obtaining an annual average, in the wind speed in some regions, of 5.45 m/s and the study indicates that installing a wind turbine for each studied area, electric power is supplied to the network of 10694 MWh/year.
Wind speed is the most important parameter in the design and study of wind energy conversion systems [15] [16] [17] [18] [19] [20]. Akpinar E. K. and Akpinar S. [15], conducted a study of hourly wind speed data, in Keban-Elazig, Turkey, to derive the probability density function (PDF) and identify distribution parameters.
They applied two probabilistic models, Weibull and Rayleigh, to study the wind potential of the place. One conclusion of the study is that the Weibull distribution gave better estimates, in power density, than the Rayleigh distribution.
In practice, it is very important to describe the variation of the wind speed to optimize the designs of the systems and thus have lower costs in the generation of energy [15].
The main objective of this study is to perform a statistical analysis of the wind speed data in Floridablanca, Colombia, in order to predict the resulting energy in a wind system. To measure evaporative heat condensation is to quantify the volume of distillate and multiply by the evaporation latent heat [7].
2. Methodology
2.1 Weibull probability density function
The Weibull distribution is the most commonly applied model to represent the distribution of wind speed because of its simplicity and ability to assume characteristics of different distributions [3]. The probability density function [PDF] of the Weibull distribution is given by:

Where f (v) is the probability of observing a wind speed v, k is the Weibull shape parameter without dimensions and c represents the Weibull scale parameter in units of wind speed.
2.2 Accumulated distribution of Weibull
The Weibull cumulative distribution function [CDF] is defined by:

2.3 Calculation of Weibull parameters with the graphic method
The Weibull parameters can be calculated using the graphical method [21] [22] [23], applying the natural logarithm function on both sides of the Eq. 2 and obtaining.

Considering:

The linear equation is obtained:

If a linear regression analysis is performed, k is the slope and:

2.4 Average speed with the Weibull model
The average wind speed v m can be calculated using the Weibull parameters estimated according to:

Where Γ(x) is the gamma function of x.
The gamma function can be obtained by means of data approximation [24] [25], with a polynomial regression function, represented by:


3. Results and Discussion
3.1 Analysis of experimental wind speed
In this study, wind speed data were recorded in Floridablanca, Colombia, in 2016. Based on this data, the wind speed was processed using the SPSS software (Statistical Package for Social Science). SPSS is a computer statistical program widely used in social and applied sciences, in addition to market research companies. The original name corresponded to the acronym of Statistical Package for the Social Sciences (SPSS), reflecting the orientation to its original market (social sciences).
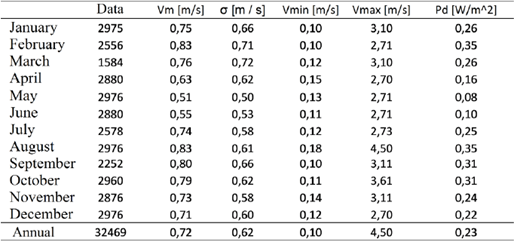
The power density [Pd] of the wind that flows at a speed [v], through the blades of a wind turbine that sweeps an area A, increases with the cube of the speed according to:

Where p is the air density with an approximate value of 1.225 kg/m3. In Table 1 it is observed that the highest wind speed occurs in the month of August with a value of 4.5 m/s and a power density of 0.35 w/m2 which is a very low wind potential. Throughout the year, the average monthly speed is low with values between 0.51 and 0.83 m/s for the month of May and August respectively.
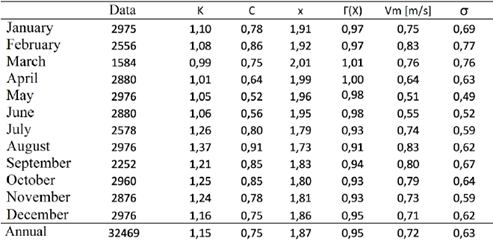
3.2 Analysis of wind speed with the Weibull distribution
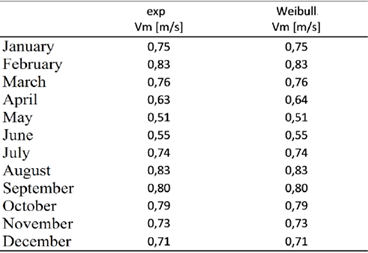
The average speed estimated by the Weibull model (see Table 2) is very close to the experimental data, only in the month of April it presents a variation of 0.01 m/s with a value of 0.63 m/s for the experimental data and of 0.64 m/s for the Weibull model (see Table 3).
Figures 1, 2 and 3 show the distributions of the wind speed in the months of January, February and July respectively of the year 2016 in the city of Floridablanca, Colombia. It is important to note that the Weibull model is a good approximation to the distribution of wind speed in different months because the trend in frequency values is followed.
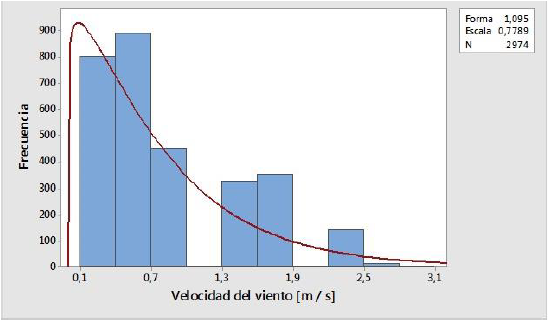
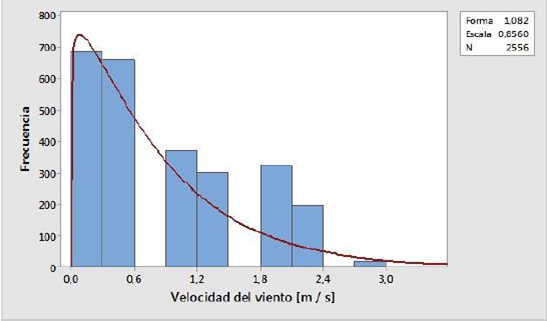
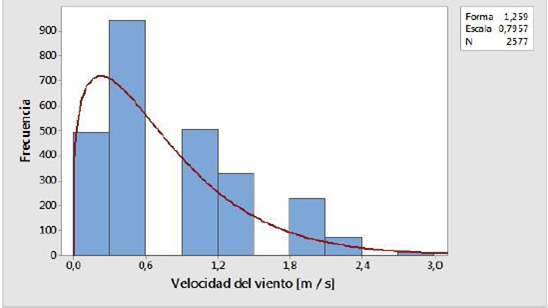
The monthly analysis also shows that most of the time (70% of the data in the month of January) the speed is less than 1 m/s.
4. Conclusions
In the present study, the wind speed data measured every fifteen minutes in Floridablanca, Colombia, were analyzed statistically. The data have allowed to determine the distribution of wind speed and power density on a monthly basis.
The meteorological station located in Floridablanca, Colombia, has very poor wind speed characteristics if it is intended to generate electricity. This is evidenced by the low values of power density for the all year.
The average value of the annual power density is 0.23 W/m2. Therefore, this site is not suitable, at any level, for electric power generation applications based on wind energy.
The Weibull distribution is a good approximation as a probability density distribution for the whole year with a correlation coefficient AD = 0.79.

