


 English (pdf)
 Article in xml format
 Article references
 Send this article by e-mail
 Cited by SciELO
  Cited by Google
  Similars in
SciELO
Similars in
SciELO  Similars in Google
 Permalink
INTRODUCTION
The pear tree in Colombia in recent years has had an increase in yield, 15.8 t ha-1 in 2018. It ranks second in terms of importance, after the peach (Agronet, 2019). This increase resulted from an increase in the consumption of fresh and processed fruits because of the recognition of nutritional and medicinal properties (Miranda et al., 2013).
Water consumption in agriculture represents about 87% of the global total, and demand is increasing. The depletion of water resources, the high costs of water and energy, the increase in demand, the decrease in international prices of fruit and the globalization of markets require improvements in the efficiency of crop production and irrigation (UNESCO, 2015).
Moderate water deficits during filling and maturation may be benefit internal changes in fruit quality, mainly by increasing the content of soluble solids and acids (Morandi et al., 2014; Galindo et al., 2017; Griñan et al., 2019). The pear is a climacteric fruit that produces greater amounts of ethylene and intense aroma during ripening that affect sensory quality and, consequently, consumer satisfaction, with a complex mixture of many volatile compounds that includes terpenes, alcohols, aldehydes, esters, acids, ketones and hydrocarbons, whose concentrations determine organoleptic attributes and consumer preference (Li et al., 2012).
This is the first study aimed at determining the effect on the production of volatiles in the harvest and post-harvest periods of the pear Triumph of Vienna cultivar (Pyrus communis L.) of regulated deficit irrigation (RDI) during the rapid growth stage of the fruit in 2014, taking into account the water status of the soil and the plants.
MATERIAL AND METHODS
This experiment was carried out in 2014 in Hacienda San Benito of Sesquile, Cundinamarca, Colombia. The plot had an area of 0.32 ha, with 172 pear trees of the Triumph of Vienna cultivar (Pyrus communis L.), planted in 1998 at 4 x 4 m. The soil has a loamy texture (IGAC, 2010). The average temperature was 12°C. The total precipitation in the period from November 2013 to April 2014 was 465.4 mm. The annual average evapotranspiration ETo, calculated with the Thornthwaite method, was 650 mm. The average daily ETc, determined with the Penman-Monteith equation (Allen et al., 1998; Cleves et al., 2016) with crop coefficient Kc= 0.8, was 2.16 mm d-1, and the relative humidity (RH) was 78.2%.
The drip irrigation system used six emitters per tree, 8 L h-1. The experiment design was randomized complete blocks, taking into account the slope of the land and the distribution of the trees in the plot, with three treatments and four repetitions per treatment (12 plots). The experiment plot was formed by 4 or 5 contiguous rows of three, four or five trees (with a total of 12, 15, 16 and 20 interior trees per plot).
The irrigation regime was determined by considering the crop evapotranspiration (ETc). During the cultivation cycle, all treatments were irrigated at 100% of the ETc, and, from January 1 to February 28, 2014, during the rapid growth phase, the following treatments were applied: control of 100%ETc irrigated all year and deficit treatments (74%ETc and 48%ETc) irrigated at 74 and 48% of the control, respectively. The volume of water applied to each treatment was regulated by varying the irrigation time, maintaining the same frequency, every 2 d. The water was measured with 13 mm volumetric meters, Zenner®, installed in each plot.
From a random sample of each repetition on May 9, 2014 to harvest, May 21 (12 days after harvesting DAH) and (24 DAH) June 2, two complete fruits were obtained to determine the volatiles using the SPME solid phase micro extraction methodology (Stashenko and Martínez, 2011; Li et al., 2012; Cano-Lamadrid et al., 2018) with a 1,160 mL storage vial.
The head space calculation for each of the tests was determined as the volume of the vial minus the volume of the fruit (Tab. 1). The standardization of the method was carried out by means of a time of exposure of the fiber to the volatiles for 30 min at an approximate ambient temperature between 22 and 26°C. The fiber was Supelco brand, three phases (divinil benzene, carboxen and polydimethylsiloxane) with an equilibrium time of 1 h. The internal standard used 2-octanol, 5.0 μL.
Table 1 Weight and volume of the fruit and head space in the vial for each treatment and repetition at harvest, '2 and 24 DAH in 2014.

The fiber was conditioned with thermal desorption for 5 min in a gas chromatograph (GC), Agilent Technologies 7890A injection port coupled to a 5975C mass spectrometer (MS) (Santa Clara, Ca), at a temperature of 250°C for 30 min. The operating conditions used an Agilent 19091S-433 high resolution gas chromatography column (30 m x 250 mm x 0.25 μm stationary phase film). Helium (He) gas was used as the carrier with a column flow of 1 mL min-1, with a running time of 51 min and at a 1:50 splitless mode ratio. The temperature of the injector and the interface was 250°C. For the acquisition of the mass spectrometer data, Chem Station software was used, and the mass spectra were compared with those stored in the NIST library to identify the compounds.
With the SAS/STAT program (SAS Institute, 2010), the statistical analysis was carried out using analysis of variance and Tukey test, P≤0.05, to compare the treatments and the control with the 'glm' procedure.
RESULTS AND DISCUSSION
The chromatogram standardization method of the volatile fraction (Fig. 1) corresponded to one of the repetitions of the 100%ETc treatment at harvest, where the more abundant peaks were identified in the retention times (tr), which were: (1) methyl acetate, tr = 2.2 min (5.20, 2.26 and 4.19%); (2) butyl acetate, tr = 5.7 min (12.29, 12.52 and 14.46%); (3) ethyl hexanoate, tr = 8.8 min (3.95, 4.49 and 7.13%) and (4) octanol, tr = 16.38 min (18.18, 24.43 and 18.22%). The determinations were made at harvest and 12 and 24 DAH for each treatment and repetition, whose mass spectra were compared with those stored in the NIST library.

Figure 1 Chromatogram of the qualitative analysis of the volatile compounds constituting the characteristic aroma of the pear variety Triumph of Vienna in 100%ETc treatment at harvest in 2014, with four of the peaks identified: (1) methyl acetate, tr = 2.2 min; (2) butyl acetate, tr = 5.7 min; (3) ethyl hexanoate, tr = 8.8 min and (4) octanol, tr = 16.38 min.
Twenty-three (23) volatile compounds were found, including 2-octanol, used as an internal standard, equal to the number of volatiles identified by Li et al. (2014) in the pear 'Pingxiangli' in different stages of maturation. The sensory descriptors correspond to SAFC (2011), which have also been reported in pear and other fruit trees by Altisent et al. (2011), Verzera et al. (2011) and Griñan et al. (2019).
The total concentration in the percentage of area of the volatile was 53.72, 56.69 and 60.92% at the time of harvest for 100%ETc, 74%ETc and 48%ETc, respectively, with no significant statistical differences although the deficient treatment 48%ETC was higher (Tab. 2).
Table 2 Percentage of area of the volatile compounds in the pear Triumph of Vienna cultivar in 2014.

Means with different letters in the same row indicate significant statistical differences within each day, between treatment, according to the Tukey test (P≤0.05; n=4).
The 12 DAH concentration increased to 87.26; 89.70 and 86.08%, respectively, with no difference between treatments. While, the 24 DAH concentration decreased, with a difference between treatments 100 and 74%ETc, with a total concentration of 85.62; 66.86 and 79.56% for 100%ETc, 74%ETc and 48%ETc, respectively (Tab. 2).
The dominant compounds in percentage of area for 12 DAH were ethyl acetate, propyl acetate, butyl acetate, hexyl acetate, octanol and α-farnese, similar to the compounds found by Zlatic et al. (2016) in the 'Bartlett' pear and by Bhavadharani et al. (2019) in the pear fruit (Pyrus communis).
According to the percentages of areas corresponding to the chromatograms and the weight of the fruits, the content of the volatile compounds, which contribute to the aroma of the pear cultivar Triumph of Vienna, was calculated, with a total concentration in 100%ETc, 74%ETc and 48%ETc, without differences for the harvest at 38.14; 23.65 and 43.38 mg kg-1 L-1; 12 DAH increased to 237.49, 219.96 and 296.60, mg kg-1 L-1; and 24 DAH decreased to 227.31, 151.67 and 153.41 mg kg-1 L-1 (Tab. 3). The production of volatile compounds increased during maturation and slowed down at 24 DAH, possibly because of a restricted supply of substrates for esterification, similar to that found by Bangerth et al. (2012) in apples. This behavior is typical of climacteric fruits, which produce a greater quantity of compounds that are characteristic of intense aromas during ripening, coinciding with a high production of ethylene and high respiration, which produce several physiological changes.
Table 3 Content of volatiles of the treatments at harvest, 12 DAH and 24 DAH of the pear cultivar Triumph of Vienna.

Means with different letters in the same row indicate significant statistical differences within each sampling point, between treatment, according to the Tukey test (P≤0.05; n=4).
The content of volatiles in mg kg-1 L-1 in general did not differ between the treatments, except: at harvest between 74%ETc and 48%ETc for methyl hexanoate; 12 DAH between 74%ETc and 48%ETc for ethanal; 100%ETc and 48%ETc for butyl acetate and 100%ETc with (74%ETc and 48%ETc) for 2-methylbutyl acetate (Tab. 3).
The total volatile content increased in the sampling point, with statistical differences in the 100%ETc treatment, from 38.14 to 237.49 mg kg-1 L-1 between the harvest and 12 DAH, respectively, and without differences between 12 and 24 DAH; the 74%ETc treatment had differences, with values of 219.96, 151.67 and 23.65 mg kg-1 L-1, 12, 24 DAH and harvest, respectively; in 48%ETc, 12 DHA showed differences from the other sampling points (Tab. 4).
Table 4 Content of volatiles corresponding sampling point in 100%ETc, 74%ETc and 48%ETc of the pear cultivar Triumph of Vienna.

Means with different letters in the same row indicate significant statistical differences in and between sampling points according to the Tukey test (P≤0.05; n=4).
The total content of the 48%ETc deficit treatment at harvest and during the initial storage process was greater, with significant differences (43.38 to 296.60 mg kg-1 L-1). Table 4 shows the differences in the volatile content.
100%ETc showed different statistics between harvest and 12 DAH for: propyl acetate; butyl acetate; 2-methylbutyl acetate; hexyl acetate; octanone; hexanol; ethyl octanoate and ethyl decanoate; between harvest and 24 DAH for: butyl acetate; 2-methyl-butyl acetate; methyl hexanoate; hexyl acetate; octanone; hexanol; ethyl hexanoate and α-farnese; and between 12 and 24 DAH for: propyl acetate and methyl hexanoate.
74%ETc had differences between harvest and 12 DAH for: methyl acetate; ethyl acetate; propyl acetate; ethyl butanoate; butyl acetate; 2-methylbutyl acetate; methyl hexanoate; hexyl acetate; hexanol; octanol; ethyl octanoate; ethyl decanoate and α farnese; between harvest and 24 DAH for: butyl acetate; methyl hexanoate; hexyl acetate; hexanol and α farnese; and between 12 and 24 DAH for: methyl acetate; ethyl acetate; propyl acetate; 2-methylbutyl acetate; octanol and ethyl decanoate.
48%ETc had differences between harvest and 12 DAH for: ethyl acetate; propyl acetate; ethyl butanoate; butyl acetate; 2-methylbutyl acetate; hexyl acetate; octanone; ethyl octanoate and α-farnese; between harvest and 24 DAH for: butyl acetate; pentyl acetate; octanone; octanol; ethyl hexanoate; and between 12 and 24 DAH for: propyl acetate; 2-meth-ylbutyl acetate; hexyl acetate; ethyl hexanoate and α-farnese.
Once the volatile compounds were identified and quantified, they were separated into 5 groups or chemical families: 1) aldehydes (pentanal and ethanal), 2) esters (methyl acetate; ethyl acetate: ethyl propanoate, propyl acetate, ethyl butanoate, butyl acetate, 2-methylbutyl acetate, 3-methylbutyl acetate, pentyl acetate, heptyl acetate, methyl hexanoate, ethyl hexanoate, hexyl acetate, hexyl butanoate, ethyl octanoate and ethyl decanoate), 3) acetones (octanone). 4) alcohols (hexanol and octanol) and 5) terpenes (α farnese).
In the treatments, it was found that the compounds with the highest proportion that contributed to aroma included esters, mainly methyl, ethyl and butyl; alcohols such as octanol; and terpenes such as α farnese and ethanal, similar to that found by Griñan et al. (2019) in quince (Cydonia oblonga Mill.) (Tab. 5). These compounds have also been identified in fresh fruits, juices and pear liqueurs by Zlatic et al. (2016) in Bartlett, Sevilla et al. (2011) in pear juice Conference, Zhou et al. (2015) in 'Nanguoli', Li et al. (2014) in 'Pingxiangli' and 'Ruanerli', Li et al. (2012) in 'Ruanerli', 'Kurle Xiangli', 'Bartlett', 'Youhongli', Daxiangshui', 'Xiaoxiangshui', 'Nanguoli', 'Pingxiangli', 'Dongguoli', 'Hongxiangsu' and 'Zaobaimi', Cano-Lamadrid et al. (2018a) in Pomegranates, Cano-Lamadrid et al. (2018b) in citrus and Andreu-Coll et al. (2020) in Prickly pear fruit.
Table 5 Content and percentages chemical groups of the volatiles (mg kg-1 L-1) for the treatments 100%ETc, 74%ETc and 48%ETc of the pear cultivar Triumph of Vienna.
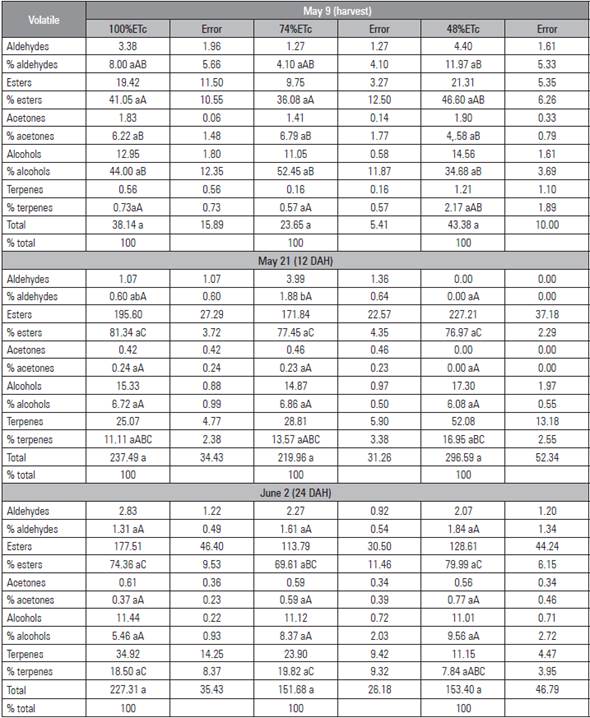
Means with different lowercase letters in the row of sampling point and different capital letters between the sampling point of the treatments indicate different statistics according to the Tukey test (P≤0.05) (n=4).
With the imposition of the deficit, the water potential at dawn (ψa) and the midday stem water potential (ψt), as expected, tended to decrease: the smallest regime (48%ETc) had ψa values of -0.29 MPa and ψt values of -0.80 and -0.99MPa in 2014 and 2015, respectively. 74%ETc had similar values of ψa (-0.26 MPa) and ψt (-0.78 and -0.96 MPa) in 2014 and 2015, respectively, while, in the control, the ψa was -0.30 MPa, and the ψt was -0.70 and -1.03 MPa in 2014 and 2015, respectively.
The different water regimes resulted in changes in the concentrations of the principle compounds and chemical families of volatiles, with no differences at harvest, 12 DAH or 24 DAH, except the percentage of aldehydes at 12 DAH (Tab. 5).
The low total concentrations of the main chemical families form the aroma of fresh and processed fruits (Sevilla et al., 2011), which, in the cultivar Triumph of Vienna, is characteristically sweet and fruity with an herbaceous smell resulting from the dominance of esters, which had the greatest contribution to aroma for the volatile compounds in all treatments, which increased steadily during the climacteric phase and increased in concentration with maturity, while the alcohols decreased as did the aldehydes although the latter did so significantly in 48%ETc (Wang et al., 2011; Altisent et al., 2011)
As the fruit began to mature, the content of esters increased drastically in all the treatments, which resulted in an increase in aroma, similar to that found in pears by Li et al. (2013). The percentages of esters reached their maximum in deficit treatment 48%ETc during maturation, coinciding with the increase in the production of ethylene. At harvest, the predominant compounds were esters, alcohols and aldehydes, which decreased after 12 DAH, with an increase in the percentage of terpenes (Li et al., 2014; Sevilla et al., 2011). At 24 DAH, the predominants were esters, terpenes and alcohols (Tab. 5). α-farnese was detected in P. communis by Yanine et al. (2013), similar to that found at 24 DAH for terpenes. The esters were the dominant volatile in deficit treatment 48%ETc: at harvest (46.0%); 12 DAH (76.97%) and 24 DAH (79.99%), while, at harvest, 100%ETc and 74%ETc presented a higher percentage of alcohols (Tab. 5).
CONCLUSION
The production of volatile compounds in all treatments increased during maturation and slowed down at 24 DAH, possibly resulting from a restricted supply of substrates for esterification. This behavior is typical of climacteric fruits, which produce a greater quantity of compounds with characteristic intense aromas during ripening, coinciding with a high production of ethylene and high respiration, which produce several physiological changes because of a higher concentration of sugars but a lack of precursors at the end of the maturation process.
In the pear cultivar Triumph of Vienna, the volatile compounds with the highest proportion that contributed to aroma were esters, mainly methyl, ethyl and butyl; alcohols such as octanol; terpenes such as α-farnese and ethanal.
The different water regimes resulted in changes in the concentrations of the principle volatile compounds without differences between harvest, 12 DAH and 24 DAH. There were also no differences in the percentages of volatile content between the chemical groups at harvest, 12 DAH and 24 DAH, except at 12 DAH between treatments 74%ETC and 48%ETC for the percentage of aldehydes.
Under limited water conditions, watering with regulated deficit doses can provide production that is similar to that of a well-watered crop, provided that it is carried out in the phenological state of low sensitivity and the tolerance limits of stress are not exceeded.


