


 English (pdf)
 Article in xml format
 Article references
 Send this article by e-mail
 Cited by SciELO
  Cited by Google
  Similars in
SciELO
Similars in
SciELO  Similars in Google
 Permalink
INTRODUCTION
Affective computing, a cutting-edge and rapidly expanding discipline in computer science, focuses on creating systems that can recognize, process, and mimic human emotions to enhance human-computer interaction [1]. In this sense, one of the most widely used approaches for emotion detection is monitoring physiological variables such as facial expression, heart rate, galvanic skin response, and tone of voice, among others [2], [3], [4].
Emotions play a fundamental role in human communication. Research by [5] indicates that 38 % of daily human communications are based on the expression of emotions. Therefore, emotion recognition using tone of voice has become a topic of great interest in various application areas of daily life, such as commercial, industrial, and research environments. Speech Emotion Recognition (SER) focuses on identifying real feelings from audio data [6] because the pitch, energy, speed, and semantic information with which a word is expressed can change its meaning [7]. For example, a written comment or facial expression about a product or service may not align with the audio message. However, the emotions of the speaker uttering it can still be analyzed. Furthermore, emotion recognition through facial expressions can be impacted by factors such as lighting, frame quality, and streaming issues; therefore, a SER brings more benefits for real-time applications [8] and is non-invasive.
The steps involved in SER [9] are: 1) acquiring the signal from real sources or a corpus; 2) extracting features; 3) selecting features with enhancements for training the classifier; and 4) classifying emotions by training and evaluating performance. Commonly used models include K-Nearest Neighbor (KNN), Hidden Markov Models (HMM), Support Vector Machines (SVM), Artificial Neural Networks (ANN), and Gaussian Mixed Model (GMM). There are also numerous resources and packages in Python[10], [11] and libraries, such as TensorFlow [12], [13] available for audio signal processing in SER, simplifying the execution of this important task within the realm of natural language processing. In addition to these, Russell's model [14] uses the levels of acoustic properties of arousal (active/passive) and valence (positive/negative) in a four-quadrant space to identify emotional states.
Several studies show the usefulness of emotion recognition from different audio sources [15], one area of application where SER are useful, some works are: Parra-Gallego and Orozco-Arroyave [16] present a comprehensive evaluation of SER systems, exploring various feature extraction techniques that model articulation, phonation, and prosody. The authors found that the SER approach they had proposed was comparable to other state-of-the-art approaches and corpora in terms of accuracy and performance. The evaluation is performed on three corpora, two traditional corpora and a new one that includes direct central station recordings, i.e., real conversations not acted and in acoustic conditions without any control. In emergency call centers, an SER system can assist in identifying emotions, such as fear, in distress calls, enabling differentiation between real and false calls, prioritizing the most urgent calls, and delivering appropriate responses to each situation [17].
Milana, Vlado, and Alexey [18] introduced an improved algorithm for implementing a SER that extracts emotions from the first moments of emergency recordings to prioritize calls based on their emotional intensity. The algorithm was trained using three emotion distributions drawn from real call centers and a corpus. The authors used a Bayesian classifier (best results) and a multilayer perceptron to classify emotions and found that the SER significantly reduced call wait times. Deschamps-Berger [19] proposed a bimodal (audio and text) supervised classification system for emotion recognition on two emergency call center corpora, focusing on chest pain and Covid-19 related calls. The system utilized a neural network architecture and a zero-shot learning strategy to optimize the fusion model (text and emotions). This research aims to contribute to a better understanding of the complex emotions encountered in emergency call center interactions.
Bancroft et al. [20] acknowledge that the emotionality of the voice impacts speaker verification. To addressed this, they proposed a framework for studying speaker identification and verification that considers the emotional aspect of the voice. For speaker identification, they used a probabilistic linear discriminant analysis (PLDA). Meanwhile, for speaker verification, was utilized a deep neural network (DNN) that evaluated the retrieval of sentiment data from individual speakers. In a separate study, Chanchí and Cordoba [21] analyzed the sentiments and emotions expressed in the speech given by the President of Colombia during the peace agreement signing ceremony. They used the acoustic properties of valence and arousal, as outlined in Russell's circumflex model [14], to classify the emotions present throughout the speech. The authors utilized the OpenEAR library [22] on a Linux distribution for audio signal processing. Chanchí et al. [23] analyze the distribution of emotions using unsupervised learning techniques in preventive video content created during the Covid-19 pandemic. For this purpose, the authors obtain the arousal and valence properties of the different segments belonging to the audio of the video contents. Segundo and Ongil [24] employed affective computing to understand the reactions of victims of gender-based violence in high-risk situations, resulting in the successful development of automatic detection mechanisms.
Another area of application where SER has gained strength is in forensic analysis, where tone of voice is used to identify the interviewee's emotionality and discover underlying information that is not available in most cases. Cicres [25] studied full pauses or hesitant sounds in interviewees to assist the interviewer in forensic voice matching. Again, the task's complexity and sensitivity to voice quality variables such as health status, emotion, or alcohol level are emphasized. Karni-Visel and Hershkowitz [26] presented a study on the relationship between emotional valence and the type of information obtained, specifically the relationship between children's spoken emotional expressions and the type of information obtained during interviews about abuse reports. They found that negative verbal emotions were associated with specific details that improved the quality of forensic reports of child abuse, confirming previous research on emotional valence and its influence on memory detail.
The current state of the art shows that SER, a non-invasive technique that analyzes acoustic variables, enables the objective identification of emotions expressed in opinions or spoken utterances in various contexts. In the same sense, it has been shown that SER has spread mainly in the field of perception identification in end users, offering opportunities for further expansion into fields with significant potential, such as forensic analysis. With the above in mind, this article proposes the design and implementation of a software system called FOREMAN (Forensic Emotion Analyzer), intended for forensic studies based on the sentiment analysis of voice recordings. FOREMAN can detect emotions in an audio file and accurately calculate the percentage distribution of emotions through a combination of statistical analysis and cutting-edge machine learning models. The system has potential applications in the analysis of interviews or interrogations, providing forensic experts with valuable insights into fluctuations in emotions that may compromise the interviewee's responses.
At the operational level, the forensic expert begins by loading the audio file, dividing it into segments to extract the arousal and valence variables, and then associates an emotion with each segment. According to [27], at the end of the processing, the system graphically displays and calculates the percentage of occurrence or distribution of emotions in the audio recording. This proposed system represents a significant advancement in the field, leveraging acoustic variables of arousal and valence to bridge the gap between affective computing and forensic analysis. Furthermore, by utilizing methods of affective computing to identify emotions from audio segments, the system enhances the capabilities of forensic phonetics studies. Although the use of physiological variables in measurements is not currently accepted as valid evidence in countries such as Colombia and Peru, the implementation of this system can positively impact the advancement of forensic procedures, providing key insights to support traditional methods in investigations.
The rest of the article is structured as follows: Section 2 outlines the methodology used in this research. Section 3 presents the results, including the design and implementation of the FOREMAN system for speech emotion analysis and a case study demonstrating its performance and usefulness. Finally, the discussion and conclusion of this research can be found in Sections 4 and 5, respectively, along with suggestions for future work.
METHODOLOGY
The development of this research was framed within the 4 phases proposed by Pratt's iterative pattern of research [28]: observing the application, identifying the problem, developing the solution, and test the solution, as shown in figure 1.
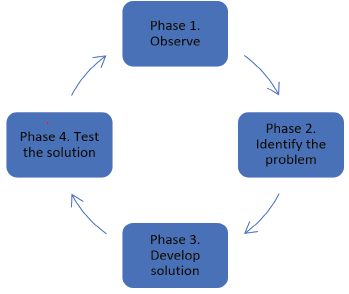
In Phase 1, characterization and verification of the acoustic variables used to analyze emotions from the voice and select a model for classifying emotions based on these variables was performed.
This study chose an adaptation of Russell's model, which recognizes a total of 5 emotions: happy, excited/enthusiastic, angry, sad, and relaxed. This set of emotions is calculated by using the acoustic properties of arousal and valence, where arousal represents the perceived level of loudness and activity in a music track, and valence represents the musical positivity conveyed by the audio [27], [29]. High arousal values are associated with loud, high-volume, and noisy tracks. In contrast, high valence values correspond to positive emotions such as happiness and euphoria, and low valence values correspond to negative emotions like sadness, depression, and anger [30]. To calculate the emotion within the Russell's model, we determine the trigonometric angle of the emotion in two-dimensional space using equation (1), which combines the values of arousal and valence variables [27].

Equation (1) uses the trigonometric angle a to determine the emotion's radial location in the two-dimensional Russell's space, calculated as the inverse tangent of the ratio between the arousal and valence values. To identify the emotion, we refer to the ranges in table 1, which are based on the adaptation of Russell's model presented in [27] and have a separation of 72° between each emotion.
TABLE 1 RANGES OF EMOTIONS
| Angles in Russell's model | Emotion |
|---|---|
| 342 ≤ a < 54 | Happy |
| 54 ≤ a < 126 | Excited |
| 126 ≤ a < 198 | Angry |
| 198 ≤ a < 270 | Sad |
| 270 ≤ a < 342 | Relaxed |
Source: [27].
In phase 2, It was defined the functional blocks that make up the proposed software system and the specification of the different processes that the system will perform for the processing and emotion analysis of an audio track in the forensic context. Within phase 3, It was selected the tools and technologies that enable the implementation of the automated emotion detection process within the audio track. It was chosen the FFmpeg tool to perform the segmentation processes of the audio track in fragments of 1 second, the openEAR tool to obtain the acoustic properties (arousal and valence) of each audio fragment, the Weka data mining library for the analysis of the emotions present along the audio track using clustering or unsupervised learning methods, and the JFreeChart library for the generation of graphs representing both the variation of emotions along the audio track and the percentage of occurrence of each emotion within the audio file. Using the tools above, the software system for forensic analysis was built based on the emotion study of the voice using the Java programming language. Finally, in Phase 4, It was evaluated the system by conducting a case study in which was analyzed the distribution of emotions along the track of a provided forensic test interview.
RESULTS AND DISCUSSION
This section presents the results of the research development. The functional modules that make up the system and the processes developed within each module are outlined. Additionally, it is presented the different interfaces that have implemented as part of the system.
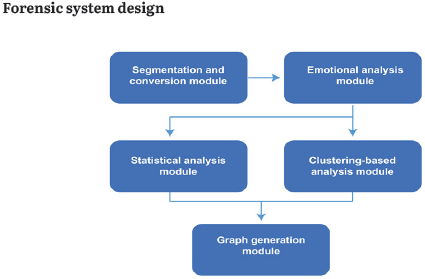
Figure 2 displays the block diagram of the FOREMAN System, which incorporates five functional modules: Audio Segmentation and Conversion, Emotion Analysis, Statistical Analysis, Cluster-Based Analysis, and Graph Generation.
The Audio Segmentation and Conversion Module of the system converts the input file received from the forensic expert into WAV format in case it is in MP3 format. The audio is further segmented into one-second fragments to carry out the emotion analysis on each audio fragment.
The Emotion Analysis Module obtains the acoustic properties (arousal, valence) of each audio fragment and uses Equation (1) to determine the associated emotion, based on the use of an adaptation of the circumflex model or Russell's model. The Statistical Analysis Module calculates the number of occurrences of each emotion in the analyzed fragment, in order to determine the percentage of occurrence or distribution of the 5 emotions throughout the audio track. The Cluster-based Analysis Module employs the K-Means algorithm on each audio fragment's arousal and valence values to identify emotions' distribution and spatial concentration in the two-dimensional Russell's model. Lastly, the Graph Generation Module creates visual representations of the results from both the Statistical Analysis and the Clustering Analysis.
The design of the proposed FOREMAN system, as depicted in figure 3, involves several processes based on the emotion analysis of the voice. The flowchart in the figure illustrates the step-by-step process followed by the system. To begin, the forensic expert loads an audio file of an interview. The system then segments the file into one-second fragments using FFmpeg free software library. Next, the OpenEAR library is utilized to determine each fragment's acoustic properties of arousal and valence. These properties are then used to determine the corresponding emotion and angle within the two-dimensional model adapted from Russell's, using the functionalities provided by the Java Math library and equation (1). The system stores the time stamp, arousal value, valence value, and emotion of each audio fragment in a dynamic Java array as the emotions are determined. The analysis continues until all the audio fragments have been processed.

The system calculates the percentage of occurrence of the 5 emotions considered within the audio track from the data stored in the array. This information is visualized as a bar chart using the Java JFreeChart library. Additionally, the system generates a graph showing the variation of the emotions along the audio track using the same library. Finally, using the Weka library, the K-means algorithm is applied on the arousal and valence values of each segment, in order to determine the clusters and their associated centroids. The results of this clustering process are presented as a scatter plot, with each cluster distinguished, and a bar chart indicating the percentage of instances in each cluster.
Implementation of the FOREMAN system
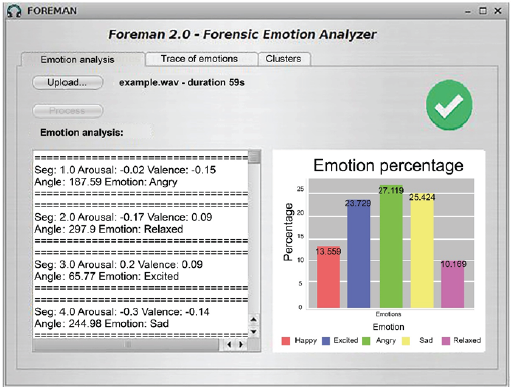
The FOREMAN system features a graphical interface developed in Java. It is composed of three tabs: "Emotion Analysis", "Trace of Emotion", and "Clusters" (as shown in figure 4). The "Emotion Analysis" tab allows users to load an audio file, process it, and analyze the emotions present. The system determines the acoustic properties of arousal and valence, the angle, and the corresponding emotion within the Russell model, in order to obtain the percentage distribution of emotions over the total 1-second audio segments. The analysis results are displayed on a screen split into two sections. The left section displays the textual values obtained from each processed segment, while the right section presents a graph illustrating the percentage distribution of the five emotions considered in the model.
Figure 4 serves as an example of the emotion analysis performed by the system on a 59-second audio file. The first segment has an arousal value of -0.02 and a valence value of -0.15, resulting in an angle of 187.59° after applying equation (1). This angle corresponds to the emotion "angry" in the adapted Russell's model presented in table 1. The generated percentage distribution graph shows that the emotions with the highest percentage are "angry" at 27.119%, "sad" at 25.424%, and "excited" at 23.729% of the segments.

The "Trace of emotion" tab of the FOREMAN system is represented in figure 5, displaying the variation of different emotions along the audio track. This graph is valuable to forensic experts as it provides a visual representation of the correlation between what is expressed in the audio and the corresponding emotion at a given time. The 59-second audio file analyzed in the "Emotion Analysis" tab serves as an example to illustrate the significant fluctuation between the emotions "excited", "angry", and "sad" shown in figure 5. figure 6 showcases the graphical interface of the "Clusters" tab, where the system conducts a clustering analysis on the acoustic properties (arousal, valence) of the audio fragments.
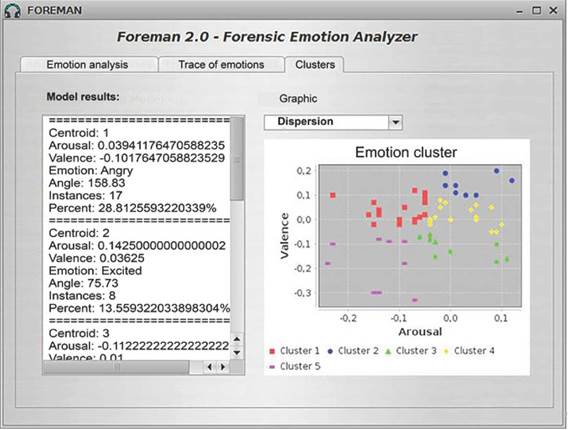
The forensic expert can see in the "Clusters" tab that the FOREMAN system determines five clusters and their corresponding centroids, along with the total number of instances belonging to each cluster and the acoustic properties corresponding to each centroid. This feature allows the expert to determine the angle and emotion associated with each centroid. The system also generates a scatter plot using the K-Means algorithm from the Weka library to visualize the clusters. For the 59-se-cond audio file used earlier, the system found that cluster 1 had the highest percentage of segments or instances at 28.81%, with a centroid C1 = {arousal = 0.039, valence = -0.102}. These properties correspond to the emotion "angry." In other words, 28.81% of the segments are centered around the emotion "angry", which can be seen in the red dots on the scatter plot.
For the previously analyzed 59-second audio file, the "Cluster" tab also offers a "Pie" option which generates a pie chart depicting the distribution of the audio segments among the five clusters calculated by the system. As shown in figure 7, the two clusters with the highest percentage of audio segments were Cluster 1, with 28.813%, and Cluster 4, with 27.118%. These clusters are linked to the emotions "angry" and "happy", respectively.

Case study
In this research was conducted a case study to assess the effectiveness of the forensic emotion analysis system (FOREMAN) by examining the emotion distribution present in an audio file taken from a Colombian military hearing before the JEP (from Jurisdicción Especial para la Paz: Special Jurisdiction for Peace). The audio file, which consists of confessions made before JEP judges about extrajudicial executions of innocent civilians being presented as combat casualties, lasts 273 seconds. The results of the analysis, which we conducted using the FOREMAN system, are shown in Figure 8 as a percentage distribution.
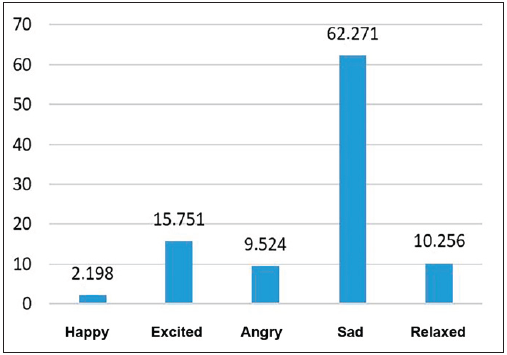
Figure 8 shows that the emotion with the greatest percentage of occurrences in the segments of the analyzed audio track is "sad" with 62.271%, followed by the emotion "excited" with 15.751%. The emotion with the lowest presence in the audio track segments is "happy" with 2.198%. This can be clearly seen in Figure 9, which shows the variation of emotions along the audio track of the court hearing.
Figure 9 graphically displays the way emotions vary in the audio track of the court hearing. The audio track mostly oscillates between the emotions "sad" and "excited," with brief rises towards "happy" and "relaxed" peaks.

The FOREMAN system also performs a clustering analysis, which is shown in figure 10. This figure displays the spatial distribution of the audio segments in a visual format. The blue-colored Cluster 2 has the highest concentration of instances, with 36.263% of the audio file's segments.
The centroid for Cluster 2 is C2 = {arousal = -0.106, valence = -0.0078}, and based on the centroid's acoustic properties, the corresponding emotion is identified as "sad." For a more in-depth analysis, the description of all obtained clusters and centroids can be found in table 2.

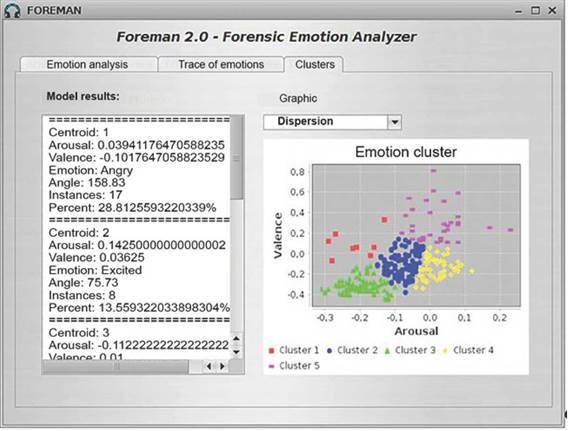
Table 2 reveals that clusters 2 and 3, classified by their centroids as the emotion "sad," concentrate a combined total of 65.2% of the instances. These results align with the percentage distribution depicted in figure 8. Qualitatively, it is noteworthy that these findings are consistent with the nature of the court hearing, where the speaker expresses remorse for the military actions committed by the army in the presence of a JEP judge and the victims.
DISCUSSION
Speech Emotion Recognition (SER) techniques are widely used in the field of end-user perception identification, and some approaches have proven effective in the forensic field. This article presents the design and development of FOREMAN, a forensic emotion analysis software system that uses sentiment analysis of the voice to determine the fluctuation of emotions in audio tracks from interviews or forensic hearings. Using clustering methods, FOREMAN also calculates the audio track's percentage and spatial distribution of emotions. The software is designed to support forensic experts by enhancing conventional methods of forensic interview analysis and helping to identify crucial evidence in these investigations.
CONCLUSIONS
In conclusion, the tools and technologies used in the development of the Forensic Emotion Analyzer FOREMAN system have been found to be effective in meeting the functional requirements. The use of the FFmpeg library allows to support the processes of encoding and fragmentation of the audio file provided by the forensic expert. Meanwhile, the OpenEAR tool determines the acoustic properties of arousal and valence to classify emotions according to the two-dimensional Russell's model. The Weka library applies clustering techniques to the data, and the JFreeChart library generates informative graphs presenting the statistical and clustering results. Therefore, these tools and technologies can be considered appropriate for developing speech-emotion analysis systems in forensic or similar contexts.
The case study demonstrates the usefulness of the proposed forensic system in determining the percentage and spatial distribution of emotions in an audio recording. The analysis of an audio file taken from a Colombian military hearing before the JEP reveals that 62.271% of the audio fragments are classified as "sad," which is consistent with the overall tone of the hearing where the military asked for forgiveness from the judge and the victims.
Future work will link the proposed system with various physiological variables and their respective sensors to enhance its functionality and perform real-time emotion analysis. Given the multimodal nature of emotions, various signals such as facial expressions, galvanic skin response, and heart rate can be used to complement and validate the interviewee's emotions. Additionally, the system will be tested as evidence to assess a suspect's guilt, comparing the results to existing methods and evaluating its ability to support decision-making and detect warning situations.

