


 English (pdf)
 Article in xml format
 Article references
 Send this article by e-mail
 Cited by SciELO
  Cited by Google
  Similars in
SciELO
Similars in
SciELO  Similars in Google
 Permalink
1. INTRODUCTION
Phenol and its derivatives are considered toxic compounds, representing a potential health hazard [1]. Industrial effluent streams from oil refining [2], resins and plastics processing [3], and the Kraft process contain phenol [4], and when discharged, this can result in environmental pollution. Thus, the analytical determination of phenolic compounds in natural water and wastewater is ordinarily measured spectrometrically using the 4-amino- antipyrine (4-AAP) method [5]. However, rural communities in emerging countries lack access to these instrumental methods; therefore, it is necessary to meet the increasing demand for rapid and affordable analytical methods that are able to measure total phenols, avoiding chemical waste generation [6]. As a result of the need for rapid, inexpensive and user-friendly analytical tools, the use of biosensors involving biological species for easy recognition of toxic analytes has been explored. In addition to the recognition element, a biosensor also contains a transducer element, transforming the biological response into an output signal, which is registered [7]. Horseradish peroxidase (HRP) is an enzyme widely used as a recognition element for phenol that, under specific environmental conditions, is activated in the presence of hydrogen peroxide and is able to catalyze the one-electron oxidation of phenolic compounds to form phenoxyl radicals [8]. The products of this reaction are transformed to high molecular weight polymers, facilitating their removal by filtration or sedimentation [9]. The advantage of HRP activity has been exploited in the development of a range of phenol biosensors by using this enzyme as an active sensor element linked to an electrochemical transducer [10]. In general, HRP is immobilized in layers by electrostatic interactions, covalently bonding, or trapped by polymeric matrices on gold, platinum, or graphite electrodes [11]; the modified electrode is used to recognize and detect phenol due to the change in the electrochemical potential of the system associated with HRP-phenol interaction [12,13]. Advances in analytical performance of these phenol detecting tools were achieved when nanostructures were incorporated into the construction of biosensors [14,15]; by replacing the enzymatic recognition element for bi-enzyme system tyrosinase - HRP immobilized on silica, a linear response was reached in the range 2x10⁻⁷-2.3x10⁻⁴ M [16].
Another approach used to detect changes during the HRP-biorecognition event involves an optical transducer; incorporating chromophore species immobilized on a silica monolith leads to a colorimetric HRP biosensor capable of measuring phenol in a linear range 0.2- 2 mM [17]. An alternative to the electrochemical and colorimetric elements mentioned above that is also used as transductor in biosensors, is provided by a material capable of sustaining colorimetric transformations detectable by the naked eye. Water-soluble diacetylene monomers (DA) form conjugated polymer polydiacetylene (PDA), used for biosensor applications due to their highly delocalized backbone structures, which display unique electronic and optical properties, and self-assembles in vesicular structures [18]. PDA possesses colorimetric transitions, exhibiting a color change from the blue to red PDA phase upon external stimuli, including temperature, pH, and chemical and biological interactions [19]. A biological recognition event stresses the PDA pendant chains, transferring the perturbation to C-C bonds of the PDA backbone in the planar blue PDA phase (PDAb); in turn, it causes a partial alteration of conjugated n orbitals, resulting in the red PDA phase (PDAr) [20]. This change in optical property is detected by UV-vis spectrometry and quantified by the parameter colorimetric response (CR%). Another feature of diacetylene monomers (DA) - pure or mixed with other amphoteric species - is their ability to self-assemble due to the hydrophobic effect in the lipid bilayer, followed by liposome formation when enough energy is provided [21]. Furthermore, during the synthesis of the liposomes, functionality can be tuned by chemical modification, for example with hydroxysuccinimidyl ester (NHS), a group able to react with amine groups forming an amide bond [22]; in particular, this linker is exploited for anchoring enzymes on DA nanostructures capable of being polymerized. This research developed a biosensor for the detection of phenol; formed by HRP immobilized on PDA liposomes, which act as the recognition element and transducer respectively. The resulting sensor is a practical, reliable and simple option for monitoring the concentration of phenol in the 0.25-2 mM range, allowing the elimination of hazardous reagents, reducing the amount of enzyme used, and facilitating user-friendly use.
2. EXPERIMENTAL DEVELOPMENT
MATERIALS AND INSTRUMENTS
10,12-Pentacosadiynoic acid (PCDA) was purchased from GFS, dimiristoyl- sn-glicero-3-fosphocholine (DMPC) was acquired from Avanti Polar Lipids; sodium phosphate dibase, (Na2HPO4), sodium phosphate mono base (NaH2PO4), dichloromethane (CH2Cl2), sodium chloride (NaCl), Horseradish Peroxidase enzyme (EC 1.11.1.7) type VI-A 1310 units/mg solid were purchased from Sigma-Aldrich Chemical. Hydrochloric acid, sodium hydroxide, sodium sulfide, and Whatman 2 paper filter were purchased from Fisher Scientific. Hydrogen peroxide (H2O2) was acquired from Carlo Erba Chemicals. Cellulose ester dialysis membrane tubing (50 KDa cutoff) was purchased from Spectrum Laboratories; and polycarbonate membrane 4.5 cm, 0.45 |jm and a fiberglass filter were bought from Sartorius Biolab Products. Nanopure water was obtained through Simplicity Millipore treatment, (Conductivity 6 |jS/cm), This is in addition to an IKA RV 10 rotaevaporator, a Cole-Palmer sonicator bath, Cole-Palmer UV lamp UVGL-25, 8 watts, Schott CG 842 pH meter, Boeco Germany BBX 22 analytical balance, and IKA C-MAG HS 7 heater and stirrer. The electronic absorption and emission spectra of PDA liposome and the product of reaction were measured by using a Genesys 10 UV-Vis spectrometer and Horiba 3 fluorometer.
PREPARATION AND CHARACTERIZATION OF PCDA/PCDA-NHS/DMPC LIPOSOMES (PCDA LIPOSOMES)
Liposome was synthesized at a concentration of 1 mM. Recently filtered PCDA (0.0131 g) and lipid DMPC (0.0067 g) were dissolved in 25 mL of CH2Cl2 following the thin layer formation method (23). The solvent was removed from the flask by rotoevaporation, 25 mL of phosphate buffer 10 mM (PBS, pH 7.4) were added, and the suspension was sonicated for 15 minutes in the bath sonicator, followed by 15 minutes of ultra-sonication at 75 °C. The suspension was filtered with a polycarbonate membrane to remove aggregates, and then stored in a refrigerator for 8 hours to promote liposome formation.
HRP IMMOBILIZED ON PCDA/PCDA-NHS/DMPC LIPOSOMES (PDA-HRP LIPOSOMES)
The surface of PCDA Liposomes was modified by an amidization reaction; 200 μL de EDC (0.1 M) were added to 1 mL of unpolymerized PCDA Liposome soLution, followed by adding 200 μL de NHS (0.075M); after 30 minutes of reaction, 30 μL of HRP soLution (0.35 μM) were added and mixed for 15 minutes [24]. To polymerize the self-assembled Liposome, the solution was irradiated with a UV Lamp at 254 nm for five minutes. After polymerization to eliminate free enzyme, PDA-HRP Liposomes were dialyzed with a dialysis membrane for 18 hours in PBS 10 mM, pH 7.4. Fresh solutions of PBS were added every two or four hours. In dialysis, free enzyme leaves the dialysis bag, diluting the PBS on the other side of the membrane. UV-vis spectra were acquired with slit width of 2 nm, in the scanning range 400 to 700 nm.
ASSAY FOR PHENOL DETECTION WITH HRP AND H202, AS AN OXIDIZING AGENT
75 μL of phenol solution and 75 μL of H202 at equal concentration were added to 1250 μL of HRP solution 0.25 μM; thus, the stoichiometric demand involved in the chemical reaction was reached, Eq. (1) [25],

Phenol recognition was evaluated in the range 0,25,0,5,1,0,1,5, and 2,0 mM. The reaction system was protected from light by wrapping it in aluminum foil, under continual stirring and at room temperature for 2 hours. Phenol degradation was evaluated spectrometrically using a Genesys 10 UV-vis in the scanning range 230-330 nm through measurement of the formation of product o-o'biphenol, [26], Product formation was confirmed by fluorescence emission in the Horiba 3 fluorometer fluorolog, slit width 2 nm and 2 nm for emission and excitation; the excitation wavelength was 286 nm and the emission scanning range was 300-500 nm [27]
PHENOL DETERMINATION BY PDA-HRP LIPOSOMES IN PRESENCE OF H 2 0 2
The evaluation of the activity of the immobilized enzyme bound to PDA-HRP liposomes was established according to the phenol detection test; in the presence of H202, following the procedure as described for the free enzyme, replacing the free enzyme solution for 1250 mL of liposome PDA-HRP solution. The application range was 0.1-2.0 mM and experiments were performed in triplicate. A control experiment was also implemented to establish whether there is interaction between phenol, H202, and liposomes without enzyme (+ H202 + Phenol - HRP). This control used 1.5 mM phenol, and the other experimental conditions were kept as described above.
NANOBIOSENSOR FOR PHENOL DETECTION IN A MODEL INDUSTRIAL STREAM
The cooking liquor was obtained in a Kraft process simulated at Laboratory level. 60 g of eucalyptus (Eucalyptus globulus) wood were cut into pieces of 2 cm2 and 4 cm in length [28]. The wood chips were treated with a mixture of NaOH, Na2S at a mass ratio of 3:1, dissolved in 800 mL of water in a reactor at 760 mbar (26 psi) to 2800 msl [29], keeping both a soaking and process temperature of 125 ° C for 90 minutes [30], The resultant cooking Liquor was stabilized for 12 hours at room temperature, and the organic matter was decanted at the end of this period, followed by filtration using 0.45 μm polycarbonate membrane. The pH was adjusted to 8.0 with 0.1N of HCL and filtered again with 0.45 μm fiberglass paper. The phenol content in the synthetic Kraft effluent was diluted twice and its concentration was determined by the application of a nanobiosensorsolution underthe conditions described above for phenol evaluation. All measurements were performed in triplicate. Based on the calibration curve obtained for nanobiosensor, the phenol concentration in the sample was established from extrapolation for industrial synthetic effluent. Phenol concentration of industrial effluent was also established using the 4-AAP method [31].
3. RESULTS ANALYSIS
The interaction between HRP covalently attached on the surface of the PDA-HRP liposome with phenol is responsible for the enzyme-substrate biological binding, disturbing the close polymer side chain. In turn, an induced stress on the conjugated PDA chain Leads to rotation of the C-C bonds in the diene-yne of the polymer backbone. Thus, the planarity of the backbone arrangement of PDAb was changed, promoting the partial distortion of conjugated π -orbital arrays, and this resulted in an increased band gap for PDA. This transformation promoted the appearance of a new band at wavelength 545 nm, which is usually designed as a red phase (PDAr) [32], Figure 1 shows the colorimetric change from blue to red of a solution of HRP liposomes in the presence of phenol and hydrogen peroxide. Figure 1A presents a diagram of the liposome after the HRP - phenol bond formation was transformed from PDAb to PDAr. Figure 1b shows the spectral changes on the blue to red PDA transformation.

Figure 1 Diagram of signal generation in the nanobiosensor by PDA- HRP liposomes interacting with phenol in presence of hydrogen peroxide, (a) PDAb was transformed to PDAr after stimuli, (b) PDAb and PDAr UV-vis spectra.114B.
This interaction disturbs the side chains and the planarity of the polymer chain in the lipid bilayer of the PDA nanostructure. Thus, it brings about changes in the conjugated n orbitals, triggering PDAb to PDAr transformation. This colorimetric conversion is the analytical signal in the nanobiosensor as the UV-vis spectrum is registered, and it is used to set the CR %. Finally, phenol is transformed into high molecular weight polymers.
CHARACTERIZATION OF POLYMERIZED LIPOSOMES
The UV-vis spectra of polymerized PDA/PDA-NHS/DMPC liposomes showed a characteristics band used to identify the polymerization of diacetylene monomers, Figure 2. An electronic transition at 650 nm, attributable to the promotion of n-electrons to π* orbital, and a weak shoulder at 590 nm was also observed, corresponding to the vibronic transition stretch stress C=C, confirming the formation of blue phase polymer (PDAb) [33].

Figure 2 also shows the UV-vis spectrum of the PDA- HRP liposome, after the immobilization reaction and cleaning by dialysis. The two principal spectral characteristics of the PDA - bands at 640 and 590 nm - were retained, and a band of low intensity appeared at 400 nm, corresponding to the absorption of the heme group by the HRP enzyme, and confirming its covalent bond to the liposome [34]. Absorbance at 400 nm of an approximate concentration of 150 nM of immobilized enzyme was estimated using the molar absorption coefficient 1.02x10⁵ M-1 cm-1 [35]. This immobilization sets a concentration of 43%, a value lower than that achieved in the literature (between 240-280 nM (62%)), following conditions similar to the EDC activation method [36].
PDA- HRP LIPOSOME INTERACTING WITH PHENOL
The enzymatic activity of HRP immobilized on the substrate phenol was examined in the presence of equimolar amounts of hydrogen peroxide. Figure 3 shows the UV-vis spectrum of the solution of HRP - PDA liposomes before and after the substrate - enzyme interaction happened. It is observed that the biological recognition affects the intensity of absorption band at 650 nm, and a band ~ 445 nm appears in the PDA spectrum. These features are associated with changes of the structure of PDA responding to different stimuli [37]. HRP activity that is covalently immobilized on the liposome involves conformational changes of the related protein directly affecting this covalent bound. The disturbance propagates through the polymer system, causing variations in the conjugate planar structure PDA, resulting in distortion of the n orbitals conjugated; this explains the presence of a new electronic absorption band at a shorter wavelength, 445 nm (PDAr) phase [38]. Overall, the resulting colorimetric signal from liposomes is considered an amplified biological recognition event [39], which will be utilized to establish a relationship between the concentration of phenol and intensity changes of the absorption bands at 650 and 545 nm.

In order to confirm that immobilized HRP retains its bio-catalyst properties, the formation of a poly phenolic fluorescent product was followed by fluorescence emission spectroscopy, Figure 4.
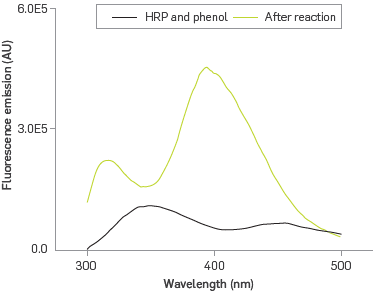
The PDA-HRP system exhibits fluorescence emission at 350 nm due to the presence of tryptophan residues and hemo group from HRP under excitation at 286 nm [40]. The PDA-HRP liposome system reacting with phenol under excitation at 286 nm introduces two new bands, one at 320 nm, characteristic of o-o'-biphenol [41], and the other one at 399 nm; the band at 350 nm is absent. The generation of polyphenol in the presence of surfactants [42], exposed to excitation energy of 350 nm emits at 399 nm. Therefore, this case provides an explanation for the disappearance of the emission band at 350 nm for the heme group via a configuration of Forster resonance energy transfer (FRET) [43], where the heme is the donor agent capable of transferring its excitation energy to the polyphenol, as Long as it was formed, which acted as the receptor agent, emitting fluorescence at 399 nm.
NANOBIOSENSOR FOR PHENOL DETECTION
The colorimetric changes due to phenol-enzyme interactions on the Liposome surface were monitored following the changes on Uv-vis spectra. CR% parameter was evaluated by using the PDA-HRP Liposomes nanobiosensor, at concentrations of phenol in the range 0.25 mM- 2.0 mM, Figure 5a.

Figure 5 CR% calculation, (a) UV-VIS absorption spectra of PDA- HRP liposomes in the range from 0.25 to 2 mM, (b) CR % calibration curve obtained from UV-vis spectra.
The PDAr band observed at 545 nm is continuously increasing meaning that the PDA - HRP liposome system retains a portion of the PDAb phase with the ability to respond to the phenol - HRP interaction in the range from 0.25 to 2.0 mM. The small absorbance change is attributed to the appearance of PDAr, resulting from the transformation of PDAb, which occurred gradually as the analyte concentration was increased, and the interaction phenol-HRP on the liposome surface was amplified. CR% was utilized to establish a relationship between the concentration of phenol and intensity changes of the absorption bands at 650 and 545 nm.
The band at 650 nm, which identifies the PDAb phase decreases up 1.0 mM add, and then absorbance showed a slight increment. This behavior is explained by a concentration in excess of the compound which absorbs at 650 nm and slows the oxidative catalysis down Equation(2) [44,45], This, in turn, oxidizes the phenol (Ph) to form a phenol radical (Ph-) and intermediate II, Equation(3) [46], Then compound II interacts with another phenol molecule to regenerate the catalytic center HRP and phenol radical is obtained, Equation(4) [47],

These phenoxyl radicals can cause chemical species such as o- o ' biphenol and polyphenols [48], The HRP immobilized nanostructures retain their enzymatic activity, forming products capable of emitting fluorescence at 399 nm.
The ability of the sensor to detect the phenol in the colorimetric phase transformation from the PDAb phase to the PDAr phase was observable as a transition from blue to red color and evaluated by the CR % parameter, and the results are presented in Figure 5b. The linear calibration curve obtained obeys Equation(5):

The R2 coefficient value obtained was 0.986, and taking into account the value of the slope of the line obtained, the sensitivity was 0.1137 Based on the standard deviation of the response and the slope, the Limit of detection (LOD) was evaluated as 3a/sLope, resulting in LOD of 0.2 mM. The PDA control liposomes, in the presence of phenol and experiments of a hydrogen peroxide/phenol mix, showed a CR % ~1%, ~3%, respectively.
NANOBIOSENSOR PERFORMANCE FOR DETECTING PHENOL IN A SYNTHETIC EFFLUENT SIMULATED KRAFT PROCESS
The phenol content of synthetic black liquor resulting from Kraft simulated process was adapted and treated at pH 8.0, and 2.0 mM was calculated from the CR % calculated in Figure 6a. Photographs were also obtained for colorimetric change, Figure 6b.

Figure 6 Evaluation of the phenol derivatives concentration in the simulated Kraft effluent (a) spectral changes of PDA - HRP liposomes before and after addition, and (b) pictures of the colorimetric transition observed, before a. and after b.
Table 1 presents the characterization of the synthetic Kraft effluent with a concentration of 2.15 mM phenol determined through method 4-AAP. This value was used for comparison and the calculated error of the biosensor (at triplicate) was 7%,

The resultant phenol concentration of the simulated Kraft effluent was calculated to be 450.2 mg/L. As comparison data for phenol concentration, about 3100 mg/L is reached in a conventional Kraft process [49], Thus, the phenol content of the synthetic effluent produced a sixth of the concentration of a real effluent; this result can be explained by differences in temperature and pressure conditions reached in the simulated process in the lab, in contrast to the typical Kraft process.
The working mechanism of nanobiosensor is based on the interaction between phenol and HRP immobilized in PDA liposomes and the opportunity for multiple simultaneous binding due to the fact that HRP possesses a dimension size 62x43x12 A3, with many anchor points carrying lysine residues [50], Ligand recognition - HRP causes a distortion of the conjugated polymer chain, producing a change in the spectral properties of the liposomes, similar to the interaction between the enzyme hexokinase immobilized in a film PDA and glucose [51]
CONCLUSIONS
The characterization of the nanostructure obtained indicates that the PDA liposomes support modification for covalently anchoring the HRP. The immobilization process preserves the enzymatic activity and HRP can interact with the phenol substrate or a mixture of phenolic derivatives in a synthetic industrial mix to establish a ligand-enzyme recognition event. This biological signal was detected by the PDA backbone, transforming it from the blue PDA to the red PDA phase. Spectral changes made it possible to calculate the colorimetric response (CR%) of the nanobiosensor, and a relationship between CR% and phenol concentration was used to determine analyte concentration in the range 0.25 to 2.0 mM. The benefits of the method include its simplicity, sensitivity, and the accuracy of the optical system for the determination of phenols in wastewater when the concentration of phenolic compounds in the waste discharges can be as high as 0.25 mM (52). However, a comparison with other phenol detection methods, found in literature, has shown the detection of trace quantities; but different issues enhance its application, Table 2.


