


 English (pdf)
 Article in xml format
 Article references
 Send this article by e-mail
 Cited by SciELO
  Cited by Google
  Similars in
SciELO
Similars in
SciELO  Similars in Google
 Permalink
■ GRAPHICAL ABSTRACT
HIGHLIGHTS:
- Wind energy generation has no potential at Ciudad Juárez (Mexico)
- The installation of small wind turbines in Ciudad Juarez is not economically feasible. The economic scenarios simulated for the wind suggest long payback periods.
1. INTRODUCTION
The use of renewable energy to replace fossil fuels is a viable strategy for addressing environmental issues arising from rising energy demand. Renewable energy resources have piqued the interest of the power generation industry in recent years owing to their lack of pollution and the capacity to gather endless amounts of energy. According to the United Nations Framework Convention on Climate Change (UNFCCC), all human activities that change the composition of the atmosphere and impact meteorological variables, such as temperature, rainfall, cloud cover, and air currents, are to be blamed for climate change. One of the primary contributors to global warming that endangers people is human activity, which uses energy from fossil fuels [1].
Wind energy is an important renewable energy source that offers clean and limitless energy. Numerous data are available on the presence and behavior of wind at high altitudes worldwide, but more data are needed on the presence and speed of wind in metropolitan areas at low altitudes [2]. In Mexico, a portion of the subsidy for fossil fuels, gas, and electricity was abolished in early 2017, leading to an increase of up to 20% for fossil fuels and gas and up to 4.5% for electricity. Although this harmed most Mexican economies, it may also have a positive impact on the growth of renewable energy projects [3]. The Mexican government has committed to including wind energy in its energy programme [4]. According to the Mexican Wind Energy Association (Asociación Mexicana de Energia Eólica, AMDEE), Mexico has 46 wind farms, with a total installed capacity of 4005 MW, and the capacity of the sector is expected to rise to 14,000 MW by 2022. To facilitate this expansion, the Mexican government proposed an energy transition whereby renewable energy will account for 35 percent of the national power output by 2026, with wind accounting for approximately 40 percent of this capacity. Consequently, Mexico's wind energy generation capacity has increased rapidly since 2008 [5].
Significant research has been conducted on the feasibility and potential of wind energy in various climates worldwide. Velasco-Herrejon and Bauwens [6] used the capabilities method to examine the factors that affect community acceptance of energy technologies. This research relies on the capacity method to reveal what these justice tenets imply for the native population near wind farms in southern Mexico. A bottom-up approach to understanding the complicated concepts of energy justice within a community can led to increased knowledge of justice considerations related to the community acceptance of energy technology. These criteria pertain to inclusive community involvement, which recognizes indigenous day-to-day existence and a common identity in Mexico.
Hernández-Escobedo Perea-Moreno and Manzano-Agugliaro [7] studied the wind energy situation in Mexico and used the data reported in Scopus. Huesca-Pérez, Sheinbaum-Pardo and Koppel [5] examined the social implications of wind energy from four perspectives: socio-environmental, socio-economic, socio-cultural, and stakeholder involvement, and further analyzed wind power projects in the Isthmus of Tehuantepec (Mexico), against the backdrop of a literature review. Additionally, Dunlap [8] reported a study on the advent of the Bi Hioxo Wind Park on a common property established to the south of Juchitán (Mexico). Perea-Moreno, Alcalá, and Hernandez-Escobedo [9] calculated the primary wind parameters of 141 places along the Gulf of Mexico states. Siamanta and Dunlap [10] examined the similarities and contrasts between two wind-energy development experiences in Crete, Greece, and Oaxaca, Mexico.
For the South-West area of Algeria, Himri, Merzouk, Kasbadji Merzouk and Himri [11] used the RETScreen and WAsP tools to analyze windfarm economic feasibility and wind power potential. Serdari, Muda, Buzra, Berdufi, Halili, Halili, Mitrushi and Berberi [12] investigated the cost, greenhouse gas reduction, financial analysis, and other technical and economic aspects. The Wind Atlas Balkan was used in this study, with measurements lasting one hour each for 34 years (1981-2014). Hadi, Oudah and Al-Baldawi [13] observed wind data at heights of 10, 30, 50, and 52 m every 10 min to conduct a preliminary economic feasibility study of a wind power plant in Al-Shehabi (Wasit-Iraq).
Malka, Konomi, Gjeta, Drenova and Gjikoka [14] investigated the extent to which the power system's absorption capacity from RES electricity may be increased. Taghinezhad and Sheidaei [15] and Wang, Guo, Fan and Li [16] investigated the operation of a ducted wind turbine, under various wind conditions, in a study that enhanced forecast accuracy at a target location and reported a multiple-point model for short-term wind speed prediction relying on data from numerous places. Another study by Lee [17] determined the best interpolation method among deterministic and geostatistical interpolation strategies.
Zhang, Liu, Zhao, Post and Chen [18] report on the history, present situation, and projected trends of wind energy growth in New Zealand. They evaluated the top wind energy storage option for New Zealand by contrasting seven popular wind energy storage systems and the design and operation of tiny domestic wind turbines with conventional power ratings ranging from 0.004 to 16 kW in New Zealand cities. Rezaei, Naghdi-Khozani and Jafari [19] reviewed the financial aspects of harnessing wind energy to produce hydrogen in 34 capital cities in Afghanistan. Initially, the levelized cost of the power produced by the wind was expected. The energy efficiency of the hydrogen production system, levelized cost of hydrogen (LCOH), and payback period for installing a wind farm were then analyzed for the city with the lowest levelized cost of electricity.
Rezaei, Mostafaeipour, Saidi-Mehrabad, Qolipour, Sedaghat, Arabnia and Momeni [20] conducted a sensitivity analysis on the variables influencing wind sites based on 13 cities in the Iranian province of Fars. The cities were then rated using the dual version of the data envelopment analysis model, and six criteria- wind conditions, population, available land conditions, distance to distribution networks, frequency of natural disasters, and price of land-were adopted.
Rezaei-Shouroki, Mostafaeipour and Qolipour [21] selected and prioritized 13 Iranian cities in the province of Fars based on how well-suited they were for the development of wind farms. The cities were ranked and prioritized using six criteria. The most crucial of these characteristics, wind power density, was determined by gathering 3-hour wind speed datasets between 2004 and 2013. Prioritizing and ranking cities were performed using the Data Envelopment Analysis (DEA) approach, and the results were then validated using the Analytical Hierarchy Process (AHP) and Technique for Order of Preference by Similarity to Ideal Solution (FTOPSIS) methods. Additionally, distributed renewable energy access (DREA) based on a wind energy conversion system integrated into low-voltage direct current (LVDC) networks is presented by Miranda, Salgado-Herrera, Rodríguez-Hernández, Rodríguez-Rodríguez, Robles, Ruiz-Robles and Venegas-Rebollar [22]. The DREA was examined and modelled in relation to wind speed data collected over the course of a year at Baja California, Sur. Based on an analysis of the wind speed turbulence intensity, five type-4 wind turbines were subjected to the representative variability.
Also, relative to the beaches in the states of Tabasco, Campeche, and Yucatán, Hernández Galvez, Chuck Liévano, Sarracino Martínez, Lastres Danguillecourt, Dorrego Portela, Narcía, Saldaña Flores, Pampillón González, Perea-Moreno and Hernandez-Escobedo [23] report the analysis and viability of using offshore wind energy. This is due to the availability of data on that area, but there are also stated sustainability standards that can be applied in other areas, and data from MERRA-2, ERA-5, WAsP, and Windographer tools were used. According to this report, Tabasco, Campeche, and Yucatán in Mexico were determined to have wind capacity factors of 32%, 37%, and 46%, respectively. Each wind farm may generate more than 35% of the area's electricity needs under the WF100% scenario, with Campeche and Yucatán's wind farms contributing more than 70 %. Mexico has fewer wind energy facilities than other North American countries. Texas has the largest installed wind power capacity, followed by New Mexico, Arizona, and California, all of which border Mexico. Geographical and chronological data on wind energy resources were considered as the wind resources in these bordering states, suggesting the need to study wind energy resources in Northern Mexico. Wind speeds greater than 4.51 m/s are present throughout the states of Chihuahua, Coahuila, Nuevo Leon, and Tamaulipas in northern Mexico. Since Mexico began to use renewable energy sources in recent years, the government has demanded an energy reform that enhances the circumstances for wind energy investment in Mexico [24].
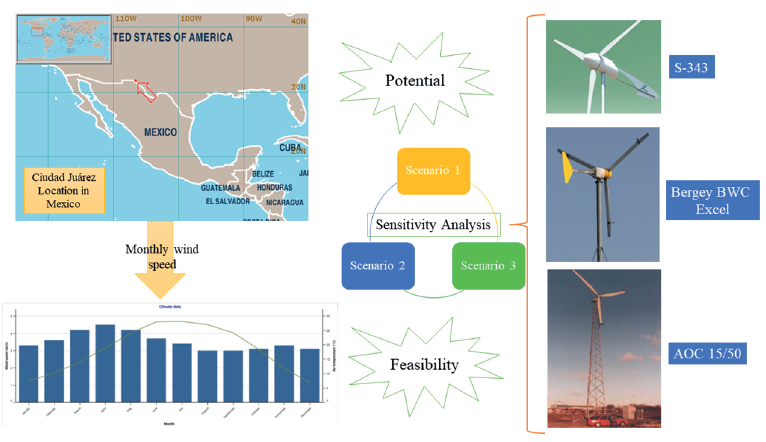
Reviewing previous studies in the field of wind energy potential measurement, it was concluded that wind speed in the study area has low potential, and it is not possible to expand wind energy at a large or even medium scale. However, a more detailed study is yet to be conducted in these areas regarding the possibility of expanding wind energy at a smaller scale from an economic standpoint. This study investigated the wind energy potential at the Ciudad Juárez station in the north of Chihuahua State (Mexico) for 12 consecutive months. The economic feasibility of installing smaller wind turbines in Ciudad Juárez using the RETScreen software to determine whether the study site is economically viable for installing these wind turbines.
The novelty of this work is the study of the feasibility of using three small-scale wind turbine models, including S-343, Bergey BWC Excel, and AOC 15/50, in the geographic location of Ciudad Juarez (Chihuahua, Mexico) in a 12-month model using the RETScreen software. Additionally, using three defined economic scenarios, a sensitivity analysis is reported regarding the performance of these three turbine models, having determined and discussed their operational conditions.
STUDY SITE
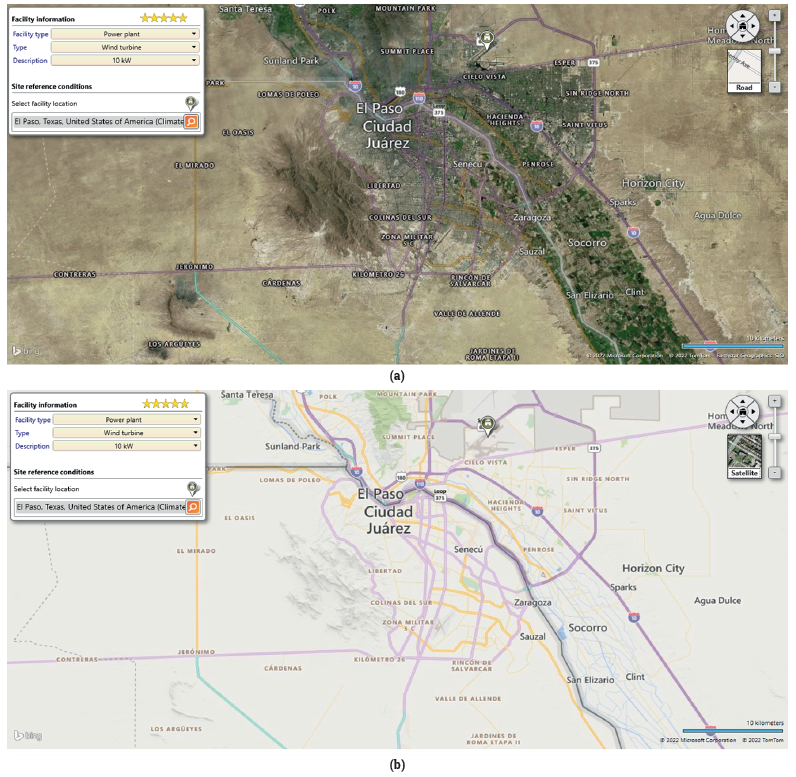
Ciudad Juárez is situated at geographic coordinates 31°44' 22" N 106°29' 13" W and an altitude of 1137 meters above sea level, where the border between the United States and Mexico ceases. Marked by the Rio Grande, it becomes a geodesic line in an east-west direction and a wide valley formed by the same river between two mountain ranges to the north, currently in the United States, the Franklin Mountains that reach 2192 m above sea level, and to the south, the Sierra de Juárez that largely forms the western limit of the urban area; in the Sierra de Juárez, the Cerro Bola is located, with an elevation of characteristic formation of the area, which reaches approximately 1800 m above sea level [25]. Figure 1(a) shows the geographical location, and figure 1(b) shows the road map of Ciudad Juárez.
Wind speed data for 12 months from the first of January 2021 to the end of December 2021 have been extracted and analysed. The average temperature of the station was 18.3°C, and the average humidity was 41%. Figure 2 shows the changes in the average monthly wind speed and the average monthly air temperature for Ciudad Juárez. Wind energy potential for installation of wind turbines at average speeds less than 4 m/s is poor, 4-5.5 m/s is tolerable, 5.56.7 m/s is good to very good, and excellent for speeds above 6.7 m/s is possible [26]. At the study site (Ciudad Juárez), the wind speed at the study height (10 m) was low. For a more accurate assessment, it is necessary to examine the economic and technical feasibility of small wind turbines for home use, as discussed below.

Figure 2 (a) Changes in average monthly wind speed (Blue bar chart) and average monthly air temperature (Green line) (b) maximum and minimum daily temperature variation (c) diffuse radiation (orange) and global radiation (yellow) in Ciudad Juárez
Figure 2(a) shows that the monthly wind speed varied between 3 m/s and 4.5 m/s. The highest and lowest wind speeds were recorded in April and August and September, respectively. Given that the start-up speed of many small wind turbines is 3 to 3.5 m/s, it is possible to generate wind power on a small scale during the year. Nonetheless, from an economic standpoint, this plan should also be examined to ensure its feasibility in current circumstances. Furthermore, figure 2(b) shows the maximum and minimum daily temperature variations, and figure 2(c) shows the diffuse radiation and global radiation in Ciudad Juárez.
Table (1) displays the findings of the RETscreen software study for the three small wind turbines. The energy production cost ($), Annual CO2 reduction (tone), capacity factor, Net present value, payback period, exported electricity, and benefit-cost ratio are some of the output characteristics.
Table 1 Specifications of wind turbines and estimated costs
| Turbine | Manufacturer | Rated Power (kW) | Hub-Height (m) | Rotor Diameter (m) | Turbine cost ($) | Initial Cost ($) | Operation & Maintenance Cost ($) | References |
|---|---|---|---|---|---|---|---|---|
| S-343 | Endurance | 5 | 36.6 | 6.4 | 30,000 | 42,000 | 525 | [27] |
| Bergey BWC Excel AOC | Bergey | 10 | 30.5 | 7 | 50 000 | 70 000 | 875 | [28] |
| 15/50 | Atlantic Orient | 50 | 30 | 15 | 250,000 | 350,000 | 4,375 | [29] |
RETSCREEN SOFTWARE
This software is managed under the leadership and financial support of the Canmet ENERGY Varennes Research Center, an organization affiliated with the Canadian government. The main executive team of this software benefits from cooperation with several governmental and multilateral organizations and has the technical support of a network of industry, government, and academic experts. Major collaborators include York University's Sustainable Energy Initiative, the Global Environment Facility, the World Bank Carbon Management Fund, Independent Power System Operator Ontario's Energy Technology, Industry and Economics Unit, and the NASA Langley Research Center's Renewable Energy and Energy Optimization Partnership.
To assist the user, RETScreen combines several databases, including global climate databases from 6,700 ground stations and NASA satellite data, as well as baseline, cost, project, hydrology, and product databases. In addition, this software includes extensive integrated learning resources, including an available eBooklet. Users can create a large database and enter their desired parameters such that the program can help them make decisions [30 - 32].
RETScreen allows experts and decision-makers to quickly identify, evaluate, and optimize the feasibility and technical and financial potential of clean energy projects. Furthermore, it allows managers to easily measure the actual performance of their sub-assemblies and identify and implement opportunities to save energy and costs. According to statistics, this software is widely used to facilitate and implement clean energy projects. For example, refer to the following:
To upgrade the Empire State Building using energy optimization plans at the production centers of 3M Canada
Widely used by the Irish wind energy industry to analyse potential new projects
To monitor the performance of hundreds of schools in Ontario
By the plan of simultaneous electricity and heat production of Manitoba Hydro company (optimization of bioenergy to check project applications)
For energy management on university and college campuses
In multi-year performance estimation and evaluation of photovoltaic projects in Toronto, Canada
ECONOMIC ANALYSIS
The amount of electricity generated, and the amount of wind energy converted to electricity for the three wind turbines in terms of megawatts are calculated in Table 2. As it is known, the AOC 15/50 turbine with a capacity of 50 kW and 5 units has the highest output energy (164 MWh per year).
Table 2 Results extracted from RETScreen software.
| Turbine | Energy production cost ($/kWh) | Annual CO2 reduction (tone) | Capacity factor (%) | Net present value ($) | Payback period (years) | Exported electricity (MWh) | Benefit-Cost (B-C) ratio |
|---|---|---|---|---|---|---|---|
| S-343 | 0.4225 | 13 | 10.5 | -63,944 | > project life | 23 | -2.4 |
| Bergey BWC Excel | 0.6857 | 16 | 6.5 | -146,754 | > project life | 28 | -2.9 |
| AOC 15/50 | 0.5905 | 95 | 7.5 | -709,358 | > project life | 164 | -2.8 |
The capacity factor of a turbine is equal to the ratio of its output energy to its capacity. The capacity factor is another way to express the amount of energy the wind turbine produces and determines whether it produces the desired energy. For instance, if the capacity factor for a turbine is above 20%, even if one does not know how much energy the turbine produces, one can be sure that it is producing its best. In addition, with a higher capacity factor, the final cost of wind electricity is reduced. Research has shown that the appropriate capacity factor for wind farms is between 20% and 40% [33].
Table 2 shows that the calculated capacity factors for the three wind turbines ranged from 6.5% to 10.5%. These values are very low and indicate that the wind turbines in Ciudad Juárez have low energy production, and at the same time, their installation is not economical. However, it is noteworthy that in a feasibility study, other economic parameters must also be considered in addition to the capacity factor of the turbines to reach a complete conclusion. The Energy production costs from the wind turbines are shown in Table 2. The cost of electricity generated by these turbines varies between 0.4225$ and 0.6857$ per kilowatt hour (Canadian Dollar). In 2019, the global weighted average energy cost for new onshore wind farms was 0.053 USD/kWh, with country/region values ranging from USD 0.051 to USD 0.099/kWh. Without financial assistance, today's most competitive projects have costs as low as 0.030 USD/ kWh [34]. Therefore, our findings show that the costs obtained for the Ciudad Juárez region are higher than those of selling wind power.
One positive feature of the RETScreen software is the calculation of the annual CO2 reduction for a feasibility project for renewable energy systems. To calculate the amount of annual CO2 reduction, the software equated the amount of energy generated by the desired wind turbine with the energy generated by systems that pollute the environment and produce CO2. Hence, it can be estimated, if replaced, how much CO2 will the wind turbine reduce instead of the previous system (which pollutes the environment). As shown in Table 2, the largest CO2 reduction was related to the AOC 15/50 turbine, which is equivalent to 95 tons of CO2.
The benefit-cost (B-C) ratio is equal to the ratio of the current annual value of all project revenues and benefits to the total cost of the wind energy project. Values above 1 indicate that the project is economically viable. Table 2 shows that the ratios of the three turbines are negative, which suggests that the project can be economically unprofitable.
The net present value (NPV) in engineering economics is a standard method for evaluating economic plans. The output is discounted at a certain rate. In other words, the net present value of the investment funds is calculated, and after deducting the initial investment amount, it is recognized as the net present value. Current net worth is widely used in economic calculations, engineering economics, country budgets, microeconomics, macroeconomics, trade, and industry.
Since for calculating the NPV, the cash inflows and outflows of the project must be carefully discounted (according to the set discount rate), and this is often complicated and time-consuming due to the complexity of the cash flows, new tools easily and accurately perform these calculations in a few seconds, showing the results in the form of net discounted cash flows. A design is acceptable if its NPV is positive [35] and, as can be observed, the NPV is calculated for three small wind turbines, and all three have a negative value, which indicates that installation in Ciudad Juárez is not justified. The payback period occurs when a project's projected benefits reimburse its costs. In other words, the payback period is when the projected cumulative income equals the investment amount [35]. With this method, the criterion for evaluating the plan is the time required for the return on investment. Shorter payback periods are more attractive than longer ones. This method is particularly useful when comparing two or more designs. As seen in Table 2, the payback period for the three turbines is greater than the project life, indicating a high payback period and economic unsuitability of the project.
SENSITIVITY ANALYSIS
Sensitivity analysis is a stage of economic evaluation of wind projects that examines the effects of economic and financial fluctuations resulting from changes in the input economic parameters. Therefore, this analysis identifies and estimates sensitive and effective indicators related to projects. For a better economic assessment, except for the current scenario, the inflation rate was assumed to be 7%, discount rate was 9%, fuel cost escalation rate was 7%, and project life was 20 years. Three new scenarios were considered for the economic analysis of the use of the three turbines listed in Table 2. Table 3 lists the parameters related to each of the scenarios and their values, and the results of the changes applied to the three turbines studied are listed in Table 4.
Table 3 Values related to input parameters in 3 different scenarios.
| Parameters | Scenario 1 | Scenario 2 | Scenario 3 |
|---|---|---|---|
| Inflation rate (%) | 6% | 4% | 2% |
| Feed-in-tariff rate (cent/kWh) | 10 | 15 | 20 |
| GHG reduction credit($/tonCO2) | 500 | 1000 | 2000 |
| Initial costs reduction (%) | 5 | 10 | 15 |
The CO2 reduction credit is the number of incentives given to renewable electricity producers for one ton of annual carbon dioxide reduction due to renewable electricity generation. The reduction in initial costs is the percentage of reduction in investment costs. As shown in Table 4, the turbines were economically justified in the second and third scenarios. This situation is related to the second scenario, in which the inflation rate is 4%. The feed-in tariff rate was 0.15 cents/kWh, the GHG reduction credit was 1000 $/tonCO2, Reduction in Initial costs was 10%. In the third scenario, the inflation rate is 2%, the feed-in-tariff rate is 0.2 cent/kWh, the GHG reduction credit is 2000 $/tonCO2, and the Reduction in Initial costs is 15%. Obviously, reaching such a situation for the second scenario seems difficult, and it is very difficult to reach the third scenario. As shown in Table 4, considering the above conditions in the second scenario, the payback period for the S-343 turbine is 3.6 years, for the Bergey BWC turbine 6.3 years and the AOC 15/50 turbine Equivalent to 5.3 years. Regarding the third scenario, the payback period is 1.7 years for the S-343 turbine, 2.9 years for the Bergey BWC turbine, and 2.4 years for the AOC 15/50 turbine.
Table 4 Results for 3 scenarios
| Turbine | Net present value ($) | Benefit-Cost (BC) ratio | Payback period (years) | Energy production cost ($/kWh) |
|---|---|---|---|---|
| S-343 | ||||
| Scenario 1 | -55,485 | -2.3 | 8 | 0.3821 |
| Scenario 2 | -35,738 | -1 2 | 3.6 | 0.3465 |
| Scenario 3 | -16,902 | -0.13 | 1.7 | 0.3153 |
| Bergey BWC Excel | ||||
| Scenario 1 | -129,838 | -2.8 | 15.5 | 0.6202 |
| Scenario 2 | -99,777 | -2.1 | 6.3 | 0.5624 |
| Scenario 3 | -71,538 | -1.4 | 2.9 | 0.5117 |
| AOC 15/50 | ||||
| Scenario 1 | -634,776 | -2.7 | 12.4 | 0.5341 |
| Scenario 2 | -462,265 | -1.9 | 5.3 | 0.4843 |
| Scenario 3 | -308,863 | -1.1 | 2.4 | 0.4407 |
4. CONCLUSION
Wind energy is a new renewable energy source used to generate wind power, showing a high growth rate. In recent years, the use of this energy source has begun in Mexico, but it has little capacity. This study focused on the wind energy potential at the Ciudad Juárez station in the north of Chihuahua state in Mexico for 12 consecutive months. The economic feasibility of installing smaller wind turbines in Ciudad Juárez using RETScreen software was used to determine whether the study site is economically viable. The conclusions of this study can be summarized as follows.
The predicted capacity factors of the three wind turbines ranged from 6.5% to 10.5%. These numbers are extremely low and show that the Ciudad Juárez wind turbines produce very little electricity, while also being expensive to install.
These turbines produce power at a price per kilowatt hour ranging from 0.4225 to 0.6857 dollars (Canadian Dollar). With country/regional values ranging from 0.051 to 0.099 USD/kWh, the global weighted average energy cost for new onshore wind farms in 2019 was 0.053 USD/kWh. Currently, the most competitive projects have prices as low as USD 0.030/kWh, without financial help. Thus, our findings suggest that the costs incurred in the Ciudad Juárez region are greater than those of selling wind energy.
Cost-benefit (B-C) ratio values above 1 denote the project's economic viability, and the three turbines have a negative ratio, suggesting that the project could not be financially viable.
Three small wind turbine NPVs are calculated with negative values, indicating that their installation in Ciudad Juárez is unjustifiable. Furthermore, the payback duration for the three turbines exceeds the project life, demonstrating the project's economic inadequacy and extended payback period.

