


 English (pdf)
 Article in xml format
 Article references
 Send this article by e-mail
 Cited by SciELO
  Cited by Google
  Similars in
SciELO
Similars in
SciELO  Similars in Google
 Permalink
1. Introduction
A Partial Discharge (PD) is a localized electrical pulse that occurs in the insulation system of high voltage (HV) equipment. Partial discharges appear as short duration pulses having a duration much less than 1µs due to electrical stress concentrations in the insulation systems or on the surface of the insulation [1]. PD ocurrence may cause damage leading to a breakdown of the insulation system.
Therefore, early detection of insulation defects in high voltage equipment is a major concern to be adressed. Extensive research related to PD phenomena has been conducted and including: its detection and acquisition techniques, chemical and physical processes, denoising methods, feature extraction and PD pattern classification algorithms [2]. PD denoising is an important task mainly in PD online monitoring systems [3]. Several studies have reported methods based on the wavelet transform for PD denoising of white noise [3-8]. However, the signal to be filtered through the wavelet transform may be distorted. The distortion of a de-noised signal is closely related to the selected mother wavelet and to the threshold selection [9].
Among research areas related to PD phenomena, feature extraction and PD pattern classification are fundamental processes in order to implement an insulation condition monitoring system that can automatically identify the type of PD sources [10-12].
Since 1990, researchers have shown a strong interest in performing PD classification using artificial intelligence techniques [13-22]. Studies like [2,10,13,19,23-33] have reported the use of Multilayer neural networks for PD classification, in which high recognition rates have been found for different types of PD defects. The advantage in using neural networks over other types of classifiers is the possibility they offer to learn from examples [34]. But as early as 2004, researchers have shown a growing interest in DP classification using support vector machines [35-46]. In general, DP classification results using support vector machines have yielded better classification results compared to other classifiers (including neural networks) [2,47]. However, there are still important challenges related to apply appropriate AI techniques for automatic PD source classification such as: feature extraction, application of suitable pattern recognition algorithms and recognizing multiple PD sources that may occur simultaneously in (HV) equipment.
In this paper, we propose a multi-layer perceptron (MLP) backpropagation neural network and a binary support vector machine architecture as artificial intelligence algorithms to automatically identify PD patterns using statistical operators as input features, and compare their performance based on classification results. Additionally, multilevel wavelet decomposition was used to denoise PD signals prior to the classification process. Different mother wavelets for different levels were tested to find better signal to noise ratio (SNR) with less distortion after the denoising process.
This paper is organized as follows: In section 2, the practical setup used in this work is presented. A high level overview of the developed real-time application is explained in section 3. In section 4, we give a brief introduction to Discrete wavelet transform (DWT) and results of PD denoising are presented. The feature extraction process is explained in section 5. The artificial intelligence algorithms and the results of PD pattern classification are presented in section 6. Finally, conclusions are stated in section 7.
2. Experimental setup
The practical setup for PD measurement was implemented according to IEC60270 recommendations and is depicted in Fig. 1.

A voltage level coming from the secondary of the transformer is applied across the test object to generate PD signals.
A quadrupole which contains the measuring impedance includes a high-pass and a low-pass filter in order to separate the DP signals from the power cycle, respectively. The data acquisition card captures the power cycle and the DP signals in different channels to send them to the computer for signal processing.
Artificial PD models such as a tip-hemispherical electrode; a rod-plane electrode and a stator coil were used to simulate corona, surface and internal partial discharges, respectively. The data acquisition card used in this work was the National Instruments NI-5133, which provides two simultaneously sampled channels, a sample frequency up to 100MSPS, 50MHz bandwidth, 8-bit resolution, etc.
3. GUI application
In order to process the PD signals, a Labview application was developed which consists of several tabs that allow: view the acquired signals in scope mode, plot the phase resolved partial discharge diagram, display statistical parameters associated to PD patterns and classify the corona, surface and internal PD patterns using artificial intelligence-based algorithms. Fig. 2 shows the application main window where the user can interact with the acquired PD signals in real time and enter different values depending on the acquisition needs. Once the acquisition and processing are finished, all the results are available to be consulted in their associated tabs.

A 256x256 matrix was designed to record all the informationrelated to PD pulses, where rows represent peak values and columns represent phase angles, as shown in Fig. 3. Each coordinate was associated with a specific PD pulse of a certain peak value and phase angle, therefore, a coordinate is incremented in one every time its associated PD pulse is detected.

The 256x256 matrix facilitated the statistical parameters computation and allowed to plot the PRPD diagram.
Fig. 4 shows the three typical PRPD patterns obtained for each type of PD.

4. Discrete Wavelet Transform (DWT)
4.1. A brief introduction to discrete wavelet transform
A wavelet is a short duration small wave that has zero mean value; it increases in amplitude and then decreases back to zero quickly. It satisfies:


Where ψ t is the mother wavelet. A family of wavelet functions associated with 𝜓(𝑡) can be denoted as:

Where 𝑎 is a scaling factor to determine the amplitude and duration of the mother wavelet. The translation factor 𝑏 is used to shift the mother wavelet along the time axis. The continuous wavelet transform (CWT) of a signal 𝑓(𝑡) is defined as [48-50]:

The discrete wavelet transform (DWT) of a signal is obtained by means of a filtering scheme called quadrature mirror filters (QMF) which is a digital filter bank structure. QMF allows for signals to be decomposed into several frequency coefficients and then reconstruct the original signal by using the inverse discrete wavelet transform (IDWT). The original signal is fed through a number of complementary low-pass (L) and high-pass (H) filters and down-sampled by two. The low and high frequency content, also known as “approximation” and “detail” coefficients are given by the low-pass and high-pass filters, respectively [51-55]. A three-level discrete wavelet transform for a signal 𝑠(𝑘) is shown in Fig. 5.

4.2. Wavelet denoising of partial discharges
There is still no universal or precise method regarding to wavelet type, threshold or level selection since every approach depends on a specific problem [53]. Therefore, the selection of the best wavelet parameters has to be made by means of a trial and error process.
In order to compare the denoising performance with different mother wavelets for different levels of decomposition, the signal to noise ratio (SNR), the reduction in noise level and the root mean square error (RMSE) were considered.
4.2.1. Signal to Noise Ratio (SNR)
It is a measure that indicates the ratio of the power of a signal to the level of noise, usually expressed in decibels (dB). The signal to noise ratio is defined as [53]:

Where, 𝑥(𝑖) is the signal of reference, 𝑦(𝑖) is the denoised signal and 𝑁 is the number of sample points. A positive value of SNR means the power of signal is greater than the power of noise and vice versa for a negative value of SNR.
4.2.2. Reduction in noise level
In practical measurements, there is no signal of reference, therefore, only the reduction of noise level can be computed, which is the amount of suppressed noise. The normalized reduction of noise level is computed as [54]:

Where 𝑧(𝑖) is the noisy signal, 𝑦(𝑖) is the denoised signal and 𝑁 is the number of samples.
4.2.3. Root Mean Square Error (RMSE)
RMSE is an indicator of the signal distortion after the filtering process. The smaller the RMSE, the more similar is the denoised signal to the signal of reference and less the distortion after filtering. The RMSE is defined as [55]:
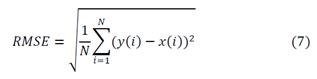
Where, 𝑥(𝑖) is the original signal, 𝑦(𝑖) is the denoised signal and 𝑁 is the number of sample points.
4.3. Denoising results
Many tests were made to find the most appropiate wavelet parameters for better denoising results. It was found that PD signal denoising using a soft-threshold function yields a greater value of RMSE compared to a hard-threshold function. Therefore, all the denoising tests in this work were carried out using the latter.
In order to analyze PD signals with higher level of noise, Gaussian white noise was simulated and added to PD signals. Fig. 6 shows a typical internal PD signal used as a reference signal. Fig. 7 shows the reference signal with simulated white noise added such that SNR=-13dB. Results of denoising in the form of SNR and RMSE values are shown in Table 1.


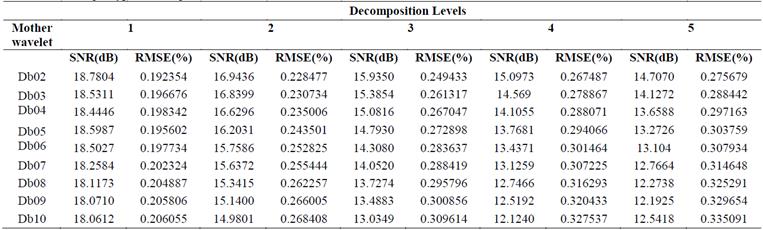
From Table 1, it is observed that the highest values of reduction in noise level and signal to noise ratio are obtained for a single level of DWT decomposition. Also, it can be noted from Table 1 that the RMSE value is smaller for one level compared to higher levels of DWT, which implies that the distortion of the signal is less for a single level. Similar results are reported in [56, 57].
5. Feature extraction
Feature extraction is carried out as a prior stage for pattern recognition. In this work, the feature extraction process was implemented using statistical operators, which can be obtained from statistical distributions. The shape of statistical distributions provide information related to the type of PD signals, therefore, statistical operators can be used as discriminatory parameters for classification purposes. The statistical distributions for PD signals are defined as [16,34]:
 : The number of discharges per each window as a function of the angle 𝜑.
 : The average pulse amplitude per each window as a function of the angle 𝜑.
 : The maximum pulse amplitude per each window as a function of the angle 𝜑.
A set of statistical operators obtained from the distributions described above can be also called PD-figerprints. In this work, PD-fingerprints include:
Skewness (Sk): Measures the degree of asymmetry of a distribution. Sk=0 means the distribution is fully symmetric. A positive skewness means the distribution is skewed to the left. A negative skewness means the distribution is skewed to the right. The skewness is defined as:
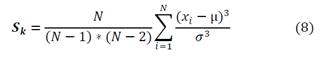
Where 𝑥 𝑖 is the i-th variable, µ is the mean value, 𝜎 is the variance and 𝑁 is the number of data points.
Kurtosis: it is an indicator of the sharpness of a distribution. Ku=0 means a normal distribution. A positive kurtosis means a sharp distribution. A negative kurtosis means a flat distribution. Kurtosis is defined as:

Mean: it is the average for each semi-cycle of each distribution.
Cross-correlation: it describes the difference in distribution shape between the positive and negative semi-cycle of a distribution. c.c=0 means total shape asymmetry. c.c=1 means total shape symmetry. Cross-correlation is defined as:

6. Pattern recognition algorithms
6.1. Classification using ANN
There are different ANN-based algorithms to solve pattern recognition problems [34].
The neural network implemented in this work is a Multilayer Perceptron (MLP) based on the backpropagation algorithm [58]. The MLP structure used in this work is made up of three layers as illustrated in Figure 8: an input layer, a hidden layer and an output layer. Layers are made up of a number of neurons in which each neuron has a sigmoid activation function; the output layer is made up of three neurons, each for one of the three types of PD patterns to be classified (internal, corona and surface). PD fingerprints were used to train the neural network using measurements files so that a new feature input vector can be classified into one of the PD patterns. The feature set consists of 20 statistical operators as shown in Figure 8, including skewness, kurtosis, mean, number of peaks and cross-correlation, which are obtained from the statistical distributions 𝐻𝑛 ± (𝜑), 𝐻𝑞𝑛 ± (𝜑) and 𝐻𝑞𝑚𝑎𝑥 ± (𝜑).

6.2. Classification using SVM
A support vector machine (SVM) is a binary classifier and a supervised learning model that takes the data points belonging to a spatial domain into another spatial domain of a major dimension which is defined by a kernel function that separates the two classes by means of an hyperplane (also called support vector). This facilitates the classification of the input data into one of the two classes. A support vector machine always looks for the hyperplane that maximizes the margin between the two spaces of points.
Mathematically, an SVM is a linear classifier according to equation 11, which maximizes the margins of classification. The margin of classification is the distance between the classification boundary and the closest point to each class. Equation 12 describes the separation hyperplane. Margin maximization (which minimizes the risk of errors in classifying data) gives the SVM an excellent generalization capability.


Where 𝑤 𝑇 is a vector orthogonal to the hyperplane and “•” is a dot product.
For non-linear separable data, a kernel function is introduced in order to allow the data to be brought into a larger space called a feature space, so that equation 11 can be rewritten as in equation 13 [35]:

Where 𝛷 𝑥 is the kernel function.
A polynomial Kernel was used in this work and is defined as:

Where 𝑥 and 𝑦 are vectors in the input space, 𝑛 is the degree of the polynomial. The degree of the polynomial Kernel used in this work was quadratic (𝑛=2).
Support vector machines are binary classifiers, that is, they can only classify two classes. However, it is possible to classify more than two classes using several units in parallel, where the number of units to be used is calculated by equation 15.

Where 𝐽 is the number of classes to be classified.
A “voting process” must be held where each class can obtain up to 𝐽−1 possible votes. The entry pattern will be assigned to the most voted class [36].
The SVM architecture implemented in this work is shown in Figure 9. According to equation 15, three units in parallel were required to classify the three types of PD patterns (internal, corona and surface).

Each unit consists of a learning and testing stage, therefore, each unit has to be trained with the corresponding dataset in order to process new input patterns. A new input pattern is going to be classified into one of two PD patterns at the outputs of a testing stage; afterwards, the voting class algorithm receives the classification results of each testing unit in order to perform a count and classify the input pattern into one of the three PD patterns.
6.3. Classification results
To construct the training dataset, a preprocessing stage was carried out in order to acquire all the set of statistical operators explained in section 5 for each type of PD. After the training process was finished, the classifiers were tested with new input patterns and they could achieve high recognition rates. Tables 2 and 3 show the results of MLP and SVM of four tests for each type of PD, in order to obtain recognition rates for input features not included in the training dataset, respectively. From Table 2, it can be observed that the highest average recognition rate is for corona discharge with a 99.9% rate, 98.31% for internal discharge and 95.31% for surface discharge. Given that a SVM is a binary classifier, it can be noted from Table 3 that recognition rates provided by the SVM are 0% or 100%, where 100% means an identified pattern. Therefore, input PD patterns are well identified by the SVM as well.


7. Conclusions
Implementation and results related to PD denoising using the Discrete wavelet transform (DWT) and PD pattern classification using artificial intelligence-based algorithms have been presented in this paper.
According to the results of filtering PD signals through the Discrete Wavelet Transform, first level of decomposition was enough to remove white noise with greater signal to noise ratio (SNR) than to higher levels of decomposition. Also, it was noted that as the number of levels increases, the distortion of the signal increases as well and, therefore, the SNR decreases.
The multilayer perceptron (MLP) neural network and the support vector machine (SVM) implemented in this work were trained and tested using PD-fingerprints as input features and both achieved high recognition rates. Since the SVM is a binary classifier, recognition rates at its outputs were provided as 0% and 100%, where 100% means an identified PD pattern. Recognition rates of more than 90% were achieved by the MLP neural network. Both algorithms were executed simultaneously in the Labview real-time application developed in this work.
Future research will consider multiple PD source classification.

