


 English (pdf)
 Article in xml format
 Article references
 Send this article by e-mail
 Cited by SciELO
  Cited by Google
  Similars in
SciELO
Similars in
SciELO  Similars in Google
 Permalink
1. Introduction
When studying the behavior of a porous medium, it is crucial to gain information about its effective transport properties (i.e., conductivity, permeability, permittivity, and diffusivity). For example, knowledge of the soil hydraulic permeability helps predict productivity in an oil well [1] or the pollutant migration toward aquifers or other water bodies [2]. The thermal conductivity of soil allows estimate the geothermal energy production efficiency [3]. Insight into the diffusivity of soot particles is key to designing metallic or ceramic porous media useful for the treatment of exhaust gases [4]. It is also relevant to know the hydrogen effective diffusivity when synthesizing materials for use in energy storage devices . A main subject of study in materials science is the relationship between transport properties and the microstructure descriptors of a porous medium (porosity (𝜙), pore diameter, connectivity, and tortuosity ((), among others). Through numerical, experimental, and analytical approaches, such as percolation theory, critical path analysis, and effective medium approximation; different mathematical expressions for these relations have been obtained (see references [6-8] for some examples). Porosity and tortuosity are among the most widely used descriptors. Conceptually, ( can be interpreted as a measurement of the geometrical complexity of a porous structure. Despite the simplicity of this concept, some authors state that tortuosity is neither understood nor consistently defined [9-11]. Carman [12] used it for the first time. He recoursed to this parameter to match his experimental permeability data with the results predicted by the analytical solution to the capillary tubes problem. In literature, four classes of ( can be found. Three of them are related to the process under study (hydraulic, electric, or diffusive tortuosity) and the fourth class is associated with the morphological properties of porous media (geometrical tortuosity). In 2013, Ghanbarian et al. [9] published a critical review of the deduction, meaning, and application field of each of these definitions. The geometrical tortuosity (𝜏𝑔)defines the relationship between the average length of the paths existing within the porous channels (〈Lg 〉) and the linear dimension of the system (L):

Some authors propose the use of the shortest pathway, or optimal path (Lopt), instead of 〈Lg 〉 (9(. However, this definition is not the most widely adopted. Experimentally, τg can be directly obtained from tomographic or micrographic image registration [13-15]; or indirectly by using some function that relates it to another microstructural descriptor. The last one is the most widely used option, and porosity is the preferable descriptor. In literature, many equations that relate τ and 𝜙 are found. Some of them are compiled by Sobieski and Lipinski [16]. The abundance of mathematical expressions is attributed to the fact that each study was carried out for particular cases of porous media, thus their application ranges are limited. Some of them are useful for 3D beds of spherical particles but cannot be used for cubic particles. Other studies apply to 2D sections of overlapping square particles but not to the non-overlapping ones. Many of these equations have a common deficiency; they predict a value of τg=0 when 𝜙 →1. Nevertheless, the geometrical tortuosity in this limit must be 1.
The lack of a predictive unified model has motivated investigations on more universal formulations. Based on the percolation theory and the finite-size scaling approach, Ghanbarian et al. [17]proposed a model that allows predict τg as a function of 𝜙 in a relatively wide range of two- and three-dimensional porous media. In this analytical model, which is described in more detail in section 2, the authors use the concepts of fractal length and dimension as well as the percolation theory and its critical exponents. They found that tortuosity follows a scaling law that gradually increases, while porosity decreases and diverges as 𝜙 approaches the percolation threshold (or critical porosity). The authors found that many of the equations relating τ and 𝜙 matched their proposal. Consequently, they could be considered within the percolation theory framework. This model has been used for predicting different transport parameters, such as effective permeability and electrical conductivity in concrete [6]; and thermal conductivity in porous alumina ceramics [6] and in materials with polyhedral porosity [7].
Using numerical methods, this work found that media with saturated, disordered, and randomly distributed pores follow a scaling law that relates these two microstructure descriptors: geometrical tortuosity and porosity. The percolation model is used for obtaining the digital representations of media with different porosities. An advanced algorithm was developed to derive tortuosity from the percolating paths that exist within the porous channels. Therefore, in addition to the average length, it is possible to obtain statistics, such as the median as well as the shortest and largest paths, which are not possible to derive using state-of-the art algorithms. The program validity is verified by comparing its results with recently published results. Moreover, the universality class to which the shortest path belongs was found. The paper is organized as follows: the analytical model presenting tortuosity as a scaling law is described in section 2. The procedure used for generating the digital images of porous media and the algorithm developed for obtaining the percolating paths are described in section 3. Section 4 presents the scaling law obtained numerically and other results, whereas section 5 reports the conclusion.
2. Percolation-based tortuosity model [17]
According to the percolation theory, the mean distance between two points in a same finite cluster of pores, or correlation length (χ), is given by the scaling law:

𝜙 c is the critical porosity, a minimum porosity value needed for the existence of a cluster of pores that spans the network from one side to another (percolating cluster). 𝜙 c depends on the type of percolation studied (bound or site, with or without trapping) and the lattice (square, cubic) [18]. For example, for site percolation in a square lattice, 𝜙 c has an accepted value of 0.5927. Similar to other percolation properties, this is an accepted value since an analytical result does not exist. The accepted values are numerically obtained. C is a fitting coefficient with an accepted magnitude of 0.85±0.4 for a square lattice [19]. ν is a critical exponent which only depends on the Euclidean dimension. Unlike 𝜙 c, ν neither depends on the type of percolation nor the type of lattice and has an exact value. For this reason, it is known as a universal exponent. Its exact value in 2D is ν=4/3.
The porous channels have a characteristic fractal configuration [17]. The total length of a fractal path (LF), constructed of steps of length ε, can be obtained from eq. (3):
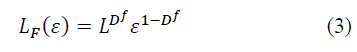
Where Df is the fractal dimension
Close to the critical porosity, ε is inversely proportional to the correlation length and eq. (3) can be written as [17]:

Taking LF (χ) as the average length of the paths, the geometrical tortuosity can be expressed as [17]:

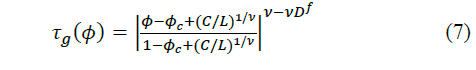
The correlation length predicted by percolation theory is only independent of the system size if χ≤L. When χ>L, eq. (2) and consequently eq. (5) must be modified to include this dependency. Ghanbarian et al. [17] proposed to use the scaling factor (C/L)1/ν.

The fact that τg=1 when 𝜙 →1 also suggests the inclusion of the factor |1- 𝜙 c+(C/L)^1/ν | in eq. (6) for ultimately obtaining the percolation-based tortuosity model
3. Numerical approximation to the tortuosity-porosity relationship
3.1 Porous media generation
The digital representations of the microstructures are obtained by randomly selecting a fraction 𝜙 of the nodes constituting a square lattice of linear dimension L (in this work an L=120 is arbitrarily selected). These nodes are turned into the mass center of a square pore with an edge equal to a lattice unit. The phase function (z(x,y)) for this system is:

Where 𝜙 is the porosity. A cluster of pores is defined as two or more mass centers that have z(x,y)=1 and occupy consecutive sites in the lattice. The control over the distribution and number of clusters is carried out by using the labeling algorithm proposed by Ramirez et al. [20]. As in real solids, there are pores in the microstructures that do not belong to the percolating cluster (occluded pores) and therefore cannot be taken into account when calculating τ.There are also blind pores that unjustifiably increase the percolating path length. Both types of pores are eliminated by doing the following transformation z(x,y)=1→0 (Fig. 1 a and b).
3.2 Algorithm for calculating tortuosity (Camper)
The algorithm, named Camper from caminos percolantes, has the objective to find as many paths as possible, but not all. The general diagram is presented in Scheme 1. Paths are found to depart from the left side of the digital representation to arrive to the right side and also in the opposite direction.
All the nodes in the lattice edges [i.e., the nodes (0,0) (0,L) and (L,0)⋯(L,L)] with z(x,y)=1 are the starting point for the search. These paths are formed by steps with an equivalent length of a lattice unit. In this case, there are four possibilities. When departing from the left side, we will have steps from (x,y) to (x,y±1), which will be cited as right (-) or left (+), or as (x±1,y), cited as forward (+) or backward (-). When departing from the right side, the signs change. The steps are preferentially taken forward provided that there are not obstacles. Obstacles are the pores walls. There are two types of pores walls in the digital representations: those that can only be evaded in one direction (to the left or right, they will be named single obstacles) and those that can be evaded in both directions (double obstacles) (Fig. 1 d). In the first case, the obstacle is bordered in the direction, in which z=1, until there is the possibility of continuing the path forward. In the second case, before bordering the pore wall a direction is randomly selected. Finally, 〈Lg 〉 is obtained after averaging the length of the different paths. Any configuration of steps with loops is rejected for the τg calculation.

Source: elaborated by the author
Figure 1 a) Digital representation of porous media with 𝜙 =0.65; the occluded pores are shown in gray. b) Lattice used for calculating 𝜏, after eliminating occluded and blind pores. c) Zoomed view of the framed region, whereby arrows indicate some blind pores. d) Arrows point out a single obstacle (only evadable to the left) and a double one (Obstacles are described in section 3.2.)

4. Results and discussion
4.1 Algorithm validation
The algorithm validity is corroborated by comparing results with those reported by Roque and Costa in 2020 [14] and Al-raoush and Madhoun in 2017 [15]. They also developed algorithms for calculating τg from image registration. From reference [14], the synthetic image called curved line is taken (see Fig. 2 a). From reference [15], the micrography of the natural media called M1, a mixed sand of silica and quartz, is taken (see Fig. 2 b). As stated in section 3.1, Camper only reads square images; for this reason, the rectangular image of M1 is cut as presented in Fig. 2 c. Both digital representations were adjusted to have a resolution of 240×240 pixels (L=240). Table 1 presents the results.

Source: adapted from references [14] and [15] with the author’s permission
Figure 2 Digital representations used for corroborating the algorithm. a) Curved line, b) Micrography of the mixed sand (M1 sample), the frame encloses the area used for the calculation. c) Zoomed view of the used area. As an example, in c) two of the paths found by the program are presented. Note how they evade the blind pores.
Table 1 Results used for validating the algorithm

a Length of the shortest percolating path or optimal path
b Median for paths
c Largest path length
d Tortuosities published in [14] and [15] and the one obtained by Camper
Source: elaborated by the author
One of the advantages of this program is the descriptive statistical analysis of the detected paths, which is not possible with the other proposals. Camper allows establish the number of paths used for calculating τg as well as the maximum and minimum lengths, and the median. In general, there is a good agreement between the tortuosities reported in literature and those calculated in this work. Particularly for M1, where the same value of tortuosity was obtained.
4.2 Detection of a scaling law
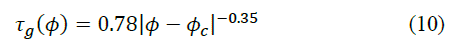
With the algorithm, τg is calculated in media with porosity from 0.63 to 0.95. Fig. 3 presents the results. This range of porosity was used because χ≤L; hence, the correlation length is independent of the size of the system and the scaling factor can be eliminated in eq. (7). However, while we are closer to 𝜙=0.63, the finite-size effects appear as greater standard deviations, which lead to greater uncertainty in the calculation of τg. Ghanbarian et al. [17] proposed to use the fractal dimension of the optimal path [21, 22] (Dopt=1.22 in 2D) as Df in eq. (7). By replacing the accepted values for 𝜙c and Dopt, the universal exponent in (7), and by solving the denominator such equation can be rewritten as:


Source: elaborated by the author
Figure 3 Relationship between the geometrical tortuosity and porosity. The circles indicate the numerically obtained results. The vertical bar represents the standard deviation. The solid line is the equation that better fits the data. The dashed line is the scaling law analytically obtained by Ghanbarian et al. (eq. 8).
This equation is presented as a dashed line in Fig. 3. The solid line is the scaling law that better fits the simulated tortuosity values and is
There is a good correlation between both equations. After solving Df from ν-νDf=-0.35, a fractal dimension value of 1.26 was found. As expected, Df>Dopt since all percolating paths, and not only the shortest one, were used for its calculation. Consequently, Df can be interpreted as an average fractal dimension. When Dopt is used in eq. (7), as Ghanbarian et al. do so, the geometrical tortuosity is obtained in terms of the Lopt/L relationship and not as the relationship between the average length of the paths and the linear dimension of the system. To adjust to the most accepted definition of tortuosity (eq. 1), the use of the average fractal dimension found in this work, instead of Dopt, is proposed. Eq. (9) fulfills τg→1 when 𝜙 →1.
4.3 Optimal path and fractal dimension
In this section, the capacity of Camper for assigning a value to the optimal path length was used. As mentioned before, when χ>L the percolation properties depend on the system dimension. It has been possible to establish that under these conditions and in the percolation threshold, the length of such path scales with its Euclidean distance, meaning that Lopt~Le Dopt. [22,23] Le is the distance between the starting point and the arrival point, Le≥L. It is proposed to obtain Dopt from the slop of the relation log10 (Lopt ) vs.log10 (Le) constructed from twelve media with𝜙=0.6 and L=10,20,…,110,120. The critical porosity(𝜙c=0.5927) could not be used because, in some cases, the program does not find a percolating path. Results are presented in Fig. 4. Despite not using 𝜙c ,the value obtained for Dopt was 1.21, which agrees adequately with the accepted value of 1.22 [21,22]. This suggests that the optimal path existing within the porous channels can be considered as in the same universality class of the geometries described by loopless compressible invasion percolation [21,22,24].

5. Conclusions
The sequence followed by the developed algorithm, i.e., removing occluded and blind pores, paths starting in different points of each media edge, steps forward, which border obstacles, and avoiding loops allows to derive a solid statistical description of the percolating paths existing within porous media. For media with saturated, disordered, and randomly distributed pores, there is a power law that relates geometrical tortuosity and porosity. The exponent of such law can be obtained from the critical exponent of the correlation length and the average fractal dimension instead of the fractal dimension of the optimal path. The fractal dimension of the optimal path that exists within this type of microstructures is in the same universality class that the Eden growth observed in tissue or bacterial cultures or the geometry of the undirected polymers.

