


 English (pdf)
 Article in xml format
 Article references
 Send this article by e-mail
 Cited by SciELO
  Cited by Google
  Similars in
SciELO
Similars in
SciELO  Similars in Google
 Permalink
1. Introduction
Fatigue in flexible pavements is one of the main causes of reduced service life. The cracking initiated in the lower part of the asphalt mixture is due to reaching a limit of the value of the specific deformation of the asphalt layer [1,2]. The damage caused by fatigue is caused by a combination of the structural design of the package used and the selection of intervening materials. In turn, it has a great impact, the thickness of the pavement that comes into play, as well as the volumetric properties of the mixture used. Within the asphalt mix, asphalt has a significant role in fatigue failure [3,4]. Studies carried out by means of fracture mechanics and microsimulation indicate that fatigue cracking initially propagates through the asphalt binder, then passing to the mix matrix.
The methodologies proposed by SHRP (Strategic Highway Research Program), such as the evaluation of the PG grade for the classification of asphalts, were useful in the 1990, but currently the advances in the studies show that several criteria do not reflect the reality of the materials. The rheological characterization of asphalts in the dynamic shear rheometer (DSR) evaluates the material in the linear viscoelastic region, both for rutting and fatigue parameters in the guidelines set by SHRP. In particular, the fatigue damage suffered by asphalt pavements is strongly influenced by the nature of the asphalt bitumen that composes it, said failure occurs outside the linear viscoelastic zone. Due to this, the traditional methods proposed by SUPERPAVE, such as G*sinδ, do not fully evaluate this problem, since the analysis carried out is absent from strain stress variations, which translate to only one load state evaluated in the rheometer [5-7].
Based on these limitations, the time sweep test in the dynamic shear rheometer is a more accurate way to quantify the fatigue in the asphalt binder. This methodology contemplates the evaluation of the complex modulus of the sample at a defined frequency, amplitude and temperature. The failure criterion of the material according to this test is proposed as a general criterion when the complex modulus drops to 50 % of the initial modulus. By repeating the procedure at different amplitudes, the relationship between the imposed deformation and the failure cycles of the material is established, which is represented by eq. (1).

Where Nf is the number of cycles to failure, γ the specific shear strain, A and B the model fit parameters that depend on the material. This test scheme and representation model is the one that is frequently used to evaluate fatigue in asphalt mixtures by means of the four-point beam.
However, despite being a proposal that surpasses the fatigue failure methodology in asphalt proposed by SUPERPAVE, the time sweep test in the DSR implies long test times for the material to be evaluated, depending on the deformation applied to the surface. sample [2]. On the other hand, it implies a test for each point of specific strain applied, resulting in many samples to be able to conform the failure curve presented above. In turn, the reduction to 50 % of the initial modulus as a material failure criterion is arbitrary since there is still less than half of the useful life of the material to be used [3].
1.1. Linear Amplitude Sweep (LAS)
In recent years, in search of an alternative to the methodologies described above, the linear amplitude sweep test has been proposed to evaluate fatigue in asphalt cements. This method considers evaluating the sample with an increasing deformation stress to simulate the state of solicitations that are generated in a pavement.
The results of the linear amplitude scan are applicable to the Simplified Theory of Viscoelastic Continuous Damage (S-VECD), [5,6,8] which models the internal work of the material and quantifies the damage by means of microstructural changes in the sample [9, 10]. Based on the study carried out by Schapery and Park [11], the damage accumulation law is reached, represented by eq. (2).

Where S is the damage growth in the sample, W the work done, t the time, and α the sample integrity parameter. This theory is recently applied to studies to predict fatigue in both asphalts and asphalt mixtures [4,9].
The sample integrity parameter α was previously estimated from the curve of relaxation modulus (G*(t)) as a function of time. To obtain it, a conversion of the G* module from the frequency domain to the time domain has to be carried out. This conversion is not used regularly due to the complexity involved in its application. To simplify obtaining α, it is possible to quantify it by means of the slope of the frequency sweep test, in which the sample is considered without damage [5]. Finally, it is expressed as α=1/m, where m is the slope of the frequency sweep test, with which the sample without damage is characterized. On the other hand, the work done by the sample can be modeled according to eq. (3).

Where W is the work done expressed as energy dissipated, γ0 the specific applied shear strain, G* the complex shear modulus and δ the phase angle. In this way, eq. (2) can be integrated numerically using eq. (3) in order to arrive at the expression for damage growth, shown in eq. (4).

Where Cj is the ratio between the modulus at each point and the initial modulus of the material without damage, γ0 is the applied shear strain, and t is time.
To quantify the damage presented by the samples during the test, the C-S damage curves are plotted, which represent the integrity of the sample as a function of the accumulated damage. Said curve can be adjusted by means of eq. (5).

Where C0 =1 and C1 and C2 are the fit coefficients of the model. Differentiating eq. (5) and substituting it into eq. (2), we can finally arrive at eq. (1), which in its extended form appears as eq. (6).

Where f is the test frequency (defined at 10 Hz), Df is the failure criterion adopted, k = 1+ (1- C2) α, and B = -2α. Based on the study carried out by Masad [12], it is considered that the specific strain provided by the asphalt represents between 12 and 90 times the specific strain of the asphalt mixture. Finally, Bahía sets this parameter at 50 times and proposes a specific shear deformation of 2,5 % for pavements greater than 10 cm and 5,0% for pavements less than 10 cm [13-15].
Several authors propose different failure criteria Df [1,2,7,9,16] to define the fatigue limit of asphalts contemplating this test. The present work proposes to consider the two most used criteria to obtain the resulting equivalent axis curves. In the first place, the drop in the value of the C-S curve by 35 % from the initial value, data that unifies the position for the evaluated binders. The second corresponds to the peak value of the shear stress exerted on the sample evaluated in the C-S curve [15].
2. Materials and methods
For the study, an asphalt cement classified by viscosity as CA-30 and recycled tire rubber powder (RTR, Fig. 1) is used as asphalt modifier. The RTR is added to the asphalt in percentages of 15 %, 20 % and 25 %, according to the particle size of the sample as can be seen in Fig. 2. The modification of the asphalts is carried out in a high-speed disperser for one hour to obtain a homogeneous sample. Base asphalt and RTR-modified asphalts are subjected to a thin-film oven (RTFO) to simulate the short-term aging conditions that occur in asphalt. Asphalts are characterized by rotational viscosity, torsional elastic recovery and softening point tests before and after aging the samples.


Source: Prepared by the author.
Figure 3 Dynamic shear rheometer (left), 8 mm geometry with the sample (right)
For the fatigue characterization of asphalts by means of the LAS test, a Discovery HR-2 Hybrid Rheometer brand DSR from TA Instruments is used. It has an ambient test chamber (ETC, for its acronym for Environmental Test Chamber) as shown in Fig. 3. To carry out the test, the geometry of parallel plates with 8 mm diameter is used, with a gap of 2 mm between them.
The LAS test is regulated by the AASHTO 101-14 standard [17,18] to characterize fatigue damage in asphalt. However, to date there is no asphalt classification specification that has incorporated this evaluation [19], as if the Multiple Stress Creep and Recovery (MSCR) test is present for the evaluation of rutting in asphalt bitumens.
The methodology includes two stages within the trial itself. The first consists of characterizing the sample by means of a frequency sweep in the range of 0,2 to 30 Hz at a specific shear strain of 0,1 %. This stage is used to characterize the material without damage. The second part lies in subjecting the sample to a state of increasing deformations. This stage is carried out at a frequency of 10 Hz and at a constant increase in specific strains from 0,1 % to 30 %. At each load cycle, the peak stress associated with the imposed strain is recorded, along with the resulting phase angle. The standardized procedure proposes the increase of deformations in a time of 310 seconds, finding in the bibliography alternatives for this load time. The test temperature at which the samples are evaluated is 20 °C, 25 °C and 30 °C.
With the data collected from the tests, the C-S curves are drawn for each of the asphalts studied and for each test temperature. Subsequently, the fatigue life curves are evaluated at the temperatures considered and, finally, a comparison is made between the two failure criteria stated for the asphalts evaluated at 20 °C.
3. Results and discusion
3.1. Damage C-S Curves
The asphalt binders used are a conventional asphalt classified by viscosity (CA-30) and three binders modified from the base asphalt with increasing rates of rubber from RTR (15%RTR, 20%RTR and 25%RTR). Table 1 shows the properties of the asphalts used.
Table 1 Characterization of the asphalts used

S.P.: Softening Point
TER: torsional elastic recovery
Source: Prepared by the author

After aging the asphalts in the RTFO, the LAS test is carried out in the DSR. Through the previously performed analysis, the parameters of the model are calculated according to the S-VECD to evaluate the coefficient α of integrity of the material and the coefficients C1 and C2 of the damage curve. Table 2 shows the tests at 20 °C, 25 °C and 30 °C below.
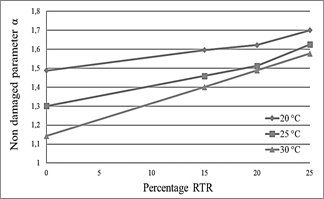
In the first instance, an analysis of the alpha parameter is carried out, which indicates the integrity of the sample without damaging it. Said parameter strongly depends on the stiffness of the sample, increasing the value of α when the stiffness increases. Therefore, the value of α shows a first indication of fatigue resistance of the samples, increasing with the increase of RTR as can be seen in Fig. 4.
With the adjustment parameters found, the C-S curves of material integrity are plotted as a function of the accumulated damage. Figs. 5-7 show the curves for 20 °C, 25 °C and 30 °C, respectively. For the three temperatures, it can be seen in the graphs that the asphalts modified with RTR maintain a greater integrity of the material for damage intensities greater than 50. In the same way, a superior performance is evidenced when the percentage of incorporation of RTR increases, although in a less pronounced. It can also be shown that the asphalts with RTR have a 60 % material life based on the damage intensity limit value for the unmodified asphalt, for the evaluations at 20 °C.


3.2. Fatigue laws
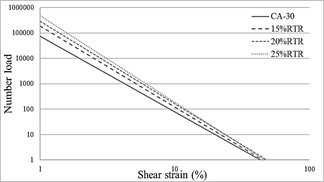
From the developed C-S graphs, the models are assembled to estimate the fatigue life based on the maximum specific deformation of the material and the failure criterion adopted for its evaluation. In the first instance, these curves are evaluated with the 35 % reduction of the initial integrity to develop the model seen in eq. (1). As can be seen, in principle, for 20 °C there is a considerable benefit from the incorporation of RTR as shown. see in Figs. 8-10.
3.3. Comparison between failure criteria contemplated
As previously mentioned, based on the tests carried out, the comparison between failure criteria is proposed to obtain the fatigue life curves. With the curves already exposed with a failure criterion of reduction of 35 % of the initial integrity, the fatigue life curves are formed with the criterion of the maximum shear stress peak, together with its corresponding value in the C-S curve. Fig. 11 shows comparatively the asphalts evaluated at 20 °C and with an applied deformation of 2,5 %.
The graph at 25 °C follows the same trend, however, a difference is evident between the different proportions of rubber incorporated. The fatigue phenomenon manifests itself at intermediate temperatures (approximately 10 °C - 30 °C).

Source: Prepared by the author.
Figure 8 Fatigue life at 20 °C for the asphalts evaluated with Df = 35% damage.
Source: Prepared by the author.
Figure 9 Fatigue life at 25 °C for the asphalts evaluated with Df = 35% damage.

Source: Prepared by the author.
Figure 10 Fatigue life at 30 °C for the asphalts evaluated with Df = 35% damage.

Source: Prepared by the author.
Figure 11 Fatigue life at 20 °C for different failure criteria (2,5 % shear strain)
Therefore, as it is tested at a higher temperature, improvements in performance are evidenced and, in turn, materials with a higher degree of modification present better performance. In this last graph you can see an improvement in the incorporation of 25 % compared to the other alternatives.
As can be seen, there is a significant difference between the proposed criteria, a gap that widens with the growth of RTR incorporation. On the other hand, the 35 % criterion, although it is conservative, and is not something minor when evaluating fatigue in pavements, is a fixed criterion for all types of asphalt. In this way, for asphalts modified with RTR, the life of the material is being underestimated, since it is considered to be in a state of failure, when its remaining life is considerable. The criterion of reduction of an initial value is equivalent to the criterion of the reduction of 50 % of the initial modulus to evaluate asphalt mixtures by means of the fatigue beam at four points. As previously mentioned, these criteria are being questioned due to the randomness when it comes to pinpointing a material failure point.
On the other hand, although the life data considering the peak shear stress are much higher than those evaluated by the 35% reduction, it is a criterion that reveals the variation of the failure point of the material and that overestimates the useful life of the material.

Source: Prepared by the author.
Figure 12 Shear stress as a function of the specific deformation at 20°C.
As can be seen in Fig. 12, despite obtaining a higher peak stress, the CA-30 sample reaches this value prematurely and falls sharply compared to asphalts with RTR. The modified asphalts show a more stable curve as the percentage of RTR increases. Said effect is contemplated in the C-S curves that evaluate the internal work carried out by the material. On the other hand, the displacement of the stress peaks in the samples translates into large displacements in the C-S curves. Finally, this has a considerable effect when evaluating the number of axes considered to be fatigued.
4. Conclusions
In the present work, the characterization of four asphalts (one conventional and three modified with increasing contents of recycled tire rubber) aged in the rotary thin-film oven is carried out, by means of the fatigue test in a dynamic shear rheometer, known as sweep of linear amplitude, at 20 °C, 25 °C and 30 °C. This test allows to print a considerable damage to the samples, applying deformations of up to 30 %, effectively leading to fatigue. The test methodology is consistent with the simplified theory of continuous viscoelastic damage and allows modeling the C-S curves (Cumulative Damage versus Material Integrity) and the fatigue life curves to estimate the number of axes that the material is capable of resisting (Nf).
For the preparation of these curves, two commonly used failure criteria were studied. On the one hand, the damage corresponding to a 35 % drop in the damage curve, and on the other hand, the value of the damage curve resulting from the shear stress peak during the test. This last criterion converges to fatigue life results that allow evaluating the material with a higher performance than that considered by the 35 % reduction of the C-S curve.

