1. Introduction
When discussing project performance management, the first thing that comes to mind is measuring [1] the project objectives. From a traditional vision, the iron triangle has been used by many authors [2-7], associated with the objectives of the project time (related to schedule), cost (related with budget) and quality, which is widely used to measure the performance of projects, although these three indicators are not enough to evaluate complex projects [8], for which other key performance indicators are analyzed to assess the success of the projects.
However, in the construction industry, one of the factors that can influence the performance of the iron triangle is related to the maturity in project management [2]. Additionally, the complexity of construction projects can cause conflicts that project stakeholders can hardly foresee, and that cause schedule delays and cost overruns [9].
Therefore, the planning and control of projects [10], which include monitoring and evaluation [11], play an essential role in achieving the project's objectives.
Despite the above, previous studies indicate that only 2.5% of companies complete 100% of their projects and that in construction, less than a third of the executed projects are completed with less than 10%. Delay and only a quarter of the projects have cost overruns lower than budgeted [12]. In 2021, the annual survey of the Project Management Institute (PMI), known as Pulse of the Profession [13], showed that for projects in the construction industry, 40% of projects end with cost overruns, and 43% of projects are delayed versus planned schedules.
For this reason, the present investigation analyzed construction projects' challenges and opportunities from a systematic literature review, which made it possible to identify the critical success factors and key performance indicators to measure the fulfillment of projects’ objectives. In addition to identifying some of the most common causes that cause delays and cost overruns, as well as identifying some valuable tools and techniques to manage the performance of construction projects.
The main contribution of the present investigation was focused on identifying the state of the art in the last five (5) years in the management of the performance of construction projects to determine the themes that other authors are studying, which was carried out through a bibliometric analysis.
Finally, it is worth noting that there are other bibliometric analyzes and literature reviews on project management, project performance management, and construction. However, the present investigation provides a deep analysis of data on this topic in the last five articles of high scientific quality.
2. Literature review
Before beginning the discernment about the common causes of delays and cost overruns, critical success factors, key performance indicators, valuable techniques and tools to manage project performance, it is essential to define project performance management, which is Related to developing a set of activities to obtain unique products, services or results that meet the objectives set by the project stakeholders, to determine the success or failure of these initiatives [14].
In this regard, the performance of the projects is related to the interactions that occur between the management of time, costs, quality, scope, risks, human resources, and customer satisfaction, among other variables, to aim to obtain good performance and success in projects [15], for which the iron triangle is proper since it allows a balance between time, cost and quality [16].
2.1. Concerns managing the performance of construction projects
When reviewing the problems that arise in the performance of construction projects, delays, cost overruns, low productivity, and conflicts were evidenced, which affect the fulfillment of the objectives of the projects.
Common root causes of construction project delays and conflicts include owner financial issues, change orders, project scope variances, and communication and relationship breakdowns among project stakeholders [17].
Other studies refer that changes, weather, conditions of the site where the project is carried out, late supplies, economic conditions, and the increase in quantities cause delays during construction [18], which is why they are factors that contractors and owners should take into account during the life cycle of the project, to mitigate the possible impacts that these events could represent for the objectives of the project, among many other causes that could impact the performance of construction projects.
2.2. Critical success factors and key performance indicators
Those interested in effectively managing construction projects should consider Critical Success Factors (CSF) to achieve the planned objectives. When observing the CSF's influence on construction projects, the authors found that the factors that can affect these projects are the implementation of project management, procedures, commitment to construction methods, contractors, and human resources [19].
From another perspective to evaluate the CSF is using project delivery methods, where common or traditional delivery methods can be mentioned, among which are Design - Bid - Build (DBB), Design - Build (DB), and Construction Management at Risk (CMR), as well as the Build - Operate - Transfer (BOT) and Public-Private Partnerships (APP) [20].
Similarly, the success factors for managing megaprojects can be categorized from the project environment, construction capabilities, organization, positive culture, behavior, and the requirements for sustainable development [21]. Also, project success can be measured through cost performance indicators, schedule, quality, team satisfaction, customer satisfaction, productivity, profitability, safety, and environment [22]. But also, positive impacts can be obtained through the implementation of information and communication technologies [23].
Based on the above, there are many ways to categorize and measure the success of projects. However, for construction companies, the key indicators to evaluate the performance of the projects are related to time, costs, quality, and understanding of the work (scope) [24].
2.3. Techniques and tools for project performance management
For several decades, one of the most used techniques for project control has been known as Earned Value Management (EVM) or earned value management since it integrates the cost and schedule of the scope planned to execute a project [25, 26]. However, the EVM should be complemented with other techniques since the EVM focuses on knowing the status of a project in terms of financial performance without taking into account the possible impact on the time that could occur due to time variations, which is helpful for the Earned Schedule (ES), which integrates efficiently with the EVM since it uses the same data to generate the schedule performance index based on time [27,28].
However, considering that the performance of construction projects is linked to the level of maturity in project management, an organization has to use tools and techniques to measure the maturity of design and project definition, such as the Front End Engineering Design (FEED), which allows ensuring the level of confidence and precision in cost and time estimates [29], based on the maturity of engineering, or with the evaluation of the Project Definition Rating Index (PDRI), which allows determining the level of definition of a project, which allows estimating costs and times more precisely [30].
On the other hand, the project schedule plays a critical role in project management, which is why it is necessary to ensure the quality of the schedule, for which guides and standards can be used, on which widely recognized institutions, among which found the Government Accountability Office (GAO), the Project Management Institute (PMI) and the Association for Advancement of Cost Engineering (AACE) International [31], as well as the evaluation of 14 quality checkpoints of the Defense Contract schedule. Management Agency (DCMA) [32].
Meanwhile, for the budget of the projects, it is crucial to use conceptual and detailed cost estimation methodologies, with which more accurate cost estimates could be obtained [33]. In this sense, the recommended practices 17R-97 and 18R-97 of the AACE are two of the most widely used guides worldwide to determine the classification of cost estimates for engineering, procurement, and construction projects for process industries [34, 35].
2.4. Other useful emerging techniques and tools for project performance management
Although many techniques and tools are used for project planning and control, digital transformation and Industry 4.0 have increased project management teams' options to manage project performance.
In this sense, Building Information Modeling (BIM) [36], Artificial Neural Networks (ANM) [37], Machine Learning, and Analytical Networks [38], among other emerging tools and techniques for improving project performance.
3. Methodology
3.1. Planning
In this first stage, the bibliometric analysis is prepared, for which the scientific databases Scopus and Web of Science (WoS) were selected as inputs in the search for information, considering suggestions of other authors for mitigating limitations suffered using only one database for research about a topic [39]. Bibliometric technological tools such as VOSviewer, Vantage Point, and R Biblioshiny - bibliometrix were also used. In addition, the authors used Mendeley reference manager to guarantee the quality of the citation and referencing.
In fact, bibliometric analysis has gained recognition to identify and analyze literature on different topics but is important that authors review and clean the data obtained through Scopus and WoS because it can present errors [40], a situation that generates unreliable results. Even so, the bibliometric analyses are valuable because the importance of literacy is growing day to day, having impacts on methodologies, and contextual and theoretical approaches [41].
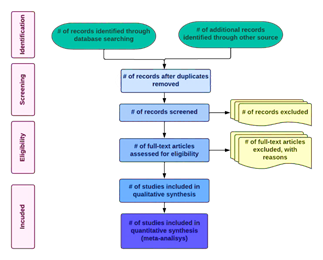
The process of inclusion and exclusion took place according to the Prisma Protocol [42]. Fig. 1 presents the research protocol, which resulted in 277 articles published from 2019 to 2023 in the SLR sample. Below is showed the descriptive analysis and the main thematic groups identified, along with their respective key contributions:
To complement the methodology presented above, the authors used the method of [43] to carry out this study, which consists of the planning, conducting the review, and reporting stages.
3.2. Conducting the review
The research needs to raise the research questions of the identified work. In addition, a search strategy was designed using Boolean accuracy operators such as quotation marks; for the breadth of information criterion, the asterisk sign and the OR operator were applied. Finally, the word AND was an exclusion criterion to specify the search for information. Below is showed the research equation used in this study:
("Project management" OR "construction management") AND ("project performance" OR "performance measurement management" OR "PMB" OR "performance measurement baseline" OR "earned value" OR "EVA" OR "EVM" OR "EVMS" OR "Critical success factor*" OR "CSF" OR "project control" OR "project planning" OR "baseline" OR "Measurement method*") AND ("construction" OR "megaproject" OR "construction project*") ("schedule" OR "delay" OR "time overrun*" OR "time forecasting" OR "slippage" OR "cost forecasting" OR "cost*" OR "cost overrun*" OR "cash variation" OR "iron triangle" OR "triple constraint*" OR "claim*" OR "conflict*" OR "dispute*" OR "controversy" OR "contract*" OR "change order*" OR "change management" OR "scope creep" OR "risk*").
3.3. Review and exclusions
In the databases, the search was directed to only articles categorized in journals in quartiles 1 and 2 (Q1-Q2), limiting the exploration to the main structure of the documents: title, abstract, and keywords. Then, the authors filtered articles from 2019 through 2023 in business and administration, environmental, and engineering categories.
AND (LIMIT-TO (PUBYEAR,2023) OR LIMIT-TO (PUBYEAR,2022) OR LIMIT-TO (PUBYEAR,2021) OR LIMIT-TO (PUBYEAR,2020) OR LIMIT-TO (PUBYEAR,2019)) AND (LIMIT-TO (DOCTYPE,"ar")) AND (LIMIT-TO (SUBJAREA,"ENGI") OR LIMIT-TO (SUBJAREA,"BUSI") OR LIMIT-TO (SUBJAREA,"COMP") OR LIMIT-TO (SUBJAREA,"ENER") OR LIMIT-TO (SUBJAREA,"ENVI") OR LIMIT-TO (SUBJAREA,"ECON" ))
3.4. Conduct of review and eligibility
As a result of applying all the search criteria, the Scopus database yielded 145 documents and 183 in WoS, for a total of 328 articles. Using the Vantage Point and RStudio software, the union and decantation of the information were carried out, identifying 51 duplicate documents, and being excluded from the process for a result of 277 articles, the primary input of the bibliometric analysis. Fig. 2 presents the methodological phases of the review outlined above.
For the bibliometric analysis, the tools listed in Table 1 were used.
Table 1 Software tools
| No | Software | Use | Results |
|---|---|---|---|
| 1 | Biblioshiny in R | Information cleaning, duplicate identification, information visualization Information display | Trend chart, magazine publishing, keyword analysis Thematic Map Collaboration WorldMap |
| 2 | Vantage Point | Geographic map, research cluster, relationship between countries with keywords, journals, keyword analysis. | |
| 3 | Vos Viewer | Visualization of the information | Co-currency and keyword density graph |
Source: Own creation
4. Results
4.1. Overview
Before starting with the bibliographic analysis, describing how the data is structured is essential. Fig. 3 contains 277 articles taken from 79 sources, with the participation of 732 authors, among which a percentage of 17.69% international co-authorship, with an average of 3.16 documents per author and 2.05 documents per year. The average annual citation presented a decrease equivalent to -13.49%.
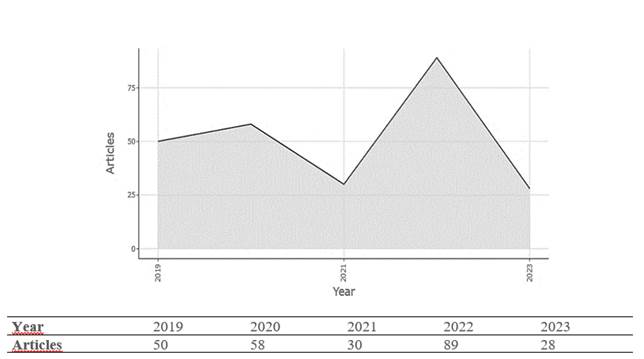
Even though the data analysis shows a reduction in research in 2023, it is worth mentioning that at the date of preparation of this research article, only a third of the year had passed, so when performing extrapolation, it was projected that this year more investigations would be written than in the last five years.
4.2. Production and research collaboration by author
Fig. 4 presents the historical trend of the number of publications; in 2022, there was a peak of 89 documents, with an increase of 197% compared to the previous period, where 30 papers were presented. Currently, the number reported by the two databases is 28 articles.
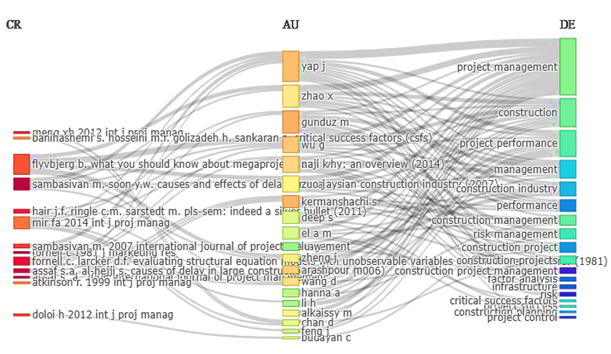
In accordance with the previous figures, among the authors with the greatest production, Yap J. stands out and has published on the topics of project management, construction, project performance, management, and the construction industry, among others. On the other hand, there is Zhao X. contributed to the lines of project management, construction, project performance, management, construction industry. Other authors on the list include Gunduz M., Wu G., Naji K., Zuo J., Kermanshachi S., and Deep S., as shown in Fig. 5.
4.3. Main countries that research the mentioned topics
Fig. 6 illustrates the worldwide geographical distribution of the articles according to the number of investigations; the intensity of the red color represents a relevant number of publications. Taking the five major countries in research as criteria, it can be said that China is the research leader with 63 documents, followed by the United States (47), in third place Australia (41), the United Kingdom (27), and finally, Malaysia (23).
In this investigation, it was verified that Colombia presents a gap versus other countries since no research related to performance management in construction projects was found, which represents an opportunity for the present investigation to produce and socialize knowledge in South America since only in Brazil, Chile, and Ecuador is research on this subject.
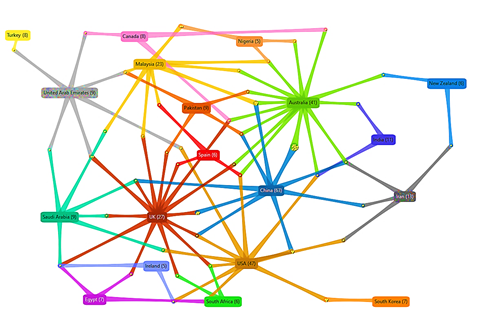
However, although China is the research leader, it is not the primary research network. Fig. 7 illustrates the main research clusters where Australia is the most relevant country according to the number of nodes doing research in partnership with New Zealand, India, Iran, the United States, China, Spain, the United Kingdom, Malaysia, Pakistan, and Nigeria.
4.4 How can keywords be related to current research trends?
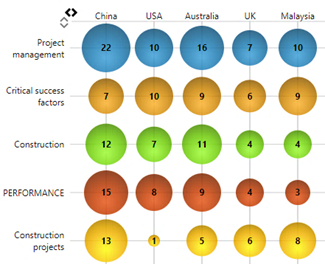
According to the relationship between countries and keywords, the Fig. 8 of bubbles presents project management as the most used word in China with 22 records, along with construction (12), performance (15), and construction projects (13). On the other hand, critical success factors are the most widely used in the United States (10).
In this order of ideas and studying the relationship between the keywords, Fig. 9 presents project management in the center and with the most significant node as the most relevant. This word is more closely related to construction and construction management.
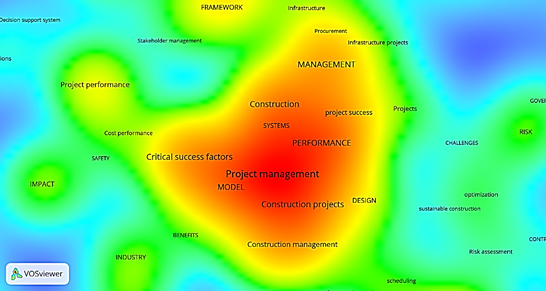
By identifying this relevant correlation mentioned above and intending to expand the analysis, Fig. 10 shows the research density map, presenting new trends in research related to critical success factors, model, performance, design, and system.
Source: Own creation using Vantage Point Software
Figure 8 Relationship between countries and keywords
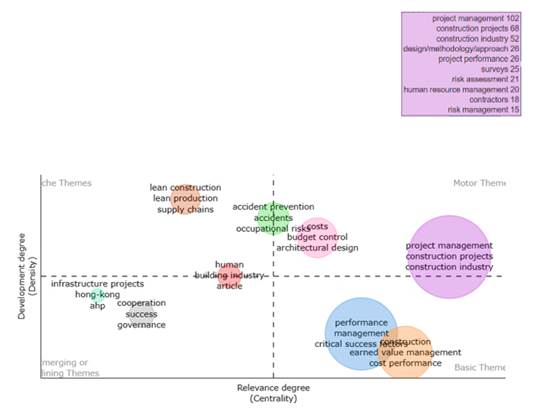
Regarding the analysis of the conceptual structure, Fig. 11 presents in the Emerging Themes quadrant the conformation of 3 clusters that contain the keywords infrastructure projects, Hong-Kong, AHP, cooperation, success, governance, human, building industry, article, where cooperation and success present the highest production with six articles, followed by governance, human and infrastructure project with five products each. The rest participate with production equal to or less than four articles. The Basic Topics quadrant is made up of two clusters that contain the performance of the keywords (42 articles), construction (38), management (36), critical success factors (27), and model (27), among other terms with a production of less than 20. articles. The Niche Themes quadrant shows the formation of two clusters made up of the keyword’s accident prevention (6), accident and occupational risk (4), lean construction, lean production, and supply chains (3), among others with less production. Finally, in the Motor Themes quadrant, two clusters are formed, the first made up of the keywords cost (11), Budget control (9), architectural design, integrated project deliveries, risk perception, and value engineering (4), among others; and the second for project management (102), construction project (68), construction industry (52), design/methodology/approach and project performance (26), among others. In this order of ideas, the cluster of the term project management has the most significant impact.
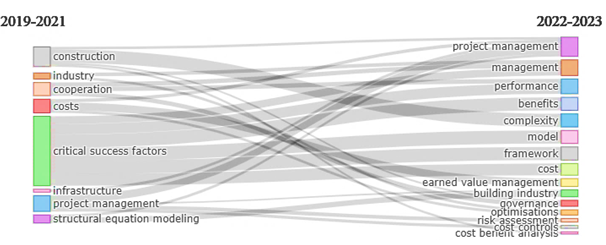
A vision of the behavior of these keywords is represented by Fig. 12, which reflects the evolution of the theme between the periods 2019 to 2021 and 2022 to 2023. The pieces worked on in the first interval correspond to construction, industry, cooperation, cost, critical success factors, infrastructure, project management, and structural equation modeling. The second interval comprises 15 keywords: project management, management, performance, benefits, complexity, model, framework, cost, earned value management, building industry, governance, optimizations, risk assessment, cost controls, and cost-benefit standout. Analysis. It should be noted that the term with the most significant influence on project management is a topic that has received a considerable impact from construction, costs, infrastructure, project management, and structural equation modeling.
Finally, in the last three years, previous research evidenced emergent tools and techniques associated with Industry 4.0 could help improve the performance management of construction projects as shown in Fig. 13:
5. Conclusions and discussion
Project performance management is essential to ensure full compliance with the objectives and activities assigned to such projects. However, some problems can truncate the scope of these objectives. Such is the case of delays, cost overruns, low productivity, and conflicts.
This situation describes how project managers or those responsible for achieving objectives must consider Critical Success Factors (CSF). Possible causes of these situations are financial problems, change orders and variations in the scope of the project, communication failures, and relationships between project stakeholders. Monitoring, controlling, and evaluating these variables requires the necessary techniques or tools to guarantee project performance management. Among the most widely used methods, Earned Value Management (EVM) or earned value management, Front End Engineering Design (FEED), and Project Definition Rating Index (PDRI) stand out. However, other useful emerging tools such as Building Information Modeling (BIM), Artificial Neural Networks (RNA), Machine Learning, and Network Analytics, among other emerging tools and techniques that could improve project performance, can be considered. Some of the institutions that address this issue include the Government Accountability Office (GAO), the Project Management Institute (PMI), and the Association for Advancement of Cost Engineering (AACE).
The bibliometric analysis was carried out to review and analyze the scientific production to project performance management in the construction industry, where the authors found an annual average of 51 products between the years 2019 and 2023, with the highest output for the year 2022 (89), a period in which the countries with the highest participation were China (63), the United States (47), Australia (41), and the United Kingdom (27).
The terms with the highest co-occurrence and production were project management, construction project, and construction industry, constituting the driving themes that drive the lines of research currently related to the subject addressed in the present study.


