English (pdf)
 Article in xml format
 Article references
 Send this article by e-mail
 Cited by SciELO
  Cited by Google
  Similars in
SciELO
Similars in
SciELO  Similars in Google
 Permalink
Introduction
Overweight and obesity in adults from developing countries have become an epidemic as a result of the adoption of unhealthy eating habits and sedentary lifestyles typical of developed countries, where both conditions are already a public health concern.1 According to the World Health Organization (WHO),2 in 2016 more than 1.9 billion adults (≥18 years) were overweight worldwide, and more than 650 million of them were obese, which means that about 13% of the world's adult population was obese at that time, with a higher prevalence in women (15%) than in men (11%). WHO2 also states that the global prevalence of obesity nearly tripled between 1975 and 2016, going from 4% to more than 18%. Considering these data, proper nutrition should be promoted as it contributes to the maintenance of a healthy weight and enhances physical and mental health and well-being.3
The severity of this epidemic is related to the multiple complications derived from obesity, which can be cardiovascular (hypertension, dyslipidemia and coronary heart disease), endocrine (type 2 diabetes mellitus, metabolic syndrome and polycystic ovary syndrome), gastrointestinal (hepatic steatosis, cholelithiasis and irritable bowel syndrome), respiratory (bronchial asthma and sleep apnea-hypopnea syndrome), neurological, dermatological, and orthopedic.1
In Colombia, this public health issue is worrisome since, according to the 2015 National Nutritional Situation Survey (ENSIN),4 more than half of the adult population is overweight or obese (Ov/Ob) (56.5%), with overweight (37.8%) being higher than obesity (18.7%). The 2015 ENSIN also evidences that men and people between 18 and 24 years of age have a lower risk of obesity, and that there is a tendency for this risk to increase as the wealth quintile increases.5
Overweight and obesity increase the frequency of absenteeism, the former in the short and medium term and the latter in the long term.6-8In view of this situation, various research studies have been carried out around the world on the subject. For example, in Latin America, cross-sectional studies have been carried out in public and/or private companies finding that having a basic or high school education and being aged ≥40 years9 are risk factors for obesity, while being a woman and being between 20 and 29 years old are protective factors.10
In Colombia, Guillén et al.11 conducted a study in 2005 involving administrative workers at the Universidad Nacional de Colombia, Bogotá Campus, in which they found that 43.7% of the participants were overweight or obese. In turn, Chaparro-Díaz et al.,12 in the same institution but in a study that included participants from the entire university community (tutor, professors, staff, and students) of the Orinoco Campus, found that the average abdominal perimeter was 95.79cm for men and 85.73cm for women, indicating the presence of abdominal obesity and a risk factor for type 2 diabetes, hypertension, and cardiovascular disease.
Considering that there are not enough studies in Colombia that evaluate the factors associated with Ov/Ob in the workplace, and in order to guide the implementation of actions aimed at health promotion by the Welfare Department of the Universidad Nacional de Colombia, the objective of this research was to characterize nutritional status and cardiovascular risk in workers of the Universidad Nacional de Colombia, Bogotá Campus, and to determine the factors associated with the presence of Ov/Ob in this population.
Materials and methods
Study type and population
Cross-sectional study. The study population consisted of 1 409 employees (non-teaching staff) of the Universidad Nacional de Colombia, Bogotá Campus, who were invited to participate voluntarily in the research. The final sample, which was obtained by convenience sampling, comprised 131 people who had to meet two inclusion criteria: being 18 years of age or older and signing the informed consent form. Pregnant women and people with physical limitations that altered their body composition were excluded.
Procedures
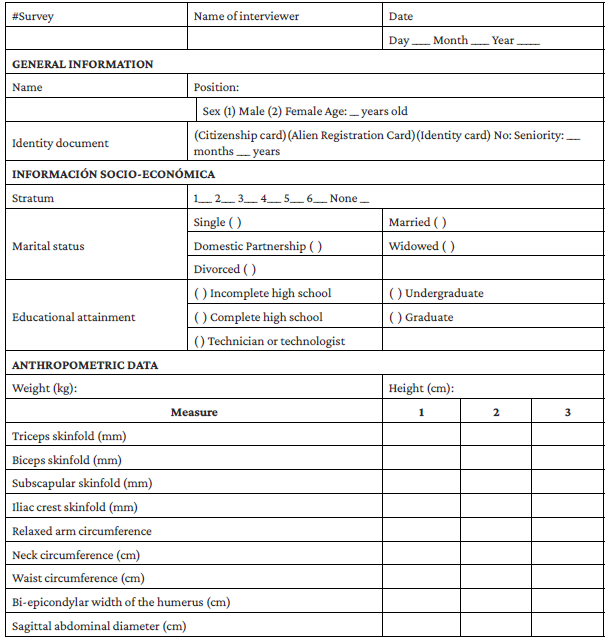
The following anthropometric measurements were taken for each participant: weight; height; triceps, biceps, subscapular, and iliac crest skinfolds; arm, neck, and waist circumferences; and sagittal abdominal diameter. The measurements were taken with the support of students from the Nutrition and Dietetics program, who were trained in the anthropometry technique according to the ISAK13 protocol and under the guidance of an ISAK 2 certified teacher.
The following instruments were used to obtain measurements: Tanita scale with 100g accuracy and Tanita height rod, Slim Guide adipometer, CESCORF anthropometric tape measure, and Martin and Lafayette anthropometric calipers, with an accuracy of 1mm.
Participants were contacted via e-mail, telephone, or visited at the workplace to make an appointment for the interview and take anthropometric measurements at the university's Anthropometry Laboratory.
An instrument developed by the research group was used for data collection (Annex 1), including questions on general details (sex and age), socioeconomic information (marital status and socioeconomic stratum [Table 1]), educational attainment (incomplete high school, complete high school, technical or technological degree, undergraduate degree, and graduate degree), tenure at the institution (<10 years, 10-19 years, 20-29 years, and >30 years), occupation, and anthropometric measurements. Said instrument was validated through a pilot test in which the number of times each anthropometric measurement had to be taken was adjusted. Data were collected between August 2017 and July 2018.
Table 1 Socioeconomic strata in Colombia according to the National Administrative Department of Statistics.
| Stratum | Description |
|---|---|
| 1 | Low-Low. Beneficiaries of home utility subsidies. |
| 2 | Low. Beneficiaries of home utility subsidies. |
| 3 | Low-Middle. Beneficiaries of home utility subsidies. |
| 4 | Middle. They are not beneficiaries of subsidies, nor do they pay surcharges; they pay exactly the amount that the company defines as the cost for providing home utilities. |
| 5 | Middle-High. They pay surcharges (contribution) on the value of home utilities. |
| 6 | High. They pay surcharges (contribution) on the value of home utilities. |
Source: Own elaboration based on DANE reports.14
The occupation of the workers was categorized in accordance with the current version of the International Labour Organization's International Standard Classification of Occupations (ISCO-08)15 into directors and managers; scientific and intellectual professionals; technicians and associate professionals; clerical support workers; craft and related trades workers; plant and machine operators and assemblers; and elementary occupations. In order to analyze the risk of Ov/Ob, occupations were reclassified into two categories (operational and clerical/managerial), taking into account the duties of the position held by the worker.
Based on the weight and height of each participant, body mass index (BMI) (kg/m2) was calculated and classified into thin (<18.5), normal (18.5-24.9), overweight (25-29.9), and obese (>30), in accordance with national standards for adults aged 18 to 64 years.16,17The analysis of the risk of Ov/Ob was done by pooling overweight with obesity.
Body composition was determined by fractionation of fat mass and muscle mass components. To determine the percentage of fat, body density was first calculated with the Durnin and Womersley equation: D=(C-Mxlog10S 4 skinfolds), using the C and M coefficients of the sum of the four skinfolds (biceps, triceps, subscapular and iliac crest). Then, density was replaced in the Siri formula (% body fat=[(4. 95/density)-4.5]x100), and the results were interpreted in terms of underweight, normal, overweight, and obese. 18
Muscle mass was estimated from mid-upper arm circumference (MUAC), using arm circumference (AC) and triceps skinfold (TSF), by means of the formula MUAC(cm)=AC(cm)-(0.31xTSFmm). Results were classified into three categories: deficit (<P25), normal (P25-P75), and elevated (>P75).19 Likewise, AC was used to classify arm muscle area into three categories: deficit (<P25), normal (P25-P75), and elevated (>P75).20
Lean mass index (LMI) was also calculated from the ratio of fat-free mass (kg) to height squared by sex, so it should be <17 kg/m2 for men and <15 kg/m2 for women.19
The risk of cardiovascular disease and abdominal obesity was determined based on waist circumference and sagittal abdominal diameter, and indirectly on neck circumference. The cut-off points for waist circumference were >90cm in men and >80cm in women;16 for sagittal abdominal diameter, >20.5cm in men and >19.3cm in women;21 and for neck circumference, >39cm in men and >35cm in women.22
Statistical analysis
Data were entered and tabulated in Microsoft® Excel. Qualitative variables were analyzed descriptively using absolute frequencies and percentages for categorical variables and means and standard deviations for the continuous quantitative variable "age". To determine the association between the independent variables (sociodemographic, economic and occupational factors) and the dependent variable (presence of Ov/Ob), a bivariate analysis was performed using Pearson's chi-square test for nominal qualitative variables and linear trend chi-square for ordinal variables, calculating prevalence ratios (PR) with their respective 95% confidence intervals (95%CI); a significance level of p=0.05 was considered. These calculations were performed using the statistical software Epidat 3.1.
Ethical considerations
The study, which was approved by the Ethics Committee of the Faculty of Medicine of the Universidad Nacional de Colombia, as per Minutes No. 016-244-17 of October 26, 2017, took into account the ethical principles for research involving human subjects established in the Declaration of Helsinki23 and the provisions on health research contained in Resolution 8430 of 1993 of the Colombian Ministry of Health.24 Likewise, during the research, participants' data were protected and anonymity was guaranteed, as well as their exclusive use for this research. Informed consent was obtained from all participants.
Results
The mean age of the participants was 46.6 years (SD±9.01), with a range between 24 and 69 years, and 72.52% were between 40 and 60 years old, 51.91% were women, 51.15% belonged to the lower-middle stratum, and 30.53% had technical/technological training. Regarding their work relationship with the university, 24.43% held mid-level technical and professional positions, and 34.35% had less than 10 years of seniority in the institution (Table 2).
Table 2 Characteristics of workers at the Bogotá Campus of the Universidad Nacional de Colombia (n=131). 2017-2018.
| Characteristics | n | % | |
|---|---|---|---|
| Sex | Female | 68 | 51.91 |
| Male | 63 | 48.09 | |
| Age (years) | <30 | 6 | 4.58 |
| 30-39 | 25 | 19.08 | |
| 40-49 | 42 | 32.06 | |
| 50 a 59 | 53 | 40.46 | |
| ≥60 | 5 | 3.82 | |
| Educational attainment | Completed high school | 19 | 14.50 |
| Incomplete high school | 10 | 7.63 | |
| Technician or technologist | 40 | 30.53 | |
| Undergraduate degree | 29 | 22.14 | |
| Graduate degree | 33 | 25.19 | |
| Stratum | 1. Low-low | 1 | 0.76 |
| 2. Low | 38 | 29.01 | |
| 3. Medium-low | 67 | 51.15 | |
| 4. Medium | 24 | 18.32 | |
| 5. Medium-high | 1 | 0.76 | |
| Marital status | Married | 58 | 44.27 |
| Divorced | 11 | 8.40 | |
| Single | 30 | 22.90 | |
| Domestic Partnership | 31 | 23.66 | |
| Widowed | 1 | 0.76 | |
| Directors and managers | 4 | 3.05 | |
| Scientific and intellectual professionals | 28 | 21.37 | |
| Technicians and associate professionals | 32 | 24.43 | |
| Occupation (CIUO-08) | Clerical support workers | 22 | 16.79 |
| Craft and related trades workers | 21 | 16.03 | |
| Plant and machine operators and assemblers | 16 | 12.21 | |
| Elementary occupations | 8 | 6.11 | |
| <10 | 45 | 34.35 | |
| Tenure with the institution (years) | 10-19 | 37 | 28.24 |
| 20-29 | 33 | 25.19 | |
| ≥30 | 16 | 12.21 | |
Source: Own elaboration.
Regarding nutritional status (according to BMI), 62.59% had some malnutrition problem and the most frequent were overweight (44.27) and obesity (17.56%). In other words, 61.83% of the participants had Ov/Ob, this prevalence being higher in men (68.25% vs. 55.88%); however, it should be noted that although the prevalence of overweight was much higher in men (53.97% vs. 35.29%), in the case of obesity, it was slightly higher in women (20.59% vs. 20.59%). Regarding body composition, 85.50% of the respondents had excess fat mass as per the Siri formula, of which almost all (95.59%) were women, and 87.02% presented with high risk of sarcopenia assessed by the lean mass index, of which the vast majority (95.24%) were men. Cardiovascular risk as measured by waist circumference was 61.83%, with similar risk among men and women (Table 3).
Table 3 Classification of nutritional status among workers of the Universidad Nacional de Colombia, Bogotá Campus, using anthropometric indicators. 2017-2018.
| Indicator | Male | Female | Total | ||||
|---|---|---|---|---|---|---|---|
| n | % | n | % | n | % | ||
| Total | 63 | 48.09 | 68 | 51.91 | 131 | 100 | |
| Body mass index (kg/m2) | Thinness | 1 | 1.59 | 0 | 0.00 | 1 | 0.76 |
| Normal | 19 | 30.16 | 30 | 44.12 | 49 | 37.40 | |
| Overweight | 34 | 53.97 | 24 | 35.29 | 58 | 44.27 | |
| Obesity | 9 | 14.29 | 14 | 20.59 | 23 | 17.56 | |
| Percentage of fat (% fat Siri) | Low | 2 | 3.17 | 0 | 0.00 | 2 | 1.53 |
| Normal | 14 | 22.22 | 3 | 4.41 | 17 | 12.98 | |
| Overweight | 23 | 36.51 | 13 | 19.12 | 36 | 27.48 | |
| Obesity | 24 | 38.10 | 52 | 76.47 | 76 | 58.02 | |
| Arm circumference (cm) | Deficit (<P25) | 5 | 7.94 | 0 | 0.00 | 5 | 3.82 |
| Normal (P25-P75) | 41 | 65.08 | 61 | 89.71 | 102 | 77.86 | |
| Elevated (>P75) | 17 | 26.98 | 7 | 10.29 | 24 | 18.32 | |
| Arm muscle circumference (cm) | Deficit (<P25) | 8 | 12.70 | 1 | 1.47 | 9 | 6.87 |
| Normal (P25-P75) | 34 | 53.97 | 42 | 61.76 | 76 | 58.02 | |
| Elevated (>P75) | 21 | 33.33 | 25 | 36.76 | 46 | 35.11 | |
| Waist circumference (cm) | Cardiovascular risk | 39 | 61.90 | 42 | 61.76 | 81 | 61.83 |
| No cardiovascular risk | 24 | 38.10 | 26 | 38.24 | 50 | 38.17 | |
| Neck circumference (cm) | Cardiovascular risk | 37 | 58.73 | 19 | 27.94 | 56 | 42.75 |
| No cardiovascular risk | 26 | 41.27 | 49 | 72.06 | 75 | 57.25 | |
| Sagittal abdominal diameter (cm) | Cardiovascular risk | 52 | 82.54 | 52 | 76.47 | 104 | 79.39 |
| No cardiovascular risk | 11 | 17.46 | 16 | 23.53 | 27 | 20.61 | |
| Lean mass index (kg/m2) | Risk of deficit | 60 | 95.24 | 54 | 79.41 | 114 | 87.02 |
| No risk of deficit | 3 | 4.76 | 14 | 20.59 | 17 | 12.98 | |
Source: Own elaboration.
Regarding the factors related to the presence of Ov/Ob, it was found that postgraduate training decreased the risk by 40% compared to incomplete bachelor's degree (PR=0.6, 95%CI: 0.37-0. 96), and that <10 years of seniority decreased it by 35% compared to >30 years (PR=0.65, 95%CI: 0.43-0.98). On the other hand, belonging to strata 1 and 2 had a 0.8-fold increase in risk compared to belonging to strata 4 and 5 (PR=1.8, 95%CI: 1.12-2.89). It was also found that the risk of Ov/Ob increases as age (p=0.01) and educational attainment (p=0.01) increase and decreases as socioeconomic stratum increases (p=0.00). No significant association was found between the presence of Ov/Ob and sex (PR=0.81, 95%CI: 0.62-1.07; p=0.14), marital status (PR=1.12, 95%CI: 0.82-1.51; p=0.44) and position (PR=0.75, 95%CI: 0.56-1.00; p=0.05). No significant linear correlation with time working at the institution was found either (p=0.06) (Table 4).
Table 4 Prevalence ratio of overweight or obesity according to sociodemographic and occupational characteristics of workers at the Universidad Nacional de Colombia, Bogotá Campus. 2017-2018.
| Characteristic | Overweight or obesity | PR | 95%CI | p-value * | ||
|---|---|---|---|---|---|---|
| Yes | No | |||||
| Sex | Female | 38 | 30 | 0.81 | 0.62-1.07 | 0.14 |
| Male | 43 | 20 | ||||
| Age (years) | <30 t | 2 | 4 | 1 | - | 0.01 |
| 30-39 | 12 | 13 | 1.44 | 0.43-4.79 | ||
| 40-49 | 26 | 16 | 1.85 | 0.58-5.90 | ||
| ≥50 | 41 | 17 | 2.12 | 0.67-6.65 | ||
| Educational attainment | Incomplete high school t | 8 | 2 | 1 | - | 0.01 |
| Completed high school | 16 | 3 | 1.05 | 0.73-1.51 | ||
| Technician or technologist | 22 | 18 | 0.68 | 0.45-1.04 | ||
| Undergraduate degree | 19 | 10 | 0.81 | 0.54-1.23 | ||
| Graduate degree | 16 | 17 | 0.6 | 0.37-0.96 | ||
| Stratum | 1 and 2. Low-low and Low | 31 | 8 | 1.8 | 1.12-2.89 | 0.00 |
| 3. Medium-Low | 39 | 28 | 1.32 | 0.81-2.15 | ||
| 4 and 5. Medium and Medium-High t | 11 | 14 | 1 | - | ||
| Marital status | Partner | 57 | 32 | 1.12 | 0.82-1.51 | 0.44 |
| Single | 24 | 18 | ||||
| Position | Clerical/managerial | 31 | 28 | 0.75 | 0.56-1.00 | 0.05 |
| Operator | 50 | 22 | ||||
| Time working in the institution | <10 years | 22 | 23 | 0.65 | 0.43-0.98 | 0.06 |
| 10-19 years | 26 | 11 | 0.93 | 0.65-1.33 | ||
| 20-29 years | 21 | 12 | 0.84 | 0.57-1.24 | ||
| 30 years or more t | 12 | 4 | 1 | - | ||
* The p-value was obtained by means of Pearson's chi-square test for sex, marital status and position, and by means of Chi- square for linear trend for age, educational attainment, stratum, and time working in the institution.
† Reference category.
Source: Own elaboration.
Discussion
The percentage of Ov/Ob malnutrition found in the workers evaluated in the present study (61.83%) is similar to that found in different investigations carried out in Latin America with workers from different universities and companies, both public and private, where Ov/Ob prevalence ranges from 52% to 81%.9,25-28Based on these studies, it could also be stated that a sedentary lifestyle during the working day can lead to Ov/Ob in Latin American countries, thus showing the need to implement nutritional counseling and physical activity programs, or strategies to transform the food offered in vending machines and design healthier menus in workplace cafeterias to avoid these conditions.
In this regard, in Paraguay, Paredes et al.29 conducted an analytical observational study in which they compared the nutritional status and healthy eating and living habits of 121 workers of 2 cell phone companies, 55 people with a healthy work environment program (group A) and 66 people without this program (Group B), finding that 60% and 53% of the participants of group A and B, respectively, were overweight without statistically significant differences. In said study, no differences were observed between the groups with respect to nutritional status, abdominal adiposity and time dedicated to eating, but differences were observed in intake of different types of food, eating between meals, the way of eating main meals, hours of sleep and physical activity, demonstrating that the intervention contributed to the improvement of the quality of food and physical activity and implying that the improvement of the work environment contributes to promoting positive changes in lifestyle.
On the other hand, the prevalence of Ov/Ob found in the present study was lower than the one reported in other studies conducted in workers from different types of institutions and companies, where percentages ranging from 72.5% to 78.4% were obtained,30-33which may be related to the knowledge that the participants have when making less healthy choices in relation to their diet and the performance of physical activity. Furthermore, the prevalence of Ov/Ob found here was higher than the 49% reported by Jacome34 in a 2012 study of 261 workers in an insurance sales company in Ecuador, or the 13.1% described by Tonini et al.35 in 55 administrative technicians in a higher education institution in Brazil; this latter marked difference can be attributed to the average age of the workers, which in the study by Tonini et al.35 was 23 years SD±4.2, whereas in the present study it was 46.6 years SD±9.01. It is worth mentioning that the study by Tonini et al.35 was conducted on 130 workers (75 teachers and 55 clerical technicians) and the prevalence of Ov/Ob for the total sample was 39.3%, but for the purposes of the analysis, the results of the subsample of clerical technicians were compared because the present study did not include teachers
Given that, as previously stated, the frequency of Ov/Ob is high in workers who perform clerical work, it might be assumed that their occupational activity involves low physical activity and a sedentary lifestyle, in addition to an inadequate diet28 that includes a high consumption of fast food and few fruits and vegetables.29 Therefore, employers should bear this in mind in order to establish programs that encourage healthier eating and physical activity practices, implement active breaks and sports activities, and offer healthier food in company cafeterias or casinos, which will be reflected in lower absenteeism.
The present study found that the percentage of overweight was higher in men (53.97%) than in women (35.29%). This is consistent with the findings of Granda-Barba et al.,36 who conducted a study to determine the risk factors for nutritional status in the administrative staff of the Universidad Estatal de Milagro (Ecuador) and found that 59.1% of the men and 35.4% of the women had this condition. This higher prevalence of overweight in men was also reported by other authors. Arbulú-Pizzarro,31 in a study in which they established the prevalence of overweight and its association with lifestyle in 131 administrative workers of a private company in Lima (96 men and 35 women), found that 55.20% of the men and 45.71% of the women were overweight. In turn, Norte-Navarro et al.,37 in a descriptive cross-sectional study in which they examined risk factors for cardiovascular disease in 124 workers at the Universidad de Alicante (66 men [28 <45 years and 38 >45 years] and 58 women [33 <45 years and 25 ≥]), found that overweight was more prevalent in men than in women in both age groups analyzed (25% vs. 6.1% in <45 years and 55% vs. 24% in >45 years). These findings highlight the need for men to actively participate in health promotion programs such as those mentioned above.
In the present study, 61.83% of the workers were found to be at cardiovascular risk based on waist circumference, this value being much higher than those reported by Arbulú31 (26%), Ratner et al.,9 (31.4%) and Martínez32 (38.9%). This behavior can be explained by the tendency to accumulate central fat due to excess calories in the diet and the change in body composition due to aging and sedentary patterns, which, in turn, leads to an increase in chronic noncommunicable diseases, absenteeism from work, and loss of healthy and productive years of life. All of this stresses the importance of creating healthy work environments.
On the other hand, in the present study it was found that having a graduate degree was a protective factor for Ov/Ob compared to having incomplete high school education (PR=0.6), demonstrating a linear trend of increasing protection as the level of education increases (p=0.01). Likewise, Ratner et al.9 found that workers with only basic or high school education have a higher risk of obesity (OR=1.6; 95%CI: 1.2-2.1; p<0.001). Moreover, Berria et al.,38 in a cross-sectional study conducted with 615 employees of the Federal University of Santa Catarina, in Brazil, (283 men and 332 women) found that having <8 years of education was a protective factor against Ov/Ob in women (RP=0.67; 95%CI: 0.49-0.94; p=0.094), but they found no correlation when comparing educational attainment ≤11 years versus >12 years in men. This implies that having a better educational background allows access to more knowledge about healthy eating and generates greater concern for self-care and prevention of chronic diseases; therefore, food and nutrition education through different means is required in work environments.
While the present study found that belonging to strata 1 and 2 was a risk factor for Ov/Ob compared to the reference category (strata 4 and 5) (PR=1.8), with a linear decrease in risk as socioeconomic stratum increases (p=0.00), Berria et al.38 found no correlation using the categories of low, intermediate and high socioeconomic level; these differences may be explained by the differences in the classification of socioeconomic level in Brazil. However, it may be concluded that the lower the purchasing power, the lower the access to natural, fresh and healthy foods such as fruits, vegetables, dairy products and meats, and the higher the consumption of high-calorie foods such as sugary drinks and packaged and ultra-processed products. Therefore, it would be necessary for the Universidad Nacional de Colombia to manage the supply of affordable healthy food for all its workers.
The present study also found a linear trend between increased risk of Ov/Ob and older age (p=0.01), which is in agreement with the findings of Berria et al.38 who found that being between 40 and 69 years old is a risk factor compared to being between 20 and 29 years old, with a tendency for increased risk in older women. Likewise, Trujillo-Aspilcueta,10 in a study conducted with 715 workers of the Peruvian National Health Institute to determine the prevalence of risk factors for overweight and obesity, found that being between 20 and 29 years old is a protective factor against obesity compared to being between 30 and 59 years old (OR=0.3, 95%CI: 0.17-0.53). Similarly, Ratner et al.9 found that being 40 years of age or older is a risk factor for obesity (OR=2.0, 95%CI: 1.4-2.8), while Martínez et al.11 found no relationship with age. Most of these results may be attributable to changes in body composition associated with increasing age that favor fat accumulation in the absence of a healthy diet and lifestyle.
Although there were no studies that took into account the variable "seniority in the institution", it is worth mentioning that in the present study it was found that seniority <10 years is a protective factor, since the risk of Ov/Ob was 35% lower in workers with seniority in this range compared to those with 30 years or more in the institution (PR=0.65, 95%CI: 0.43-0.98). This finding may be explained by the fact that recently recruited individuals are likely to be younger and therefore have a lower risk for Ov/Ob; in this sense, interventions should be focused on those with more seniority.
No significant differences were found in the risk of Ov/Ob between men and women (p=0.14). This is in opposition to the findings of Trujillo-Aspilcueta10 and Martínez etal.,32 who found that being a woman is a protective factor against obesity (OR=0.33, 95%CI: 0.24-0.46 and OR=0.36, 95%CI: 0.19-0.69, respectively). The difference noted in the present study may be due to the voluntary participation of the workers and the non-representative sample size, since both the studies by Aspicueta10 and Martínez et al.32 had larger samples.
Finally, the variables "holding a position involving operational tasks" or "performing managerial or clerical duties" were also not significantly associated with having Ov/Ob, a finding that coincides with that reported by Berria et al.38
The limitations of the present study include its small sample size, the fact that it was obtained through non-probabilistic sampling, and that the participants worked only at the Bogotá Campus of the Universidad Nacional de Colombia (single-center), which means that the findings only apply to the subjects studied. Moreover, since this is a cross-sectional study, the associations do not indicate a causal relationship. Furthermore, the bivariate analysis does not allow obtaining an adjusted OR, but rather a crude OR. Consequently, it is necessary to conduct new studies with a representative sample of workers from the Universidad Nacional de Colombia.
Conclusions
A high prevalence of Ov/Ob was observed in the workers of the Universidad Nacional de Colombia, Bogotá Campus, and it was established that having a postgraduate degree and less than 10 years working at the institution may be protective factors, while belonging to socioeconomic strata 1 and 2 may be a risk factor. It was also established that the risk of Ov/Ob increases as age increases.
This situation requires the university to implement strategies aimed at promoting healthy lifestyles among its employees, especially those with a longer tenure and lower socioeconomic status, in order to ensure a healthy work environment.