


 English (pdf)
 Article in xml format
 Article references
 Send this article by e-mail
 Cited by SciELO
  Cited by Google
  Similars in
SciELO
Similars in
SciELO  Similars in Google
 Permalink
1. Introduction
The search for happiness is an important goal to many people. Nevertheless, surprisingly little scientific research has focused on the matter of how happiness is expressed in a workplace context and what can be done to increase happiness at work. This paper deals with knowing how happy the workers of Barquisimeto, Lara State, Venezuela, Service Companies actually are. Thence, it is crucial to discover: What aspects or elements could influence their happiness level? Which are the most important? To what extent and how do these workers express their happiness?
Experts on the field of happiness have managed to identify certain elements that characterize and define it. In this way, it is deemed important to understand happiness on the basis of the study of Lyubomirsky, Sheldon and Schkade (2005), who propose that the happiness of a person is governed by three main factors: one that starts genetically, another stemming from circumstantial factors and, lastly, an attitudinal factor. The genetic factor depends on biological aspects, so 50% of happiness depends on genetic inheritance, which cannot be modified. Circumstances constitute only 10% of the well-being, external circumstances such as the characteristics of the social, working and family environment; and everything that happens unexpectedly in life. The remaining 40% is related to deliberate activity, that is, an important share of happiness depends on the very human being.
Transferring these three factors to the workplace, a challenge is set for managers of organizations to undertake practices that develop pleasant and happy environments, which facilitate action programs to achieve an improvement on the workers’ mood, the handling of their emotions and feelings, and their performance thus enjoying a more fulfilling life within and without of work, whereby they would be contributing with that 40% and 10% of the factors that determine happiness.
To this end, in the scientific literature there are studies that demonstrate the existence of a relationship between happiness and the better performance by workers. Luthans and Church (2002), states that people who are satisfied with their lives tend to be satisfied with their work as well. Specifically, the authors note that the higher the level of happiness and positive emotions of workers, the stronger the link between job satisfaction, execution and results. Similarly, Judge and Erez (2007), suggest that a correct combination of emotional stability and extroversion (reflection of a happy personality) leads to much more successful results than the behavior of people with an isolated-type character. So they argue that people who are optimistic, happy and enthusiastic about life, get better returns than sad people.
It is also important to point to research that has demonstrated the relationship between happiness and success in the workplace. Happy people earn more money, display superior performance and carry out more useful deeds when compared to their less happy peers (Lyubomirsky, King and Diener, 2005; Boehm and Lyubomirsky, 2008). Researchers have often assumed that an employee is happy and satisfied because he or she is successful (Lyubomirsky, King et al. 2005; Boehm and Lyubomirsky, 2008). Likewise, there is enough empirical evidence to show that positive aspects of personality, positive organizations and positive behavior bring about benefits for the company (Luthans and Youssef, 2007). In this way, happy people show positive affection and adaptive characteristics, which makes them happier.
Therefore, several scales to assess well-being which associate with the appraisal of happiness are found in the literature. Nonetheless, for this study used the scale elaborated and validated by Alarcón (2006), as it was deemed valid and reliable. This scale seeks to measure out: positive life meaning, satisfaction with life, personal fulfillment and the joy of living; in order to understand the happiness of workers in a sample of 295 employees from 17 service companies located in Barquisimeto, Lara State, Venezuela.
For this line of research, it is essential to examine both individual and environmental aspects as well as working context. However, this study is limited only to the workers’ inner aspects, as a first approach to the topic, so as to investigate other variables that explain happiness in the workplace thereafter.
2. Objective
To determine the order of importance of the factors affecting the happiness of individuals in the work context, in order to generate positive behavior proposals for the organizations of Barquisimeto, Lara State, Venezuela.
3. Research questions
What factors affect the happiness of individuals in their work context?
What is the order of importance of the factors that affect the happiness of individuals in their work context?
4. Research hypothesis
H 1 : positive life meaning, satisfaction with life, personal fulfillment and the joy of living are factors that affect the happiness of individuals in their work context.
5. Theoretical framework
5.1. Happiness at work
Happiness at work is a complex and strategic concept within human resource management and strategic management. However, in order to understand the topic, Baker, Greenberg and Hemingway (2006), point out that happiness is an organizational behavior, it is not about emotions and it is the result of a strategic vision. The same authors define a happy organization as that where each individual, at all hierarchical levels, has strengths, does teamwork towards a common goal, obtains satisfaction upon developing new products or services and, through these new products or services, usually provides a positive difference in other people’s lives. Fisher (2010) states that the concept of happiness considers dimensions such as participation of professionals with their organization and tasks, job satisfaction and positive commitment to their organization and tasks.
Whereas Hosie, Sevastos and Cooper (2007), as well as Hosie and Sevastos (2009), mention that organizational happiness is a function of affectionate commitment to the organization, in-task welfare, and job satisfaction. On the other hand, Baker et al. (2006), based on case studies, signal that in happy organizations (1) collaborators are more creative and capable of bringing about changes; (2) find themselves oriented towards the “possible” and not only to problem solving; (3) leaders motivate an environment that fosters collaboration, cooperation and the responsibility to innovate; (4) team work and positivism are encouraged and; (5) collaborators try to transform “possibilities” into real solutions that contribute to the sustainability of the organization.
Baker et al. (2006), mention that in a happy organization: professionals are more creative and have more capacity to bring about change; what is “possible” is thought on instead of just solving problems; leaders encourage an environment that fosters collaboration, cooperation and responsibility; teamwork and positivism are promoted; there is commitment from everybody with the vision and mission of the organization; there is a concern about developing activities that contribute to a better life quality; employee energy is observable in verbal and non-verbal communication; there is respect among all employees; the employees confide in each other and the organization; internal communication is used to create a positive attitude; kindness, consideration and generosity are part of the organizational culture; employees are encouraged to take on risks that might bring benefits for the organization; collaborators are committed to disruptive innovation; joy is deemed fundamental for organizational sucess; competition is perceived as important for the growth of employees, but always bearing respect for the other elements of the team; employees are sincere and correct both with clients and colleagues.
The new objective of the millennium is to be happy while working, as Hosie and Sevastos (2009) affirm, in the new millennium happiness at work is presented as an issue of extreme importance. In fact, these authors point out that, in recent years, an explosion of interest in analyzing happiness, optimism and positive character traits has taken place among researchers. The measuring of this state of mind in productive sectors is gaining more strength at an international scale. Thus, some research serving as support to this study are shown below.
5.2. Research on happiness at work and performance
Scientific studies show that happiness predicts important results at multiple domains of life, such as marriage, friendship, work, success, physical and mental health, among others. So happiness has become a topic of interest for many researchers, including those in the workplace field; hence, here are some findings made in this field. For instance, the studies by Lyubomirsky, King et al. 2005; Lyubomirsky, Sheldon et al. 2005; Boehm and Lyubomirsky (2008) account for the relationship between happiness and success, psychological capital and satisfaction, productivity and performance at work, as well as for perceptions of work and well-being.
Lyubomirsky, King et al. (2005), suggest a conceptual model for the happiness-success relationship, arguing that this relationship exists not only because success makes people happy, but also because the positive effect begets success. Statistical tests (cross sectional, longitudinal and experimental evidence) are performed to test it, and the results reveal that happiness is associated with and precedes numerous successful outcomes. In addition, the evidence suggests that positive affection may be the cause of many desirable characteristics, resources and successes. Notwithstanding, this study makes it clear that, at the same time, happy people are able to react with negative emotions when it is appropriate to do so.
The relevance of this study needs to be considered when its findings contradict the belief that successful results and positive emotions are the main causes, rather than consequence, of happiness. Following this train of thought, the study by Boehm and Lyubomirsky (2008) continues to be dug into, whom also work on the hypothesis that happiness is a reason why some employees are more successful than others. To that end, upon the evidence of three types of cross-sectional, longitudinal and experimental studies, the authors consider the relationship between happiness and labor results. The authors suggest that happiness is not only correlated with success in the workplace, but happiness often precedes success measures, and also inducting positive affection leads to better results in the workplace. However, such evidence is unable to demonstrate a causal connection. For instance, researchers cannot unravel whether happiness leads people to acquire jobs of greater autonomy or if greater autonomy makes people happy.
Therefore, they suggest considering a wider range of cultures before these results may be deemed representative of a broad spectrum of people. In addition, they point out that it is interesting to recognize that happiness is not the only resource capable of bringing success, due to the existence of other resources such as intelligence, wealth, connections and perseverance, which undoubtedly also play a role in the success of employees’ careers. In the same way, the results obtained do not intend to suggest that unhappy people cannot enjoy enormous professional success. There are many people who are unhappy or dysphoric but turn out to be leaders within their fields.
Other empirical studies support the relationship between happiness and performance at work as well; Pryce-Jones (2010) makes a correlation between happiness and other measures utilized in the workplace. The author points out that the subjective reports on happiness correlated with the following three behavioral measures: (1) Working more discretionary hours; (2) Taking less sick leave; and (3) Staying longer at work. In his study, this author, gathered information through extensive discussion groups and personal interviews to over 80 people, covering a variety of cultures and industries, and obtaining as a result that happiness at work was highly correlated with what that the author called the “C’s”: Contribution: the effort that is made; Conviction: the motivation that is had; Culture: how good it feels to be working; Commitment: the extent to which a person is committed; and Confidence: that one had on oneself and one’s work.
Hosie et al. (2007), in a research project involving 400 professionals in Australia, sought to link happier employees and greater productivity. The authors consider as their theoretical model “the happy productive worker thesis” developed by Staw (1986). The model taken into account dimensions that appraise professional happiness, such as personal characteristics, in-task characteristics, setting of objectives, workflow, balance between work and family and job satisfaction. The authors conclude that there is a positive correlation between organizational performance and happier employees. It is verified that compensation is not the most important factor for a professional to feel happy. In fact, recognition, the possibility of personal and professional development and internal environment are more important.
It is important to point out, following this line of argument, the works of Wright, Cropazano and Bonett (2007a), who examine the relationships between psychological well-being, job satisfaction and job performance with employee turnover. Using a sample of 112 managers employed in a large organization in the West Coast of the United States, and controlling for age, gender, ethnicity and job performance, well-being and job satisfaction predicted turnover non-additively. Welfare was found to moderate the relationship between job satisfaction and separation from employment; thus, job satisfaction is strongly (and negatively) related to staff turnover when welfare is low.
Similarly, at another study developed by Wright, Cropazano and Bonett (2007b), the authors found that satisfaction at work (r= 0.36, p <0.01, 95% CI= 0.18 to 0.52) and psychological well-being (r = 0.43, p <0.01, 95% CI = 0.26-0.58) were associated with higher scoring performance.
On the other hand, Luthans and Youssef (2007), examine positive aspects (Big Five personality, basic self-assessments and strengths of character and psychological capital), positive organizations and positive behavior (courageous organizational citizenship and action based on principles), showing that positive organizational behavior can contribute between 4% and 15% to job performance variation. The authors also made some calculations to demonstrate the economic impact of their results on the companies where the research was conducted, thus reaching the conclusion that the usefulness of individual positive psychology generates benefits for companies.
Along this line of thought, management actions and practices can affect the working conditions for employees and their perceptions on these conditions, thus improving key results at the organizational level. Therefore, the perception of working conditions also turn into an interesting field of study, since it seeks to draw attention to the best way to manage people to obtain the desired results. In this vein, Harter, Schmidt, Asplund, Killham and Agrawal (2010), point out that perceptions of working conditions have proven to be important for the welfare of workers. These results are known to be correlated with the attitudes of the employees and perceptions on working conditions, but research on the direction of the causality in their studies has not been conclusive. By using an extensive longitudinal database including 2,178 business units within 10 large organizations, the authors found evidence supporting the causal impact of employee perceptions on these measures; reverse causality of measures on employee perceptions existed, but it was weaker.
As indicated by López and Fierro (2015), it is necessary to understand what the causes that promote happiness in employees of an organization are in order to design policies and programs aimed at maximizing employee welfare. Their study was based on identifying the main causes that make happiness levels vary between one individual and another by considering, as a research ground, the population of pharmacy managers from Ecuador. It was based on a survey applied to 265 managers nationwide. As a conclusion, demographic aspects such as age, gender, distance to work, city or the time working at the company do not substantially affect happiness. Nonetheless, factors such as psychological well-being, happiness at work and work-personal life balance have a high influence when measuring subjective well-being. Therefore, the most influential determining factor in the happiness of managers is psychological well-being.
6. Methodology
Methodologically, this research is the outcome of a fieldwork carried out through visiting 17 service companies located in Barquisimeto, Venezuela, and applying a total of 295 surveys to the same number of employees. The information was gathered in a specific time frame during 2015, which implies that it was a cross-sectional research, since the description of the phenomenon under study corresponds to the situation experienced by employees at said companies throughout that period.
Likewise, it was of non-experimental type, since the object under study is only being described without intervening or modifying the variables involved. In order to meet the objective of the study, a quantitative, documentary and field approach research was designed. From the latter, data was collected from 295 employees at 17 service companies located in Barquisimeto, Venezuela, which were obtained through the questionnaire already validated by Alarcón (2006), with a five-point Likert-type Lima happiness scale. In the questionnaire, an additional question was included to measure workers’ happiness and integrating the four factors or dimensions, as well as the subjective happiness scale by Lyubomirsky and Lepper (1999), which consists of 5 items with a Likert-type response; its correction is made by adding the scores obtained and dividing them by the total number of items (Lyubomirsky and Lepper, 1999). The information gathered was transformed into numerical variables by using the SPSS v.23 software.
6.1. Participants
The sample consists of 295 employees from 17 service companies located in Barquisimeto, Lara state, Venezuela, with a confidence level of 95% and an error margin of ± 5%. To pick the aforementioned sample, a probabilistic random sampling proceeded, where all employees in all companies had the same chance of being picked.
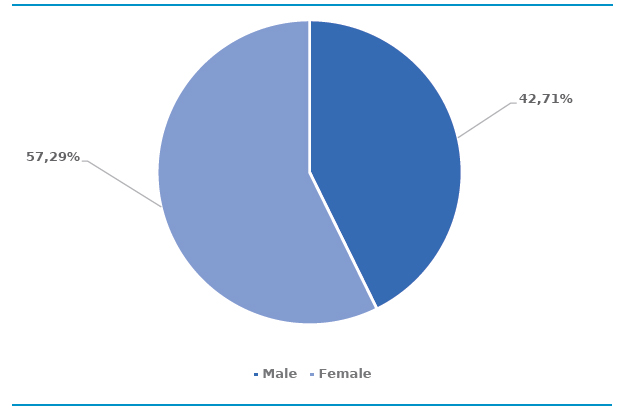
The average age of the participants in this study was 30.11 years, with a standard deviation equal to ± 8.596. 57.3% are women and 42.7% are men. It may be appreciated that a strong percentage of the respondents have technical studies representing 36.9%, while 20% have a BA in administration and 10% are engineers. It can be noted that 32.9% of respondents do not have a major.
Similarly, it can be seen that positions within the companies are distributed and occupied as follows: 60% by operational positions, 30.8% by middle managers and 9.2% by managerial positions.
6.2. Instruments
The Lima Happiness Scale was used; elaborated and validated by Alarcón (2006). This scale consists of 27 questions with five Likert-type response alternatives: strongly agree, agree, neither agree nor disagree, disagree and strongly disagree.
The author has also determined, through factorial analysis, 4 happiness factors: factor 1 refers to positive life meaning (α=0.88); factor 2 to satisfaction with life (α=0.79); the factor 3 to personal accomplishment (α=0.76); and factor 4 refers to the joy of living (α=0.72) (Arias, Caycho, Ventura, Maquera, Ramírez, and Tamayo, 2016).
7. Results
7.1 Reliability and validity analysis
A reliability analysis was carried out through the Cronbach’s alpha statistic for each of the 27 items making up the dimensions of the Lima Happiness Scale, with the intention of measuring the average inter-item correlation; as well as the total Cronbach’s alpha per dimension of the questionnaire applied.
The internal consistency method based on Cronbach’s alpha allows estimating the reliability of a measurement instrument, through a set of items expected to measure the construct or theoretical dimension thereof. Table 1 shows the inter-item correlations per dimension, where it can be seen that the interval ranges between 0.442 and 0.376, values considered as good (Merino, Navarro and García, 2014).
Table 1 Correlation between dimensions and the instrument’s Cronbach’s alpha
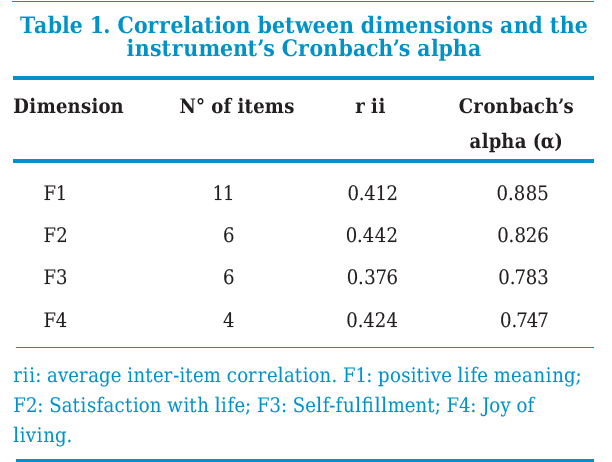
Source: Author’s own elaboration, based on the data processed by SPSS, v23.
For construct validity, exploratory factor analysis (EFA) was used since it largely incorporates aspect, content, criterion -concurrent and predictive- analysis, and its ideal for questionnaires assessment (Batista, Coenders and Alonso, 2004).
The EFA indicated that the Keizer-Meyer-Olkin (KMO) sample adequacy test obtained a value of 0.902, which may be considered as very high (Kaiser, 1974). Furthermore, Bartlett’s sphericity test was significant (χ2 = 3543.500, gl = 351, p <0.000). These findings indicated that it is possible to perform a confirmatory factorial analysis (CFA) (Kaplan and Saccuzzo, 2006).
Table 2 displays the total variance as explained by the three determining factors, based on auto values equal to 1; however, the five factors resulting from the statistical test are presented. The three factors explain 43.109% of the total variance of the database. The first factor explains the highest percentage of the variance (32.405%); the second factor 6.794% and the third one 3.909%.
Table 2 Total variance explained by the factors and/or components of the test
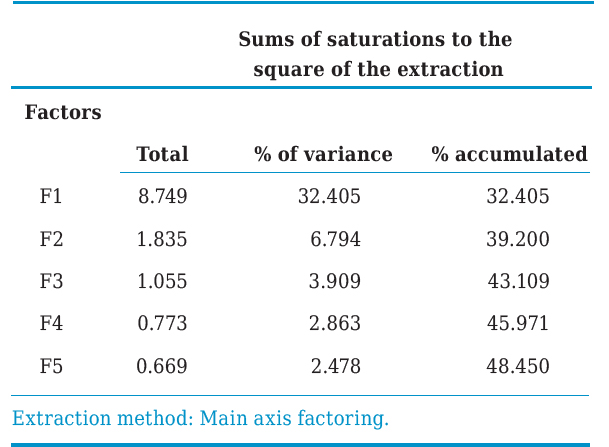
Source: Author’s own elaboration, based on the data processed by SPSS, v23.
In Table 3, the components and their respective items resulting from the EFA are appreciated. Thus, Component 1 loaded items: 10, 8, 4, 7, 11, 9, 1, 2, 5, 6, 16, 14, 17, 12, 18, 15, 13, 19, 22, 25, 27; Component 2) loaded items: 20, 21, 23; Component 3 loaded items: 26 and 24; and Component 4 loaded item: 3.
Table 3 Exploratory factorial analysis (component matrix) for the instrument
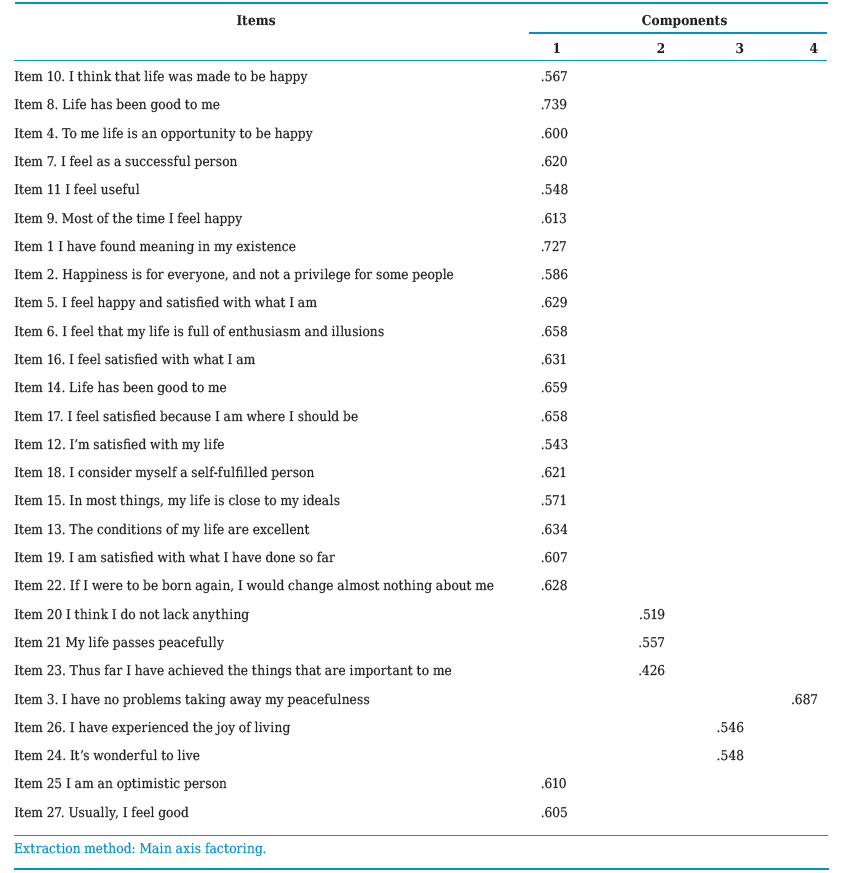
Source: Author’s own elaboration, based on the data processed by SPSS, v23.
Based on the above information, three factors or dimensions could be thought to explain the greater variance of the data; however, in Table 4, a confirmatory factorial analysis (CFA) is shown, which indicates that the 27 items of the test load on four dimensions or factors that explain 53.527% of the total variance.
Table 4 Total explained variance of the loads rotated to the square
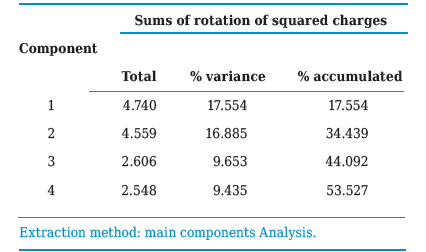
Source: Author’s own elaboration, based on the data processed by SPSS, v23.
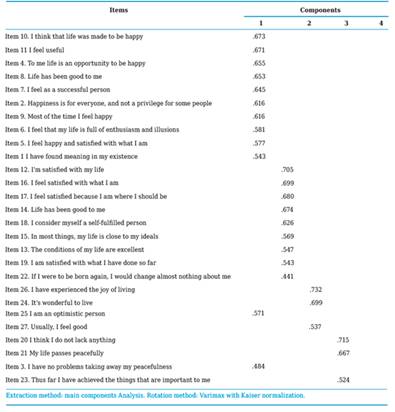
The CAF confirmed it is four factors or dimensions which load into the instrument. Table 5, shows the matrix of rotated components and their respective items, which can be grouped and named as follows: Component 1 (positive life meaning, items: 10, 11, 4, 8, 7, 2, 9, 6, 5, 1, 3; Component 2 (Satisfaction with life), items: 12, 16, 17, 14, 18, 15, 13, 19, 22; Component 3 (Joy of living), items: 26, 24, 25, 27 and; Component 4 (Personal self-fulfullment), items: 20, 21, 23.
Table 5 Confirmatory factorial analysis
Source: Author’s own elaboration, based on the data processed by SPSS, v23.
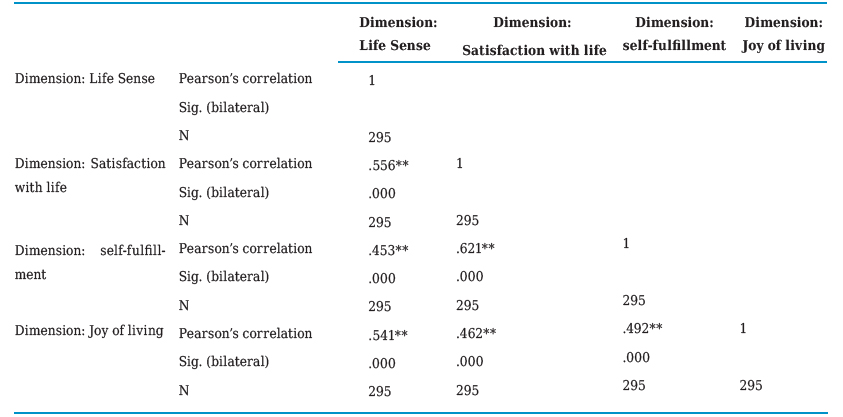
Likewise, a correlation analysis between the four factors or dimensions of the Happiness Scale was carried out, where it may be noted that there are positive and statistically significant correlations between them. In Table 6, the correlations by dimension are shown, being: satisfaction with life and meaning of life (r = 0.556, p = 0.01); self-fulfillment and meaning of life (r = 0.453, p = 0.01); joy of living and meaning of life (r = 0.541, p = 0.01); self-fulfillment and life satisfaction (r = 0.621, p = 0.01); joy of living and satisfaction with life (r = 0.462, p = 0.01) and, lastly, self-fulfillment is positively associated with joy of living (r = 0.492, p = 0.01).
7.2. Descriptive analysis of the sample
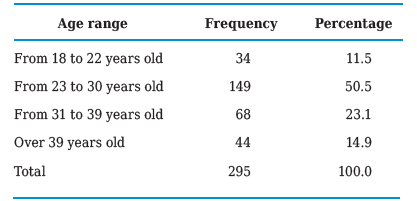
Firstly, the sample was analyzed in terms of its composition by gender and age, and the following information was found. Table 7 shows the age ranges of the respondents, with a mean of 30.1 years, while Figure 1 indicates that 42.7% are men and 57.3% are women.
7.3. Multiple linear regression analysis
As part of this research study, multiple linear regression was performed through the “successive steps” method in SPSS, v.23. In a first approximation, all independent variables were considered in connection to the dependent variable: happiness; as well as the gender and age variables, which intended to find some direct relationship between these two variables and workers’ subjective happiness. This analysis was carried out by correlating the four dimensions of the Alarcon’s Happiness Scale with the Subjective Happiness Scale by Lyubomirsky and Lepper (1999).
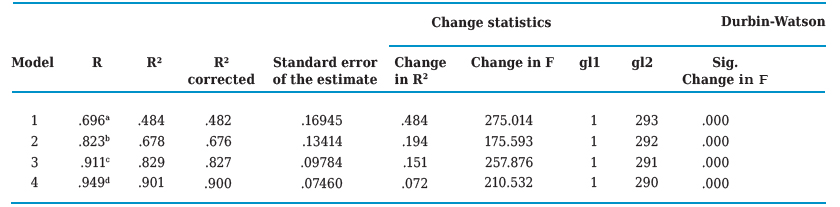
Table 8 shows the outcome of the model generated after applying the successive steps method as a multiple linear regression option in the SPSS v.23 statistical software, where Pearson’s linear correlation coefficient is detailed (R) with a value of 0.949 and the one of determination (R2), as well as the statistics of change and the Durbin-Watson test.
Table 8 Multiple linear regression model summarization
Source: Author’s own elaboration, from the data processed by SPSS, v23.
The four models are observed to have been generated by the method described above; however, the most significant one consider is model 4 as it considers the largest number of independent variables, which generates an R2 equal to 0.901, which means that the model’s goodness of fit is sufficient, since the independent variables introduced and considered into the regression model, through the successive steps method in SPSS, explain 90.1% of the variability in the happiness of workers at service companies of Barquisimeto, Lara State, Venezuela.
With the value obtained from the Durbin-Watson statistic equaling 1.846, it can be assumed that the self-correlation among the residuals is zero or non-existent, since it is in the range of 1.82 and 2.18, with a significance level of 5% (Rositas, 2014).
To know the significance of the independent variables with regards to happiness at work as a dependent variable, t-scores were analyzed per coefficient from the total considered variables for the multiple linear regression model. The results showed that the four variables or factors of the instrument (Lima Happiness Scale) contribute significantly to the generated model.
Therefore, the significant results were for the variables or factors: positive life meaning (F1), satisfaction with life (F2), self-fulfillment (F3), joy of life (F4), as well as for the regression constant, since the critical level value was Sig. <0.05.
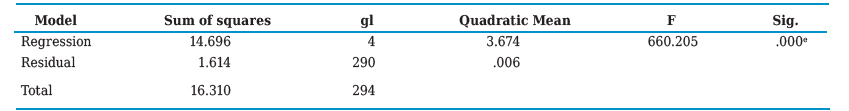
Table 9 shows the summary of the ANOVA from the multiple linear regression model, which indicates whether there is a significant relationship between the variables or not. Statistic F (660.225) allows to test the null hypothesis of the population value of R being zero, which approves the existence of a linear relationship between the dependent variable and the independent variables that turned out significant.
Table 9 ANOVA of the multiple linear regression model summarization
Source: Author’s own elaboration, from the data processed by SPSS, v23.
The critical level value Sig = 0.000v indicates that the variables are linearly related, namely, the regression model is statistically significant, which indicates that the variability observed is not due to chance. A certain association between the independent variables and the dependent variable may be assumed to exist.
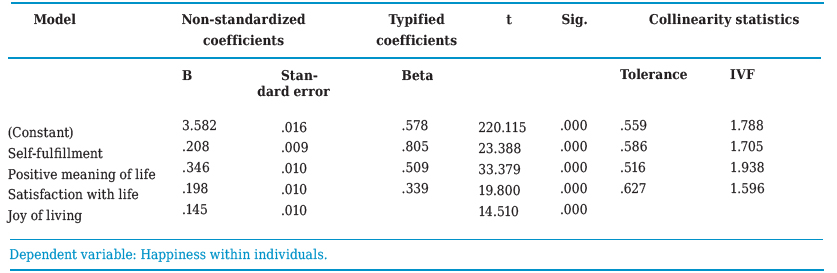
Table 10 allows to explain and analyze the t-scores per factor from the Lima Happiness Scale, which was used as part of the instrument applied and were introduced into the multiple linear regression model.
Table 10 Regression coefficients for all the introduced factors
Source: Author’s own elaboration, from the data processed by SPSS, v23.
By this analysis, it’s possible to respond to the research question formulated for this study, which allows to answer that the four analyzed factors turned out to be significant to explain individuals’ happiness. Furthermore, the order of importance of the factors is: positive life meaning (F1), with an absolute value in its standardized coefficient of 0.805; self-fulfillment (F3) with a coefficient of 0.578; followed by the satisfaction with life factor (F2) with a coefficient of 0.509 and, lastly, the factor joy with life (F4) with a coefficient of 0.339.
With respect to the non-standardized coefficients from the regression model and their relative significance regarding the independent variables, they contain the factors that define the regression equation in direct scores. The coefficient corresponding to the Constant is the one that has been called β0, whereas the coefficients for positive life meaning (F1), satisfaction with life (F2), self-fulfillment (F3), happiness with live (F4), equal β1, β2, β3 and β4, respectively.
In Table 10 the collinearity statistics are analyzed, which indicated that there are no multicollinearity issues between the factors and/or independent variables F1, F2 F3 and F4, since the values of the variance inflation factor (VIF) are lower than 10 and close to 2; that is, values between 1.596 and 1.938 turned out, while all tolerance values (T) were greater than 0.10.
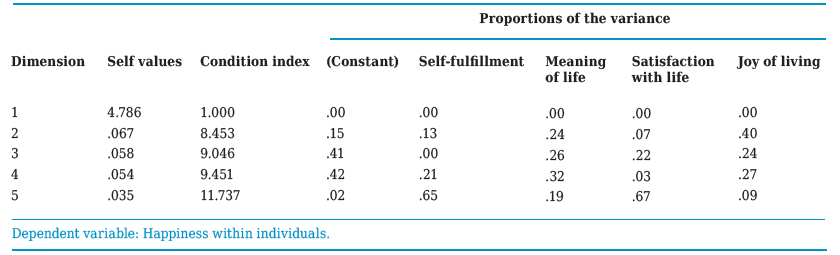
The foregoing is reinforced with what is shown in Table 11, where the multicollinearity condition index generated for the factors and/or significant variables turned out with values lower than 20, which indicates that there are no multicollinearity issues among the F1, F2, F3 and F4 factors.
Table 11 Collinearity indexes between factors
Source: Author’s own elaboration, from the data processed by SPSS, v23.
According to the coefficients of the multiple linear regression model obtained, it was possible to propose the regression equation according to the order of relative importance in the model, as shown by Formulas 1a and 1b.
Y = β0 + β1 F1 + β2 F2 + β3 F3 + β4 F4 + ε (1a)
Y = 3.582 + 0.346 (F1) + 0.208 (F3) + 0.198 (F2) + 0.145 (F4) (1b)
Where:
Y = Happiness of the worker
Β0 = Model constant
β1, β2, β3, β4 = Betas of the model
F1 = Positive meaning of life
F2 = Satisfaction with life
F3= self-fulfillment
F4 = Joy of living
ε = Error or residual
The regression equation means that, at a value of one in positive meaning of life and keeping the rest of the factors constant, individuals’ happiness level at work will be one of very satisfied with their happiness state, which verifies that the factor described above is the most important and most contributing in explaining happiness with a 80.5%.
Lastly, we can return to the research hypothesis formulated for this study, which is accepted, since the four factors turned out to be significant and valid to measure workers’ scale of subjective happiness according to the t-scores and the level of sig. <0.005, for each of them.
8. Conclusions
Being happy is a personal decision, and a challenge for organizations to motivate and create a positive culture based on values and gratitude to everything that is held and received, linked to the growth of workers and balance between personal life, family and work.
The correlation between workers’ scale of subjective happiness and the four factors that measure it is very strong; i.e., positive meaning of life (F1), satisfaction with life (F2), self-fulfillment (F3), joy of living (F4) explain in 90.1% the happiness of workers at service companies in Barquisimeto, Venezuela.
The multiple regression analysis permits a first approximation to workers’ happiness levels in labor contexts within service companies of Barquisimeto, Venezuela, from the perspective of the four factors that were measured plus the subjective happiness scale. In the first place, the most important factor for the happiness of a worker is his positive meaning of life (F1), whence may be inferred that there are no depressive states, pessimism and existential vacuum in the worker.
The next factor that was significant in order of importance was self-fulfillment (F3), which suggests that a worker expresses full happiness and not temporary states of happiness. The satisfaction with life factor (F2), infers that a worker is satisfied with possessing the desired material goods, and the last factor in order of importance for the worker’s happiness was the joy of living (F4), which tells how wonderful life is; as well as the positive life experiences and usually feeling well.
Based on the foregoing, the evidence points out the adequacy of the subjective happiness scale with the four dimensions of Alarcon´s Happiness, to be used in research in various groups as a reliable and valid measure to study happiness. Furthermore, positive aspects from the workers’ personality are demonstrated to affect happiness thereof, thus concluding that happy people show a positive affection and adaptive characteristics in the organizations or companies where they work

