


 English (pdf)
 Article in xml format
 Article references
 Send this article by e-mail
 Cited by SciELO
  Cited by Google
  Similars in
SciELO
Similars in
SciELO  Similars in Google
 Permalink
1. Introduction
Natural ventilation in buildings has been a subject exhaustively studied for more than 50 years. Still, the mechanics of such a physical problem has not been fully understood, despite the development of many descriptive experimental and numerical studies for airflow estimation coupled with heat transfer, to aid such an understanding. Many factors influence the adequate implementation of natural ventilation strategies regarding the occupant’s comfort needs, and thus, affecting the energy consumption of the building. Among these factors, the behavior, knowledge, and tolerance of the occupants play an essential role.
Nowadays, natural ventilation continues to attract interest because of its benefits in terms of air renewal and cooling. Such benefits can provide a significant reduction in building energy consumption regarding location (latitude). In template latitudes, i.e., Europe, the implementation of natural ventilation in the summertime, results rather in an excellent strategy to reduce energy consumption for cooling purposes. On the other hand, in wintertime, natural ventilation serves rather to the renewable of stale and moist air resulting in an all-close strategy to avoid heat losses through air leakages, instead of using mechanical ventilation extraction. In very hot latitudes, i.e., the Middle East, the implementation of natural ventilation serves also rather air renewal purposes, since the outdoor air temperature presents a weak gap between daytime and nighttime and weak humidity levels. In such cases, the thermal mass of buildings plays a more critical role in the occupants’ comfort. In tropical latitudes, with high humidity and temperatures with weak day-night fluctuations, ventilation together with appropriate thermal mass and insulation, significantly improve the thermal comfort [1,2]. In such cases, bioclimatic strategies combined with natural ventilation, as to elevate the building floor about 3 m above the ground, can be useful to reduce the indoor moisture levels [3,4].
Moreover, as the implementation of natural ventilation can reduce energy consumption related to the cooling process in buildings, usage recommendations are expected to be included in all energy regulation policies. This is the case of countries with operating super-efficient buildings as the nearly zero energy buildings (nZEB), and net-zero energy buildings (NZEB). Here, the management of natural ventilation can provide adequate results, utilizing automation systems regarding occupants’ behavior. In this regard, the International Energy Agency (IEA) through the Energy in Buildings and Communities Programme (EBC), first devoted Annex 66 [5] to study and describe the occupants’ behavior related to window opening (to profit from natural ventilation), and other related to energy consumption (appliances usage, lighting, among others). Second, in 2018 the IEA started working on Annex 79 [6] to provide solutions to occupants’ preferences by considering the level of automation and control systems in the building.
As natural ventilation involves local and global interactions, being related all together by Navier-Stokes’ equations, the estimation of these interactions can be performed by many local and global approaches. Such approaches, rather more experimental and numerical than analytical, often require a great deal of instrumentation and equipment for the former, which results in higher demands on project budget and funding. For the latter, depending on how detailed the analysis is wanted, the computation-time consumed to solve the equations becomes higher, which translates in the need for powerful computers, and thus, also increasing the demand for funding.
This work is devoted to comprehending the natural ventilation concept, and to assess the experimental and modeling techniques already implemented for past researchers, in the estimation of the ventilation airflow rate due to the wind and thermal buoyancy effects. This will provide a strong theoretical grasp of the natural ventilation process as part of the main elements in the thermal behavior of buildings. Ultimately, these bases are intended to help choose the most suitable techniques to estimate the natural ventilation airflow rate.
The structure of the present work is divided into three principal sections: (i) Natural ventilation in buildings, which includes the role of natural ventilation in buildings along with concept definitions and natural ventilation driving forces. (ii) Estimation of the natural ventilation airflow rate, which starts with defining the airflow capacity of openings, followed by (iii) experimental techniques and analytical/numerical techniques, finishing with a discussion intended to determine the most suitable experimental technique to estimate the airflow rate.
2. Natural ventilation in buildings
Natural ventilation is the process of renewing the air of a room by natural means by either from infiltrations (unavoidable) or window openings (on purpose). In general, there are three leading causes of air movements by natural means inside and around a building: (i) wind effects, (ii) air temperature and solar radiation, and (iii) concentration of moisture and pollutants [7]. A schematic showing the relation and influence factors, among these three causes of air movements inside and around a building, is presented in Figure 1. Starting with the three leading causes of natural air movement, where the first two are normally known as the natural ventilation is driven forces, and the other one is often not taken into account in most natural ventilation studies.
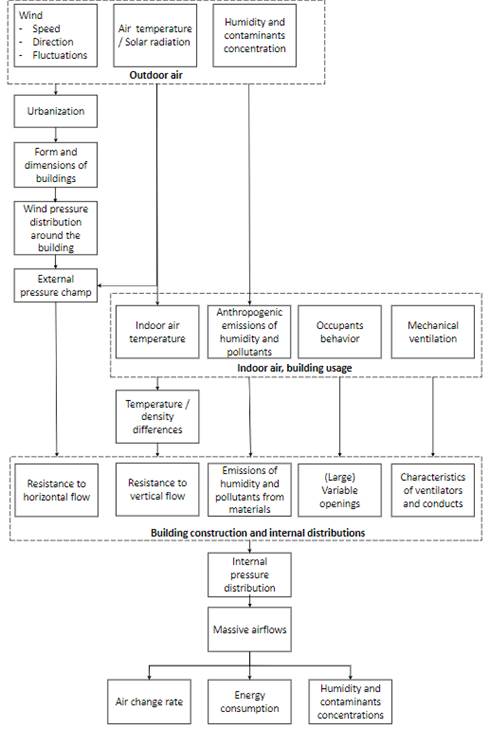
Figure 1 Influence factors and relations in the air movement domain inside and around the building [7]
The influence of winds, in the sense of blocking, depends on the level of urbanization around buildings, the building form and dimensions, and orientation. As shown in Figure 1, these four factors mentioned before can be accounted for by a resistance to horizontal flow together with internal and external pressure distribution around the building. Similarly, the influence of the difference between indoor and outdoor temperatures can be accounted for by a resistance to vertical flow, which is dependant on the building height and opening sizes. The impact of all influencing factors related to the indoor air movements can be globally assessed in terms of three most parameters: (i) the air change rate, (ii) energy consumption, and (iii) air quality.
2.1 The role of natural ventilation
In a building, the role of ventilation is crucial concerning two major points: the indoor air quality (comfort and minimum air renewal rate) and energy consumption. In this regard, natural ventilation is wanted to efficiently provide a minimum air renewal rate to keep the air stale out from the room, and thus, avoiding the use of mechanical ventilation, leading to minimizing the energy consumption [8]. The latter depends on the outdoor ambient conditions. Promising results encountered higher energy savings around 17%-80%, when having a fully automatic system, especially with a model predictive control algorithm [9]. In the case of tropical climate, a study showed no significant reduction when implementing night free cooling strategy (about 0.5%); this was attributed to the small difference between the indoor and outdoor air temperatures [10].
Thermal comfort
The adequate implementation of natural ventilation in buildings strongly depends on the occupants’ behavior, which is usually driven by their hygrothermal comfort needs. Many parameters influence these comfort needs, and can be classified into three categories: physical, physiological, and external; the indoor and outdoor conditions (air temperature, relative humidity, air currents), are among the physical parameters; the level of metabolic activity perform and the level of clothing, are some of the most important physiological parameters [11]. Several comfort indicators can be found in the literature. In summer, the standard ISO 7730 recommends the use of the following values for comfortable indoor conditions:
A room temperature between 23 and 26 ◦C,
The difference in vertical temperature must be less than 3 ◦C,
An average indoor air speed less than 0.25 m・s−1,
The degree of discomfort that measures thermal dissatisfaction.
Another parameter very evoked in the literature is the difference between the temperature of the indoor air and the mean radiant temperature of the surrounding walls. According to [12], a feeling of discomfort can appear beyond a temperature difference higher than 2 ◦C, between the indoor air temperature and that of the ceiling, and 3 ◦C with that of the walls.
In regions with a significant temperature gradient between nighttime and daytime, night natural ventilation, if implemented adequately, arises as a good solution for the attenuation of the heat wave associated with the daytime period, leading to maintaining the thermal comfort for longer periods. Its application may be more attractive in office buildings, due to the absence of occupancy during nighttime. Its principle consists of cooling down the structure of the building when it is not occupied (nighttime), providing a heat sink that is available during the occupancy period (daytime). This heat sink absorbs the heat gains related to occupancy or equipment and maintains acceptable indoor conditions [11]. The cooling potential of nighttime ventilation can be assessed by the temperature difference between the indoor air and the surface of the wall [Figure 2].

As observed in Figure 2, during nighttime, the temperature of the walls is higher than the air inside the office; therefore, heat transfer will occur outwardly (from the walls to the surrounding air), successfully cooling down the walls. In detail, the temperature difference between the indoor air and the wall surfaces is the consequence of the building interaction, among other parameters, such as the outdoor air and the sky temperature, the surface temperature of the surrounding buildings, and wind effects. Night natural ventilation strategies have been widely studied [9,13-15].
However, different limitations are encountered depending on the site where the building is located; urban or suburban. Also, depending on the periods of occupancy in the building, implying that this strategy is useful for office buildings.
Air infiltrations and leakages
Air infiltrations and leakages are the unavoidable part of the natural ventilation process, due to imperfections in the envelope or joinery. They are important for indoor air quality, but if not controlled properly, they could become the leading cause of heating losses. Therefore, the quantification of the air-leakage rate represents an important issue for the prediction of the heat losses. Also, regarding the nature of the air leakages, their distribution around the envelope is often complicated to be determined [16,17].
Impact on energy consumption and performance of natural ventilation strategies
Although it is known that the use of natural ventilation systems might reduce the overall power consumption if we applied them correctly, how much will it reduce, depends on many parameters. When applicable, natural ventilation can compensate for cooling energy consumption and its energy costs and carbon dioxide emissions. The potential cooling energy that may be saved depends, of course, on the climate conditions of the building location and the internal and external heat gains [18,19].
When having not quite favorable climate conditions for the implementation of natural ventilation, coupling it to a mechanic system remains possible, which is accomplished in Hybrid Natural Ventilation systems.
Among the performance indicators of natural ventilation strategies, a good indicator for evaluating the ventilation power is the level of air change per hour reached. Regarding energy consumption, a good indicator is the percentage of occupied hours where minimum mechanical ventilation rates are met [20].
One of the most critical limitations of natural ventilation usage lies in its understanding. Some of the advantages [1-5] and limitations [6-9] regarding its applicability are [21]:
Well accepted by occupants who understand it and control it very easily.
The energy required for air transport is free.
It allows high flow rates, especially for passive cooling.
It does not crash or fail.
It does not work in noisy or polluted areas.
It does not work in places with a depth/height relation exceeds 2.5 (office landscape).
It hardly allows the heat recovery from exhaust air.
It provides a variable flow rate, which without proper controls, might not be necessary in relation to the needs.
2.2 The concept of natural ventilation
For a better understanding of the natural ventilation process, three essential aspects are introduced to define the concept of natural ventilation: How is it created? In which way can it be implemented in buildings? And, which architectural features can be employed? This can be illustrated in Figure 3. Natural ventilation is created by either buoyancy forces, wind forces, or a combination of both. These two forces can be exploited to ventilate a space by promoting the implementation of some strategies: single-sided ventilation, cross ventilation, or stack ventilation; and this, through some architectural features such as wind towers, wind scoops, chimneys, double facades, atria, among others [22]. Finally, the determination of the natural airflow rate depends on the strategies implemented.

In the case of wind-driven ventilation, to benefit the most from this natural force, it is recommended that the façade with openings of a building located in a windy place must be oriented perpendicularly to the wind direction, although not strictly necessary [23]. When the wind currents find in their path a building, a high-pressure zone is created over the windward side (or upside) of the building, and the leeward side (or downside) experiences an under-pressure zone [Figure 4 (a)). The other sides of the building (those in the wind direction) will also experience an under-pressure status [Figure 4 (b)) [22]. In general, the resulting dynamic pressure over the windward facade can be defined as a function of the wind speed using Bernoulli’s principle, as presented in Equation (1):
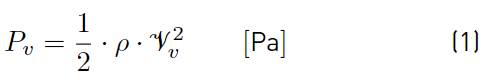
where ρ represents the air density at outdoor temperature, and
 is the wind speed at the opening height on the windward side. The resulting airflow rate inside the building due to wind effects depends on the windward-leeward pressure difference, as presented in Equation (2):
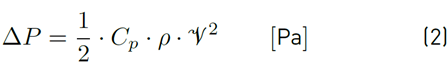
where C p is known as the pressure coefficient [24,25].

This pressure coefficient is introduced in the building domain to account for the pressure differences induced by the airflow over the building envelope. A simplified representation of these pressure differences is presented in Figure 4 (a), where the windward facade of the building experiences an overpressure, while the leeward façade experiences a pressure drop with respect to the static pressure of the freestream, named dynamic pressure (P ∞ ), defined by Equation (1). Thus, an Equation for C p can be written as presented in Equation (3) [24]:
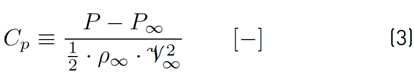
where P is the value of the pressure where the coefficient is being evaluated. ρ
∞
and
 represent the density and velocity of the airflow on the freestream region, respectively. The windward facade will present positive values of C
p
, while the leeward facade, negative values. An overview of acceptable models to predict C
p
values in buildings are presented in §3.3.
represent the density and velocity of the airflow on the freestream region, respectively. The windward facade will present positive values of C
p
, while the leeward facade, negative values. An overview of acceptable models to predict C
p
values in buildings are presented in §3.3.
Air flow due to buoyancy forces
A density gradient can induce air movement between two regions (buoyancy forces). This gradient can be created by either different gas concentrations, a temperature difference, a humidity difference, or a combination of these three. In buildings, this mentioned before can cause air movement within the same zone, between different zones within the building, between two facades [21], and between the inside and outside of the building [Figure 5]. The reason lies in that this density gradient creates a pressure difference between the zones, generally referred to as static pressure. In this case, the overall pressure difference can be defined as a function of the air density of two zones (indoor and outdoor air), by Bernoulli’s principle as presented in Equation (4):

where g is the gravitational acceleration, and
 is the height between an upper and a lower opening [Figure 5 (a)). Note that this Equation is under the assumption that the air entering the building is at outdoor air density (ρoa), and the air leaving the building is at indoor air density (ρia). Also, in Equation (4), it is considered that the height of the openings is negligible with respect to their separation
 .
.
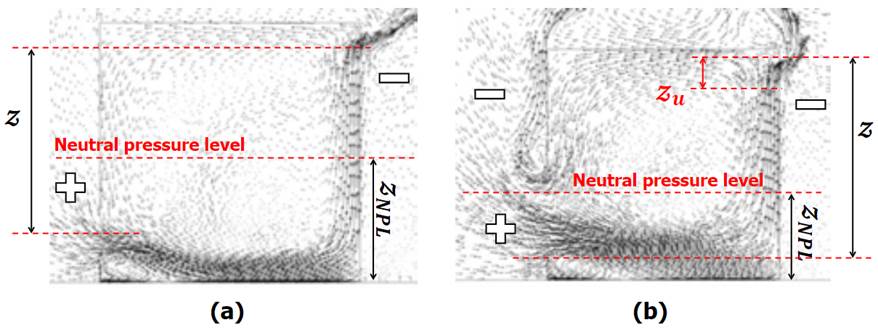
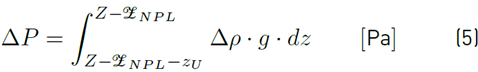
However, when the height of the openings is not negligible (case of large openings), the use of Equation (4) might lead to either an underestimation or an overestimation of this overall pressure difference. In this case, the overall pressure difference can be defined as in Equation (5), for the outgoing airflow [26,27]:
where Z represents the vertical distance from the lower edge of the lower opening (L) to the upper edge of the upper opening (U); with height z
U
[Figure 5 (b)). The vertical distance
 represents the height of the neutral pressure level (NPL), where the indoor-outdoor pressure difference is equal to zero, with respect to the floor. Different ways to determine this height have been reported in the literature [21,26,28]. For instance, the value of
 can be determined by Equation (6) [26]:
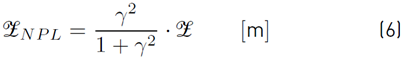
where γ is the opening ratio, as presented in Equation (7):
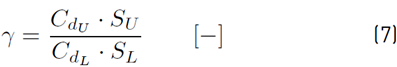
where C d and S represent the discharge coefficient and the effective opening area, respectively. This vertical distance depends on the position and height of the openings. For an enclosure with a single opening, the NPL will be established at half the height of this opening. For the same enclosure with another opening over the previous one on the same side, the NPL will be established at half the distance between these openings if they are of the same size. However, if they differ in size, the NPL will tend to get closer to the larger openings; and the height of the NPL is proportional to the square of the opening surface [21].
Air flow due to a combined effect
If placing the openings at the correct location, wind effects will join the thermal buoyancy effect, reinforcing the ventilation airflow rate. On the contrary, not placing them correctly or if the building is not correctly oriented, the wind will mitigate the thermal buoyancy effect reducing the building ventilation. This can be observed in Figure 6 (a), where the openings are correctly located, improving the airflow traversing the building. However, in (b), the openings are not correctly located, causing zero airflow (neutralizing both effects) at a specific wind speed value [21]. In this interaction, the wind turbulence effect is more important than in cross-ventilation configuration [29]. However, significant differences can be observed concerning the complexity of this interaction regarding theoretical or experimental approaches [30].
3. Estimation of the natural ventilation airflow rate
Depending on the natural ventilation strategy implemented, the natural airflow rate can be assessed using different methods. Such methods can be grouped into two categories: Modeling and experimental techniques. For the determination of the airflow rate, all modeling techniques require the knowledge of the airflow capacity of the openings employed. Thus, hereafter, we address this before in the following section.

3.1 Airflow capacity of an opening
Theoretical airflow-pressure relation
A theoretical Equation describing the airflow rate caused by a pressure difference between the upstream and downstream of an opening, can be written using Bernoulli’s equation as in Equation (8):
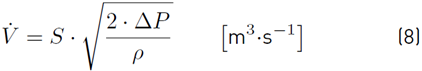
Where  represents the airflow rate in m3
・s−1 and S represents the area of free gap sections of the opening m2 (usually called effective area S
eff
). This Equation considers a non-frictional fully developed turbulent fluid flow through the opening. If needed, the friction characteristics of the opening can be grouped in a single coefficient named the discharge coefficient (C
d
) which multiples Equation (8) here before.
represents the airflow rate in m3
・s−1 and S represents the area of free gap sections of the opening m2 (usually called effective area S
eff
). This Equation considers a non-frictional fully developed turbulent fluid flow through the opening. If needed, the friction characteristics of the opening can be grouped in a single coefficient named the discharge coefficient (C
d
) which multiples Equation (8) here before.
Empirical airflow-pressure relation
Moreover, for any fluid flow through an opening, an empirical Equation representing the airflow rate caused by a pressure difference between the upstream and downstream of an opening has been shown to follow Equation (9):

Where
 is called the airflow rate coefficient in m3
・s
−1
・Pa
−n
.
is called the airflow rate coefficient in m3
・s
−1
・Pa
−n
.
Its value depends on the effective area of the opening, and considers its friction characteristics. The exponent n is called the flow exponent: it takes the value of 0.5 for a fully developed turbulent flow and 1 for a laminar flow [31]; for values in between, the flow is said to be partially developed. It has been shown that Equation (9) describes the best, the air-leakages rate of a room or a building, where it can be small and big holes due to imperfections [32].
Daler et al. in 1982, as found in [33], reported the airflow capacity of bottom and side hung openings, for different opening degrees and as a function of a room indoor-outdoor temperature difference [Figures 7-8]. One of these types of openings, the bottom-hung window (also known as tilted window), is the same as the ones implemented in our test building.
Discharge coefficient and effective area of an opening
This coefficient can be defined as the ratio of the empirical (or real) airflow rate to the theoretical (or ideal) airflow rate, translating the fact that the free gap area (or jet section) is smaller than the total area of the opening [34].
Various experimental studies have been interested in the dependence the discharge coefficient presents when the pressure around the opening varies. Flourentzou et al. in 1998 [27] performed tracer gas and velocity measurements in situ in a three-level stack ventilated building to determine the C d . A value of 0.6 ± 0.1 was found, and thus, it was stated that: the accepted value for the discharge coefficient was confirmed once again [Figure 9].
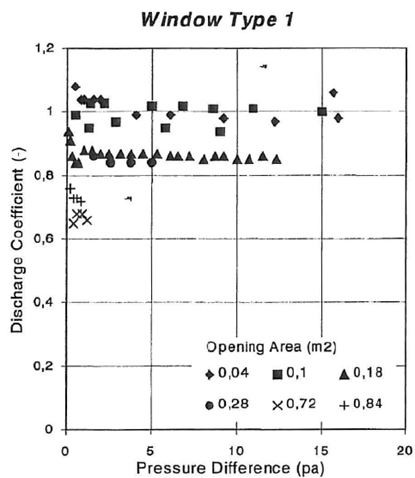
Heiselberg et al. in 2001 [35], performed airflow rate and pressure measurements at the opening in a laboratory set-up, and determined C d values for openings similar to ours, using Equation (8) [Figure 10]. It was concluded that the use of a constant value could lead to serious errors in the prediction of airflow capacity, because their experimental results showed that the discharge coefficient changed with the effective area and the type of opening, as well as, with the temperature difference. Also, for the three types of opening they tested, the value of the discharge coefficient slightly decreases as the pressure difference increases.
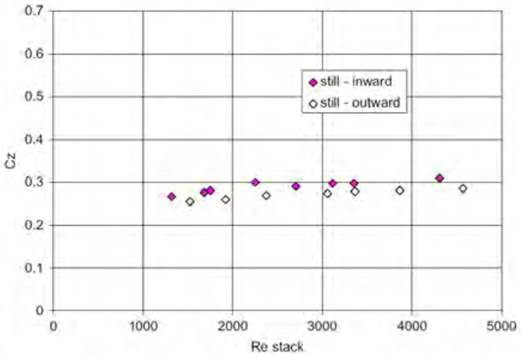
Costola and Etheridge in 2008 [36], performed pressure measurements in a scaled model in wind tunnel experiments, consisting of a stack and wind-assisted strategies. The scaled model included one small orifice at ground level and one stack opening at the top. They reported C d values (named C z ) for both the orifice and the stack opening, where the values of C d for the former resulted in around 0.7 for either still air, or wind-assisted (0° and 180°) strategies; similar to those in Figures 10 and 7. However, for the stack opening, C d values changed considerably depending on the Reynolds number, as shown in Figures 11 and 12, for still air and wind-assisted strategies, respectively. In the case of the still air strategy, the average C d value was used, and in the case of the wind-assisted strategy, an average value from the constant region (from a Re of about 600) was taken.
Moreover, [37] performed an experimental study with a wind tunnel using a scaled room model with several bottom-hung windows and Computational Fluid Dynamics (CFD) simulations. By determining the friction factor ξ v of the opening (S eff = 0.377 m2) to be equal to 28.9, a C d value of 0.67 was determined using Equation (10):

where S fo stands for the area of the entire section of the opening (1.82 m2). S eff represents the effective area of the opening. Van Paassen et al. in 1998 [38] proposed Equation (11) to define the effective area S eff as a function of the opening angle, for tilted windows (bottom hung or side hung):

where z and w represent the height and width of the opening, respectively, and ∅ represents the opening-angle (0 - 90°). The same Equation was used latter by[39] for bottom hung openings. Other ways to calculate this area can be encountered in [37,40]. Other models have been reported for the estimation of the discharge coefficient. The authors in [41], proposed an empirical model for C
d
as a function of the ratio between the heights of the opening (z) and the room
 , as presented in Equation (12):

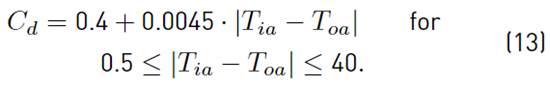
On the contrary, in [42], another empirical model for Cd is proposed as a function of the indoor-outdoor temperature difference, accounting for thermal buoyancy effects, as presented in Equation (13):
Moreover, a comparison of implementing these models, showing their impact on the natural airflow rate, can be found in [43], concluding that the estimation of this coefficient should be performed attentively. Nevertheless, to determine either the airflow capacity or the discharge coefficient of an opening, experimental data is needed. Thus, hereafter the experimental and modeling techniques employed to determine such characteristics of the openings.

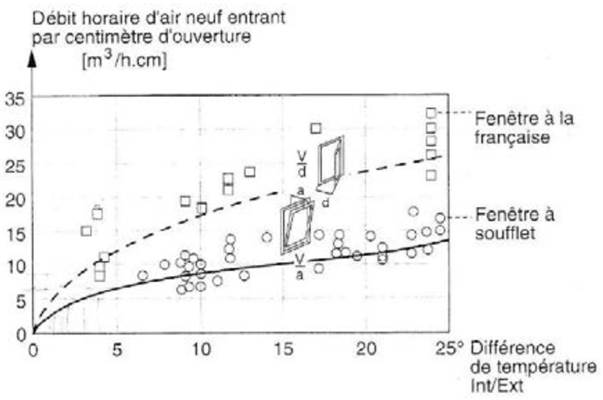
Figure 8 Variation of the airflow capacity of bottom and side hung windows as a function the indoor-outdoor temperature [33]

3.2 Experimental techniques and methods
Many experimental techniques have been developed/employed to determine the airflow rate in naturally ventilated buildings for the case of openings closed or opened. In this section, it is intended to present information about reported airflow rate levels attained for a given wind speed and direction, temperature difference, and the experimental technique employed. Nevertheless, we include the size and type of building and openings. A summary and comparison of these techniques are presented in Table 1.
The majority of the studies in the literature employed these techniques for cases with simple configurations, where the airflow path is well known (single-sided, cross, or stack ventilation). Thus, for cases where a building has a quite number of openings, the assumption of a specific airflow path is rendered moot.
Airtightness tests
Kronvall and Persily developed the K-P model, as found in [31], to estimate the annual natural air-leakage rate of a building using airtightness tests as in Equation (14):
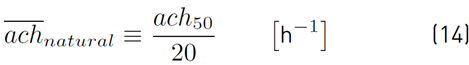
which later employed data from tests performed in more than 40 houses, and achieved the linear regression as in
Equation (15):

where ach50 referred to the value of ach at a pressure difference of 50 Pa measured via blower door tests.
Later on, this method was employed again to determine the air-leakage rate [44], performed nine in situ airtightness tests (or blower door tests) to estimate the air change rate at natural pressure levels of a full-scale building of volume. The air infiltration rate, for either windows closed and opened, was determined using the K-P model in Equation (14) [Figure 13].
Moreover, several in situ airtightness tests in the same passive building were performed, to determine the airflow characteristics of each opening [45-47]. As stated, such airtightness tests must be performed on no windy days, preferably. For the airflow characteristics, the following steps are proposed: (i) With openings closed, perform a number of airtightness tests to determine the infiltration airflow rate (air leakages); (ii) with openings opened (one by one or all at once for total building air change potential), repeat the tests (more than one blower door might be needed); (iii) using both equations (8) and (9), an Equation similar to Equation (9) can be drawn, where the value of C is determined from the first two steps. In this way, the airflow characteristics of all openings were estimated [Figure 14] and compared results with [44].
Direct air velocity, pressure and volume airflow measurements
This technique often requires several sensors due to a unique point of measurement possible at a time. Also, because of weak airspeed values resulted when indoor air is driven by thermal buoyancy, the sensors may require to be highly sensitive. Such highly sensitive sensors could strongly increase the budget needed to perform proper experimental studies. It should be noted that the smaller the effective opening area, the greater the perturbation the sensors may be introduced. However, after performing the measurements, a model is needed to translate the airspeed values to airflow values, which often requires certain characteristics not met regarding openings sizing and distribution. Nevertheless, various experimental studies can be found in the literature regarding such type of measurements [29,37,47-53].
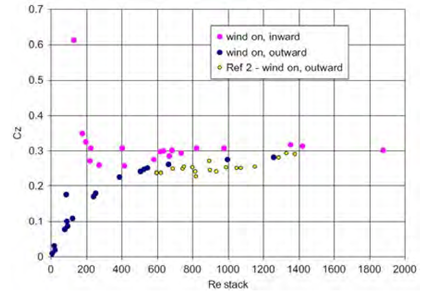
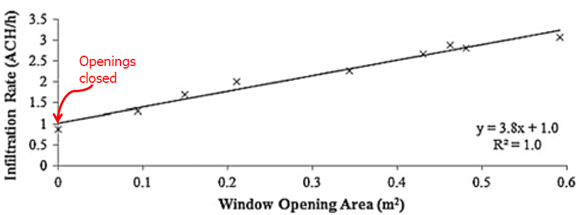
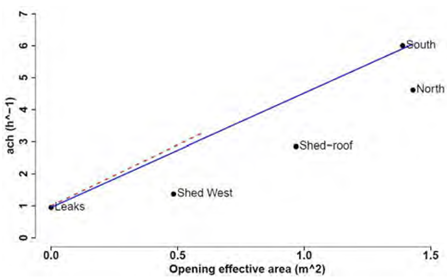
Figure 14 Results of ach as a function of the opening effective-area: red dashed line [44], and black dots [47]
The effect of wind on the performance of the stackc ventilation was studied by performing airspeed measurements in a full-scale building [29], proving that wind effects have a considerable influence that could change up to 350%. They reported air change rate values, for stack and wind only, and also reported the variation of the air change rate, with respect to the wind speed. The wind effects were also studied to estimate the natural ventilation airflow resulted from a cross-ventilation strategy in a full-scale building with a sizeable windward window and a small leeward window [49]. A conventional anemometer cup anemometer was installed at the windward window, and several omni-anemometers were installed at the leeward window. This leeward window was discretized, and the airflow was determined after a rather rigorous statistical model based on Artificial Neural Networks.
These types of omni-anemometers were also employed in another full-scale building study, where the indoor air movement was reported to be mostly driven by thermal buoyancy [47,51]. Airspeed values between 0.01 and 0.25 m・s−1 were reported near the floor and a height of 1.70 m from the floor.
Wind tunnel for scaled models
For natural ventilation, the implementation of the wind tunnel technique normally requires the development of reduced-scale building models that fit the test cavity. Most studies only implement such a technique for testing wind effects in individual scaled buildings [37,54-58]. However, this technique can be used to study the wind effects on building clusters [59].
The authors in [55] (in an enclosure of 748 m3) and, in [54] (in an enclosure of 93 m3), compared measured data from wind tunnel experiments with different existing models, aiming to evaluate and improve the existing models for the case of single-sided ventilation [Figures 15-16].
Tracer gas decay method
The airflow rate or the air change rate per hour can be determined directly using this technique [27,49,52,60]. As a standardized costume, the ”gas” chosen in this technique is often different from the common components of normal air (i.e., Argon, SF6), in this way, the components in the air may not interfere with the instrument implemented to measure the number of particles of such gas per unit time. Depending on the tracer gas chosen, the experimental protocol can be found in literature, where the accuracy of the method strongly depends on assuring a well-mixed of the tracer gas inside the building room.
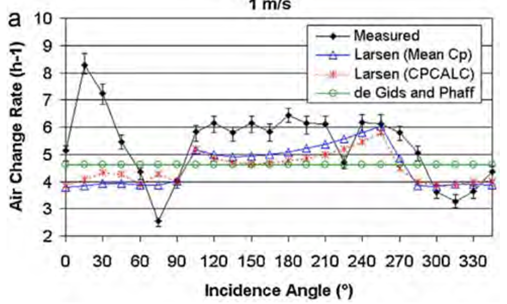
Figure 15 Comparisons between the experimental and simulation results performed into the Power Domus software for the wind tunnel case [55]
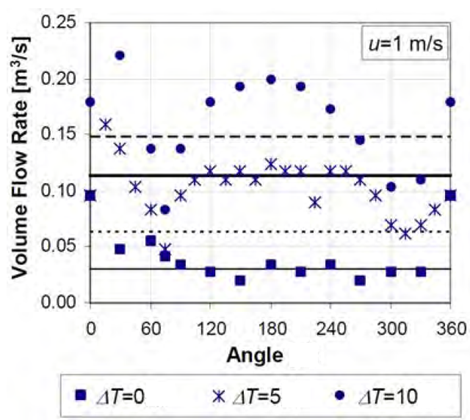
Figure 16 Measured and calculated volume flow rates: Warren & Parkins (black thin line), De Gids & Phaff (black dotted line, ΔT = 0 ◦C), and De Gids & Phaff (black thick line, ΔT = 5 ◦C)[54]
However, considering the natural ppm levels of ambient CO2, it might be a suitable and cheaper choice than other tracer gases. In fact, a study implementing this technique couple with others in a downscaled building, performed 15 infiltration tests reaching a CO2 level between 3000 to 10000 ppm [52]. The accuracy of such a method in the estimation of the airflow rate can reach acceptable values [60,61]. An accuracy of 20% when comparing an airflow estimated from airspeed measurements [27].
Scaled models and dimensional analysis
The combination of wind and buoyancy effects was studied in a small-scaled building-like, through the implementation of dimensionless numbers, where the use of a saline fluid to represent the air fluid resulted from the similitude principle from dimensional analysis [62].

3.3 Modeling techniques
The local estimation of the impact of wind effects on the natural airflow rate remains complicated in buildings with non-standard architectural features. These devices, forming part of the building envelope and being either openings or entire facades with a non-standard morphology, make it difficult to accurately take into account the effects of the wind on the instantaneous airflow rate. The reason lies in the need to know the values of the external pressure coefficients and the discharge coefficients of its opening, which are not always found in the literature for their consideration in the use of numerical airflow simulation tools.
Empirical correlations
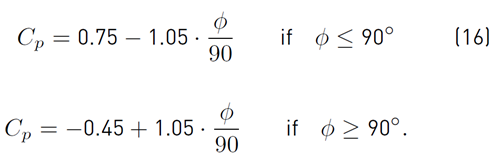
Many investigations have been undertaken for the estimation of this coefficient [25,55,64-66]. The authors in [64], presented Equation (16) empirical model for the determination of this coefficient as a function of the wind direction
 :
:
On the other hand, the authors in [65] and [66], proposed guidelines to determine the model for this coefficient depending on various geometrical parameters of the building and the wind incident angle. Swami and Chandra [65] reported in Equation (17):
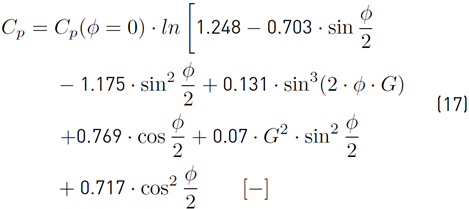
where (∅) goes from 0 to 180°; for higher angles are obtained by symmetry. G corresponds to the natural logarithm of the side ratio (ratio of the lengths of adjacent walls). For vertical walls, [65] recommend using a value of 0.6 for the pressure coefficient at zero incidence angle [55].
The authors [67], in their proposition for developing a new integrated design tool for naturally ventilated buildings, the wind effect on the proposed ventilation model took into consideration a fitted regression model for predicting C p values for each angle [Figure 17].
This regression model was fitted over C p values computed using experimental data from pressure measurements and the Equation for this coefficient presented in §2.2. This regression model is similar to Equation (17), but without considering logarithms, the parameter G, and the whole angle was considered.
Moreover, [68] developed an empirical model for the estimation of C p as a function of the wind incident angle by fitting regression models, as shown in Figure 18.
Nevertheless, all these models are applicable to buildings with simple rectangular geometries. For cases where other geometries should be taken into account, the standard EN 1991-1-4:2005 (Euro code 1) presents guidelines for the estimation of C p values.
Analytical and numerical approaches
Different analytical models have been developed and proposed for the determination of the natural airflow rate in terms of the driving forces, depending on the natural ventilation strategy implemented.
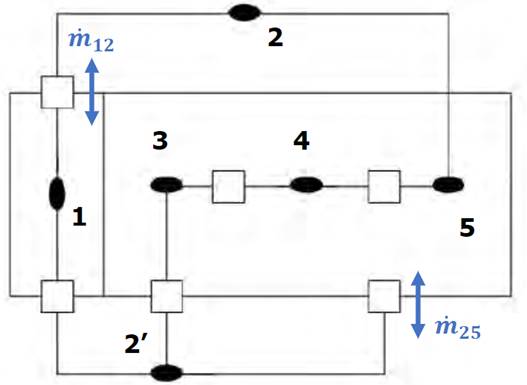
In [69] and later in [70], reported a review of natural ventilation models for simple opening configurations, and classified them in two groups: analytical and empirical models, and network models. The analytical models are developed by applying the conservation equations to a specific configuration. According to the network modeling concept, a building is represented by a grid composed of several pressure nodes and flow paths [Figure 19] [32]. These pressure nodes could represent the pressure of a single zone inside the building or the pressure of the exterior environment [Figure 19 black ovals). The flow paths represent each opening in the building, e.g., windows, doors, etc. [Figure 19 squares).
Bernoulli’s equation is then applied to relate every pressure node (taking into account a reference level). For instance, in the case of zone 1 (pressure node 1) assuming that the reference level is at the height of the flow path between nodes 1 and 2′, and the pressure is constant on the zone of each node, Bernoulli’s general equation yield (Equation (18)]:
and in the case where the flow path between nodes 1 and 2 is located at a height of Z2 with respect to the flow path between nodes 1 and 2′, then (Equation (19)]:

both Equations yield (Equation (20)]:
Finally, all flow paths of one zone are related by writing the flow conservation equation. For instance, if a steady state is considered, for pressure node 1 results in Equation (21):

The previous equation can be expressed in terms of pressure by using the Equation relating the flow rate through an opening at the power of n. The most common numerical method to solve the system of equations is Newton-Raphson’s method. Various software implementing network airflow models exists, where the most commonly used are COMIS, CONTAM, Energy Plus, and ESP-r [25,69].
Moreover, a study combining the analytical, empirical, and network models uses CONTAM to evaluate the influence of the location of air infiltration (or air leakages), on the global airflow rate estimated [47]. Here, this study evaluated the location of air infiltration by performing separate tests for accounting individually, the wind effects, and thermal buoyancy effects. Results showed that the location of the air-leakages has no apparent influence on the results given by the CONTAM software.
In cases where the indoor air movements due to a temperature difference can be approximated to a phenomenon named displacement ventilation, analytical models can be found in the literature for simple building geometries with a heat source at the bottom of the building. The authors in [71] developed modify two analytical models to study the transient natural displacement ventilation in a simple building geometry. These two models were compared with the Kaye and Hunt’s model (KH), where the assumption of a well-mixed indoor air is made. Moreover, these three models are confronted with experimental data, where the two developed models (with a relative deviation of 4.2% and 4.6%, respectively) had shown to perform better than the KH model.
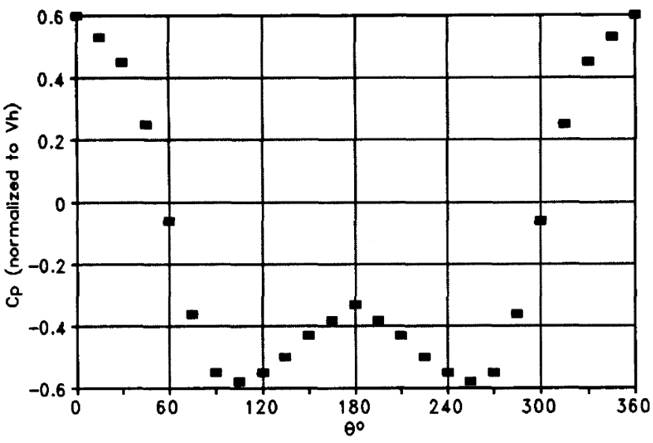
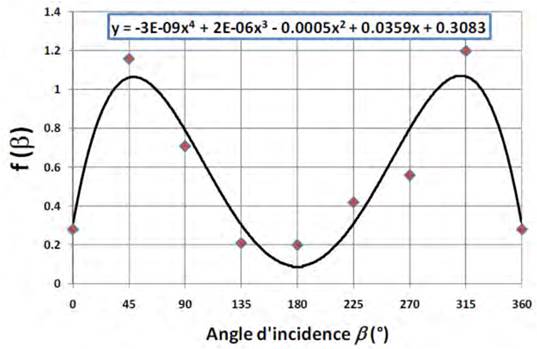
Figure 18 Fitted regression model over experimental data of a coefficient regarding wind effects as a function of the incident angle [68]
Source: Santamouris (1998)
Figure 19 Example of a network airflow modeling applied to a multi-zone building [32]
Another analytical approach found in literature is the electrical analogy approach, which is also employed for network airflow paths, avoiding the use of the Newton-Raphson’s method. This electrical analogy approach is based on an equivalent airflow resistance where the assumption that airflow paths are considered as capacitors [11], as shown in Figure 20. The equivalent airflow resistance of the example shown in Figure 20, results in the following Equation (22):
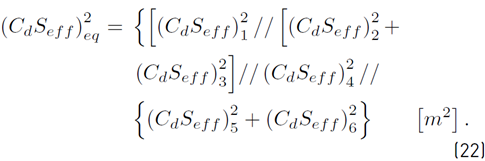
in this Equation, the windows are assumed to be of the same type, and thus, to have the same discharge coefficient.
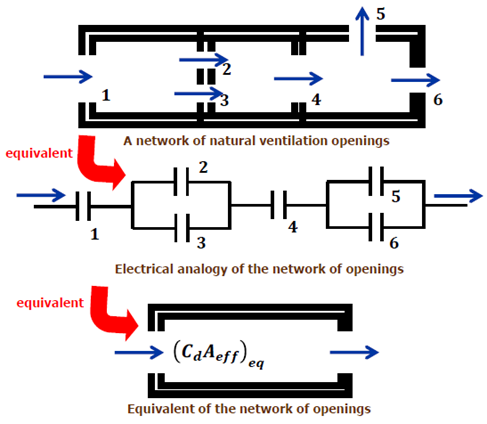
An experimental study compared results from blower door experiments (using Equation (9)], and a model that uses this electrical analogy approach is presented in [45]. The airflow path network consisted of 10 openings distributed along the North and South facades, where the North-facing openings were of different sizes of those at the South facade. Here, the indoor air movements were assumed only to be driven by thermal buoyancy, and since only a night natural ventilation strategy was applied, the lower openings were considered as inlets, and the higher openings were considered as outlets. Results showed that a relative deviation of about 7% was obtained between theoretical and experimental results.
Finally, apart from the software mentioned before that allows us to solve the analytical models as the network airflow path models, software capable of performing integrated CFD simulations are Open studio, Design Builder, Envimet, and Comsol.
4. Discussion
We have covered the basics for comprehending the natural ventilation concept. We have briefly reviewed the experimental and modeling techniques already implemented for past researchers, in the estimation of the ventilation airflow rate due to the wind and thermal buoyancy effects. This literature review has allowed noticing that the location of the air-leakage/infiltrations must be analyzed attentively, to avoid overestimation or underestimation of the air-leakage rate.
The experimental techniques require heavy instrumentation (often expensive) of the openings in terms of airspeed and pressure measurements (local), being the ones that could lead to a better understanding of the phenomena involved in the ventilation process. The modeling techniques such as CFD require substantial computation time depending on the computer power and the models themselves. The other models, popular like the openings network, do not require as much computational time as the latter. The models based on empirical observations require knowledge of the airflow patterns within the building.
Regarding the experimental and modeling techniques for estimating the ventilation airflow rate, a limitation arises in their applicability depending on the following aspects in order of decreasing importance: The level of detail required in the study, funding availability, building geometry complexity (due to C p values), openings type (due to C d values), and openings distribution (due to the difficulty in determining the inlets and outlets).
The most suitable experimental technique seems to be the airtightness tests since it allows us to obtain empirical Equations relating the ventilation airflow directly to the pressure difference in the building for both cases: infiltrations (openings closed) and openings opened. Also, the location of the leakages can be identified without complications, and this technique has the potential to estimate in situ the airflow capacity and friction characteristics of the openings.
5. Conclusion
This work has covered the fundamentals for understanding the natural ventilation concept in buildings and the main three driven forces causing indoor air movements: wind effects, thermal buoyancy effects, and the concentration of contaminants and moisture. Mainly, this article focuses on the airflow estimation techniques implemented by former researchers, specifically the experimental techniques. Such experimental techniques reviewed include the blower door tests, direct air velocity, and pressure measurements, wind tunnel for scaled models, tracer gas decay method, and scale models with dimensional analysis. The modeling techniques briefly reviewed include empirical correlations and analytical approaches.
Concerning the experimental and modeling techniques for estimating the ventilation airflow rate, a limitation arises in their applicability strongly dependant on the level of detail required in the study and the funding availability. The adequate benefit-to-budget technique appears to be the blower door tests, since empirical Equations relating the airflow directly to the pressure difference in the building for both cases: infiltrations (openings closed) and openings opened, can be obtained. Also, the location of the leakages can be identified without complications, and this technique has the potential to estimate in situ the airflow capacity and friction characteristics of the openings.

