


 English (pdf)
 Article in xml format
 Article references
 Send this article by e-mail
 Cited by SciELO
  Cited by Google
  Similars in
SciELO
Similars in
SciELO  Similars in Google
 Permalink
Introduction
Amazonia is the region of northern South America around the Amazon River that includes the greater part of Brazil and the bordering parts of Colombia, Ecuador, Peru, and Bolivia 1. It encompasses the world’s largest rainforest and is highly biodiverse, housing approximately a quarter of all terrestrial species in the world. The diverse vegetation in this region plays a crucial role in supplying oxygen on a continental scale. However, due to deforestation and human activities that cause desertification, Amazonia is increasingly becoming a source of carbon dioxide and overall greenhouse gas emissions, which causes increases in air temperature. It is considered to be the second most vulnerable area on Earth after the Arctic. Jungles and forests cover about 45 % of the Colombian territory, and include the jungles of the Pacific and Amazonic regions and the remnants of the Andean, the Caribbean, and Orinoquía jungles 2.
At both the national and continental levels, the Colombian Amazon basin plays a vital role in providing ecosystem services related to water and carbon. Ecosystem services are defined as the benefits that human beings obtain from ecosystems (i.e., biological systems constituted by a community of living organisms and the physical environment in which they are situated). According to 3, the main ecosystem services in the Colombian Amazonia, as identified by the local people, are of two types: provision and support. The first type corresponds to the supply of wood, straw, resins, wild fruits, fish, animals for hunting, natural medicines, and materials for handicrafts, traditional tools, and ornaments. The second type corresponds to the soil conditions necessary for the practice of traditional agriculture.
Additionally, some of the main ecosystem services in the Amazonia, as identified by the scientific community, are carbon storage regulation, protection against extreme events such as landslides 4, climate regulation 5, and hydrological services. Water for agriculture, navigation, industry, fisheries, and human consumption are part of the ecosystem services provided by these forests through the regulation of regional water and energy balances. Furthermore, there is great interest in beginning to exploit water resources in the Colombian Amazonia for hydroelectricity production 6.
Among the studies that have analyzed the meteorological and climatological aspects of Amazonia are 7, 8, and 9. The first analyzed the spatial-temporal variability of water balance components in the Amazon region using observations and data from the NCEP/NCAR reanalysis 10 for the 1970-1999 period. The second evaluated the transferability of the Regional climate model REMO 11 with a standard setup over different regions of the world. REMO was integrated over six domains, one of them being South America, finding significant temperature overestimation over Amazonia and near the coasts of major upwelling regions. The third evaluated the capabilities of a set of seven coordinated regional climate model (RCM) simulations to reproduce the mean climate conditions over the South American continent. The analysis focused on evaluating the reliability of simulating mean precipitation and surface air temperature. The evaluation considered the seasonal means, the area-averaged annual cycles, and the frequency distributions of monthly means over target sub-regions, among them the region defined approximately between 5◦ and 15◦ S and 50◦ and 65◦ W and named South Amazonia (S-Amazonia). 9 found that the multi-model ensemble exhibits high uncertainty (as defined by the standard deviation of the models) and high bias regarding tropical regions across South America (including S-Amazonia), which suggests the low reliability of RCM simulations and limited capabilities in reproducing observed climate conditions for both temperature and precipitation in these regions.
12 estimated the water balance in the Amazon River basin with data from the ERA-40
reanalysis 13 and the observational products CPC 14 and GPCP 15 for the 1980-2002 period. Their work evidenced the importance and necessity of a deeper analysis in each one of the countries that share the basin.
There are currently few studies that address the evaluation of reanalyses and climate models for Colombian territory, and even less in relation to the hydrological cycle. Some studies carried out by Instituto de Hidrología, Meteorología y Estudios Ambientales (IDEAM) show maps for the entire country regarding some important variables for the evaluation of water and energy balances upon the basis of observed data 16), (17. However, these studies fail to address the actual evaluation of water and energy balances or that of reanalyses and climate models. The studies by 18), (19, and 20 address these issues in the Colombian Pacific and Caribbean Basins but do not encompass all Colombian catchment areas. In this work, the Colombian Amazon Basin (CAB) was analyzed.
The Colombian Amazonia has a surface area of approximately 470.000 km2 21. However, the spatial distribution of its meteorological stations is not uniform and is almost non-existent in the departments of Guanía and Guaviare (Fig. 1). Therefore, regional climate models and reanalyses should be useful in providing substantial information, particularly in these remote regions with little observational data. This study focuses on assessing the terrestrial branch of the water and energy balances of REMO and four reanalyses (ERA40, ERA-Interim 22, NCEP/NCAR, and NCEP-v2 23) for the CAB. The annual cycle, the interannual variability, the extreme values of air temperature and precipitation, and the relationship between the extremes and the phases of ENSO (El Niño Southern Oscillation) are also analyzed.
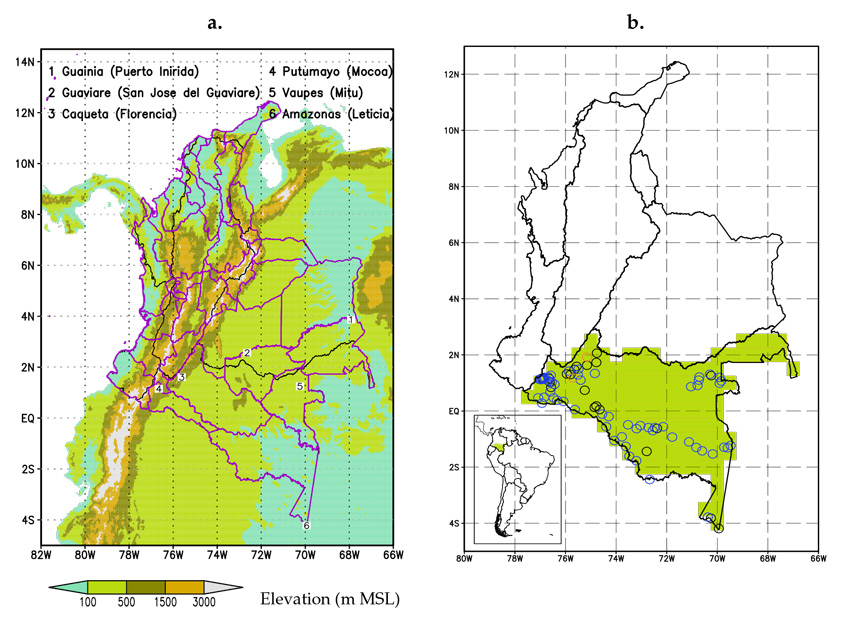
Figure 1 Study area. a) Political map, basins, and topography of Colombia. Purple lines are the departments, and black lines denote the basins. These overlap in several cases. The numbers represent the geographical location of the capital cities of the departments within the CAB. The department names are listed, as well as the capital cities in parentheses (San Jose de Guaviare and Puerto Inirida are not within the CAB, but part of their departments are). b) Basins of Colombia. The location of the CAB is represented in green in a 0,5◦× 0,5◦ grid. As in the map of panel a), the black lines indicate basins.
Section 2 details the study area, the main characteristics of the datasets used, and the methodology. Sections 3 and 4 provide the results, and Section 5 presents the discussion and draws conclusions.
Study area, data, and methodology
Study área
The CAB comprises territory of the departments of Amazonas, Caquetá, Guainía, Guaviare, Putumayo, and Vaupés (Fig. 1). The hydrological resources of the CAB and other basins are summarized in 17. According to this study, the CAB has an average water yield of 81 L/s·km2, which is eight times the world average (10 L/s·km2) and about four times the average yield of Latin America (21 L/s·km2). The CAB has the highest percentage regarding the annual water supply and the distribution of the river flow in the country,i.e., approximately 39 %. As is typical throughout the basin, there is a wide tropical forest that covers a third of the Colombian territory, containing a great variety of ecosystems and great biodiversity. In the CAB, in the foothills of the Eastern Mountain Range, the Orteguaza and Yari Rivers are born, which are tributaries of the Caquetá River, considered to be the mightiest in Colombia. There are also rivers like the Apaporis, which flows into Colombia’s border with Brazil and is born at the center of the Colombian Amazonia. The Caquetá, Putumayo, Caguán, and Yari Rivers amount to 29 % of the water discharged into the Amazon River in Colombia, and the remaining 71 % are born in the Colombian Amazonia plain, as a consequence of the high precipitation in this area, which includes rivers such as the Apaporis and the Vaupés. With respect to water yields, values between 60 and 100 L/s·km2 have been found in the Caguán, Caquetá, Yari, Apaporis, Vaupés, Napo, and Guainía Rivers, as well as values above 100 L/s·km2 in the Orteguaza, Pescado, Sencella, and Putumayo Rivers.
Circles indicate the location of the stations selected in this study. Orange circles correspond to stations that measure temperature, blue circles to the stations that measure precipitation, and black circles to the stations that measure both temperature and precipitation.
The climates of Colombia are summarized in 16. Different classifications are presented therein, among them those of Martonne, Holdridge, and Koeppen. According to the climatic classification of Martonne, the climate of the CAB is between humid and humid rainy. According to the classification of Koeppen, the climate of the basin is of the tropical rainforest type. In the Holdridge climate classification, the climates are humid warm almost everywhere and very humid warm in part of the northwestern sector of the department of Putumayo, as well as in the northeastern part of the department of Amazonas.
According to 16, most of the Colombian Amazonia receives rainfall between 2.000 and 4.500 mm per year, and there are between 200 and 250 rainy days in the departments of Caquetá, Amazonas, Vaupés, and Putumayo. Towards the piedmont, there can be up to 300 days of rain per year. The region experiences a single annual peak in precipitation. However, the regime is different on each side of the terrestrial equator. To the north, the maximum precipitation value occurs in the middle of the year, and, in the south, towards the first months of the year.
In the north, there is a minimum of precipitation in January and February, and, in the south, in July and August. In both cases, months with more than 15 days of rain may occur. Due to the homogeneous physiography of the region, there is little spatial variability in the temperature; in most of the CAB, temperatures typically range from 24 to 28 °C. Towards the piedmont, there is greater variability. The average temperatures fluctuate between 12 and 20 ◦C and depend on the elevation above sea level. In Fig. 1a the five basins of Colombia and the topographic characteristics of the study area are shown. Fig. 1b depicts the geographical locations of the stations in the CAB which were selected for this study.
Data and methodology
The monthly mean fields of surface temperature, precipitation, and the variables involved in the water and energy budgets of several state-of-the-art datasets were analyzed in order to assess how well they represent the climatological characteristics of the study area. To facilitate the comparison of meteorological variables of interest, all gridded datasets (observational products, reanalyses, and the regional model) were transformed into a 0,5◦ × 0,5◦ spatial grid, which was symmetrical with respect to the Earth’s equator. All this, through the conservative first- and second-order remapping method proposed by 30.
Reanalysis data
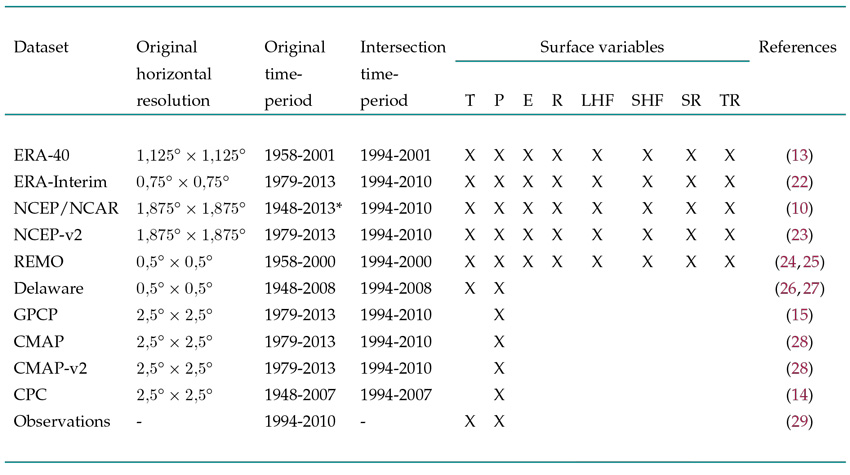
Reanalysis products combine observations with simulations using state-of-the-art numerical models. Computer models are run to simulate many decades, with observed fields incorporated into the model at the time they were observed to produce a reanalysis climatology, i.e. data assimilation is used in generating climatology. Winds and temperatures are assimilated variables and are therefore accurate. Other variables, as is the case of precipitation and evaporation, may not be as reliable, since they are model-dependent outputs 31. Table Ipresents a summary of the datasets and the variables considered in this study. In the table, the variables are classified according to the influence of the observations. Free-access data from observations and from the NCEP/NCAR, NCEP-v2, ERA-40, and ERA-Interim reanalyses was included in this study.
Table I Datasets and variables considered in this study. The variables are temperature (T), precipitation (P), evapotranspiration (E), runoff (R), latent heat flux (LHF), sensible heat flux (SHF), solar radiation (SR), and thermal radiation (TR). The availability of each variable is indicated by the ’X’ symbol. The variables strongly influenced by observations are shown in blue, and those strongly influenced by the reanalysis or by the model are shown in red. *The energy balance for the NCEP/NCAR dataset was determined for the 1948-2012 period because the SR and TR variables were only available until 2012.
Reanalyses are regarded as climate databases with a wide range of applications. They are commonly used in studies with restricted observational data. In spite of their virtues and scientific popularity, they have limitations related to climate representation, and their quality varies on a regional basis 32. The National Centers for Environmental Prediction (NCEP)/National Center for Atmospheric Research (NCAR) 10 and the European Centre for Medium-Range Weather Forecasts (ECMWF) 33 have carried out the two main global reanalysis projects. NCEP/NCAR has two reanalysis versions: the NCEP-1 Reanalysis (hereafter NCEP/NCAR) and the NCEP-2 Reanalysis (hereafter NCEP-v2). Although NCEP-v2 is a rerun of NCEP/NCAR, with the same horizontal and vertical resolution and input data, it improves the physical process and corrects known errors in NCEP/NCAR 23. For example, existing issues with orography are improved by correcting Gibbs phenomena such as precipitation, especially in the case of the Amazon basin 23. Despite these improvements, NCEP-v2 is not a next-generation reanalysis and is regarded as an updated and improved version of NCEP/NCAR.
In contrast to NCEP-v2, ERA-Interim is considered to be a second-generation reanalysis since it includes an assimilation system based on a four-dimensional variational data assimilation (4D-VAR) approach, which more efficiently uses available observations but is computationally intensive and more complex than the three-dimensional variational data assimilation (3D-VAR) used by ERA-40, NCEP/NCAR, and NCEP-v2 22. The list of variables that are assimilated in ERA-40 and ERA-Interim are presented in 34, and the variables assimilated in NCEP/NCAR are presented in 35.
Reanalyses use either an incremental updating technique or a four-dimensional data assimilation system. These techniques allow the analyzed fields to evolve smoothly in time, instead of exhibiting jumps at times of analysis. This largely eliminates the spinup problem of the hydrological cycle. However, these techniques preclude reanalyses from satisfying physical closure constraints in the wáter or energy cycles 36.
Regional climate model REMO
The REMO model was developed by the Max Planck Institute for Meteorology in the context of the BALTIC Sea Experiment 24, BALTEX;). This regional model has two main components: a physical parameterization scheme from the ECHAM4 global climate model and the dynamical component given by the numerical weather prediction model of the German Weather Service (EUROPA-MODELL). REMO is a suitable model for climate studies, and it has been widely used in Europe and many other regions around the world 25), (37), (38. An important characteristic of REMO is that it is designed to meet the water and energy balance closures. The data used in this work correspond to a climate model simulation for South America in the 1958-2000 period, with boundary conditions provided by ERA-40.
The same simulation was analyzed by 25.
Gauge and merged satellite-gauge products
Most temperature and precipitation observational products may be categorized into one of three broad categories: gauge datasets, satellite-only datasets, and merged satellite-gauge products. The Delaware 26), (27 and the Climate Prediction Center 14, CPC;) datasets belong to the first category, and the Global Precipitation Climatology Project 15, GPCP;) and the CPC Merged Analyses of Precipitation (CMAP and CMAP-v2) datasets belong to the third one. CMAP merges gauge and satellite observations, and the NCEP/NCAR reanalysis and CMAP-v2 include the same inputs except for reanalysis precipitation 28.
Observations and methodology
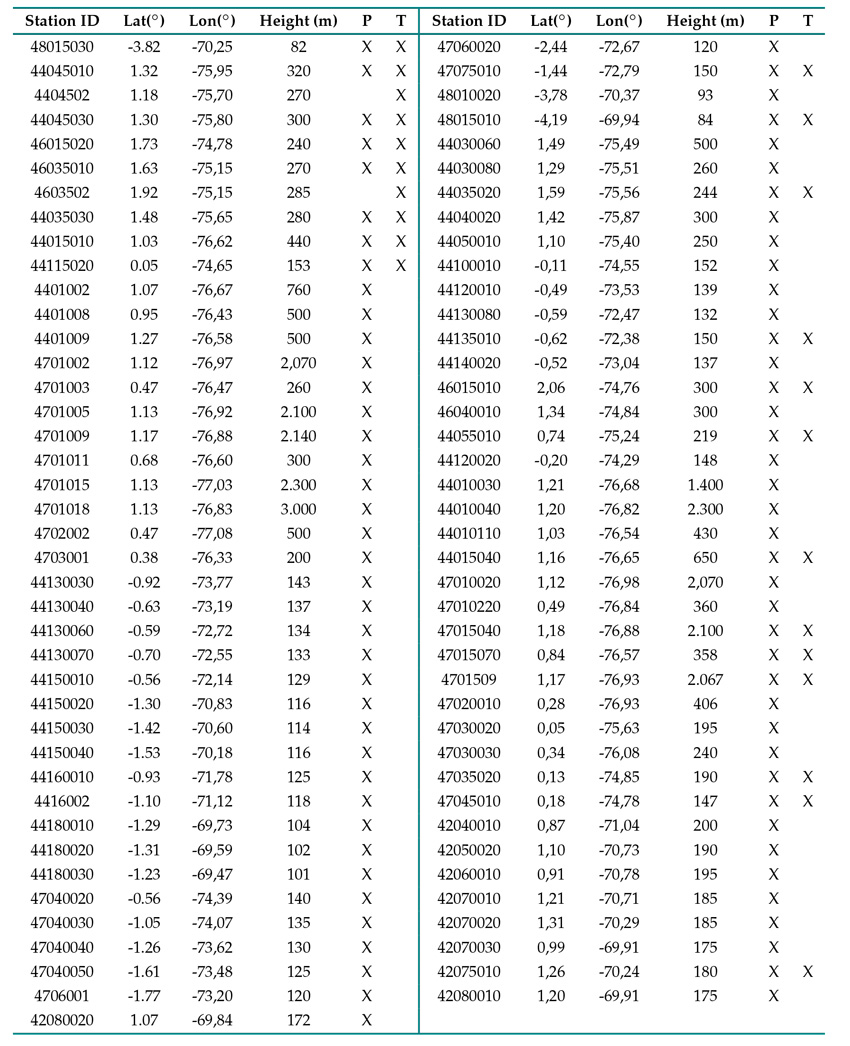
Table II lists the in situ stations considered in this study. The in situ data were obtained from 29 and were taken as a reference or point of comparison for the gridded datasets. In light of this, the methodology proposed by 39 was used. According to this methodology, the observations of each of the stations were compared with four to nine neighboring boxes of the gridded data. The comparison consisted of contrasting the value observed at the station against the average value of four to nine grid boxes. It was necessary to include a 6 ◦C/1000 m height correction for the temperature variable in the gridded data (40), since the compared meteorological stations were located at different heights, while the temperature values of the different datasets corresponded to heights determined by the topography considered in the underlying atmospheric model. For the analysis, only the observations of the in situ stations located inside the CAB were taken into account. The number of stations used was 81 (Table II). The neighboring boxes of the gridded data were also located in the basin or within the macro-basin of the Amazon River. This meant that the grid boxes of areas bordering Colombia in countries like Brazil, Ecuador, and Peru were also taken into account. The height difference between the stations and the model could not be greater than 1.000 m. This method of point-to-point comparison allows for ’comparable regions’.
Table II Characteristics of the in situ stations included in the analysis of the CAB. For each station, the international code (Station ID), latitude (Lat), longitude (Lon), height (masl), precipitation (P), and temperature (T) are shown. The availability of each variable is indicated by an ’X’. The in situ data were obtained from 29.
Additionally, a date-to-date comparison was made. This was done because the in situ stations had a high percentage of missing data. The date-to-date comparison consisted of taking exactly the same dates with both in situ data (daily temporal resolution) and data for the gridded datasets that were available or could be calculated with a daily temporal resolution (ERA-40, ERA-Interim, NCEP/NCAR, and NCEP-v2). From these daily values, the monthly averages corresponding to each dataset were calculated, thus obtaining a fairer comparison. For the REMO, Delaware, CPC, CMAP and CMAPv2 gridded datasets, only a point-to-point comparison was performed using monthly values, since these data only had this temporal resolution.
The climatological characterization of the CAB through the precipitation and temperature variables was performed by means of statistical analysis. For each year, the annual mean and annual anomalies were taken into account. For each month of the year, the mean, bias, and interquartile range (IQR) were calculated. The anomalies of each dataset were calculated as the difference between the annual means and the average of the whole period (1994-2000, i.e., the time period corresponding to the observations), and the bias was obtained as the difference between each dataset and the values obtained with the observations.
Results
Figs. 2and 3 present a comparison between the observations and the different datasets considered for the temperature and precipitation variables in the CAB. The annual means are presented for the periods available in each dataset (column 3 in Table I). Regarding the annual cycle, anomalies, bias, and interquartile range, the results correspond to the 1994-2010 period. For the datasets that did not have information on the entire range of the selected period, its period of intersection (column 4 in Table I) was taken. In addition, Table III shows a numerical summary with the averages of the monthly means of the annual cycle and the averages of the monthly biases of temperature and precipitation for the analyzed datasets.
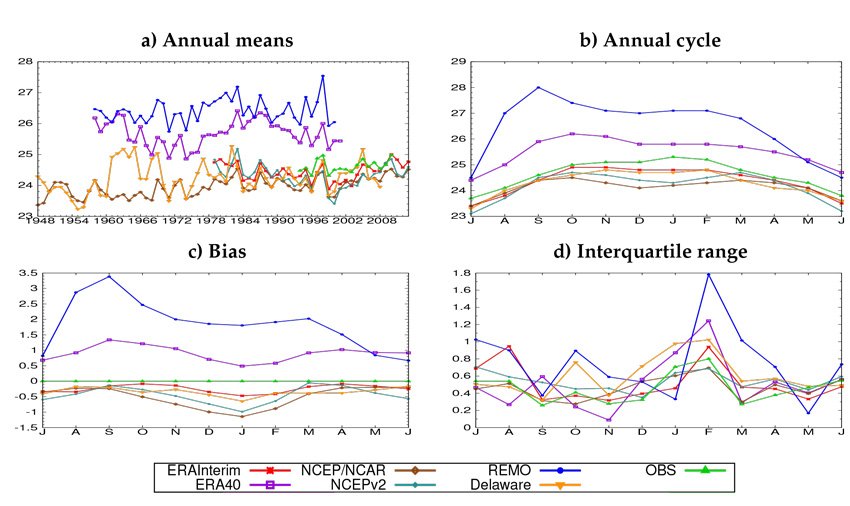
Figure 2 Temperature analysis of the CAB. a) Annual means, b) mean annual cycle, c) bias, and d) interquartile range. The units of measurement are ◦C. Annual means are presented for the periods available in each dataset (column 3 in Table I). The mean annual cycle, bias, and interquartile range are presented for the periods in column 4 in Table I.
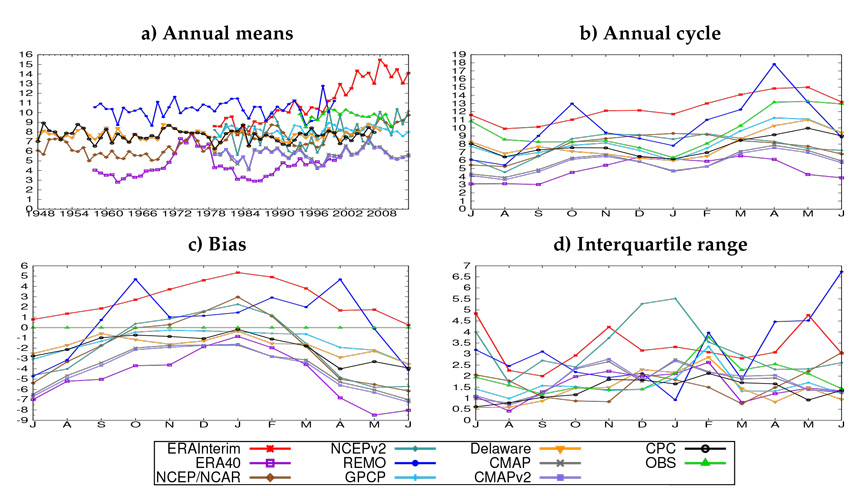
Figure 3 Precipitation analysis of the CAB. a) Annual means, b) mean annual cycle, c) bias, and d) interquartile range. The units of measurement are mm/day. Annual means are presented for the periods available in each dataset (column 3 in Table I.
Temperature
Regarding the observations, the REMO and ERA-40 datasets overestimate the temperature in both the annual means and the annual cycle. In contrast, the other datasets underestimate it (Figs. 2a and 2b). As for the annual cycle, observations show a clearly unimodal behavior, with a minimum in June-July and a maximum in December-February). The variation range is between 23,7 ◦C and 25,3 ◦C. This implies a small range of variation of 1.6 ◦C in temperature throughout the year. It is important to clarify that, due to the geographical distribution of the in situ temperature measurement stations, there is a significant bias in the dataset. Approximately 78 % of these stations are situated north of the equator and west of 73° W, resulting in a pronounced bias toward the northwestern region of the CAB (as illustrated in Fig. 1b and detailed in Table II). When evaluating different datasets (Delaware, ERA-40, ERA-Interim, REMO, NCEP/NCAR, and NCEP-v2), it becomes apparent that some (Delaware, ERA-40, ERA-Interim) align closely with the observed unimodal pattern in the annual cycle, while others (REMO, NCEP/NCAR, NCEP-v2) deviate from it.
The datasets closest to the observations are ERA-Interim and Delaware. These datasets also have an intra-annual range of variation of about 1,6 ◦C. The most variable datasets were REMO and ERA-40, with approximate ranges of variation of 3 ◦C and 1,8 ◦C respectively. This is evidenced in Fig. 2 c and agrees with the values obtained for the temperature bias in Table III. On the other hand, the various datasets showed a different month-to-month behavior regarding the dispersion of temperature values (Fig. 2d), which was estimated with the interquartile range (IQR), a resistant and robust statistic. REMO had the greatest variability in the CAB.
Fig. 4 shows long-term mean temperature maps for the observations and the different gridded datasets. The observed temperature varied mainly between 23 and 26 ◦C. The lowest temperature values were observed in the area west of 76,5◦ W. All gridded datasets showed the lowest temperatures in that area. However, REMO and ERA-40 showed a predominantly positive bias (or overestimation) throughout the basin, while ERA-Interim, NCEP/NCAR, and NCEP-V2 exhibited a predominantly negative bias (or underestimation). This is consistent with the values shown in the graphs of panels a, b, and c of Fig. 2.
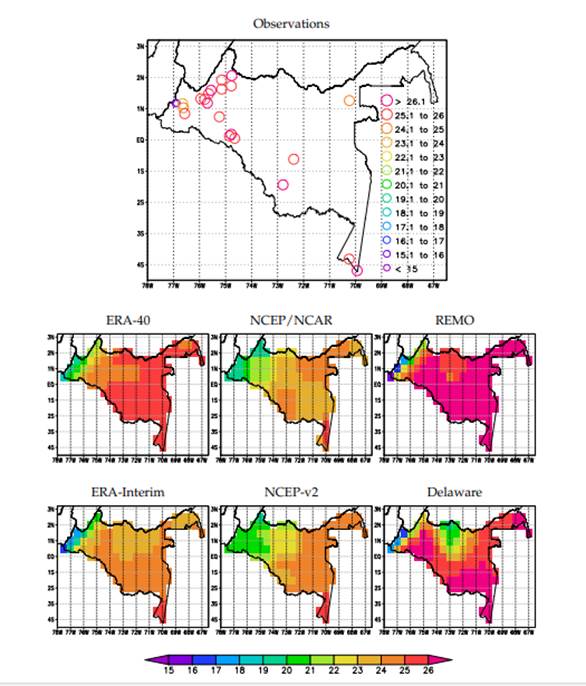
Figure 4 Long-term mean temperature reported by observations, ERA-40, ERA-Interim, NCEP/NCAR, NCEP-v2, REMO, and Delaware in the CAB for the periods shown in column 4 of Table I. This is expressed in
Precipitation
Precipitation observations show a predominantly unimodal annual cycle, with a maximum in April-May-June and a minimum in January. However, since 63 % of the in situ stations that measured precipitation and were available for this study are located north of the equator, there is a bias in the information towards the northern zone of the CAB (Fig. 1b, Table II). The range of intra-annual variation was between 13.3 mm/day in May and 6,3 mm/day in January and the average anual cumulative value is 3,540 mm.
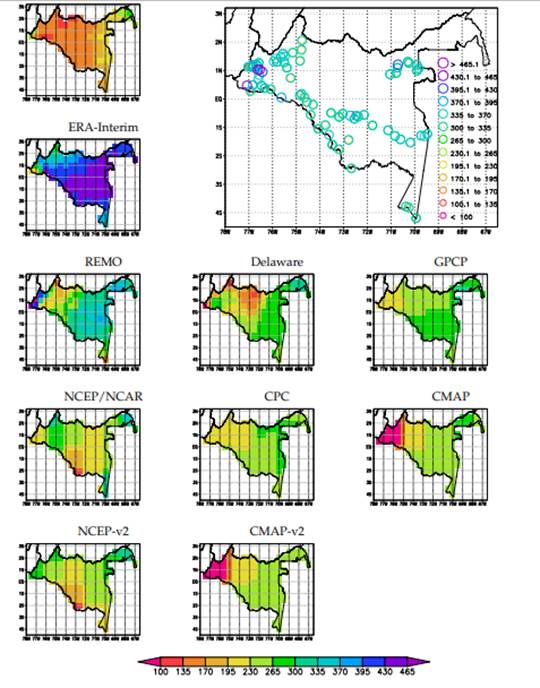
Figure 5 Long-term mean precipitation (mm/month) reported by observations, ERA-40, ERA-Interim, REMO, NCEP/NCAR, NCEP-v2, Delaware, GPCP, CMAP, CMAP-v2, and CPC the in CAB for the periods shown in column 4 of Table I.
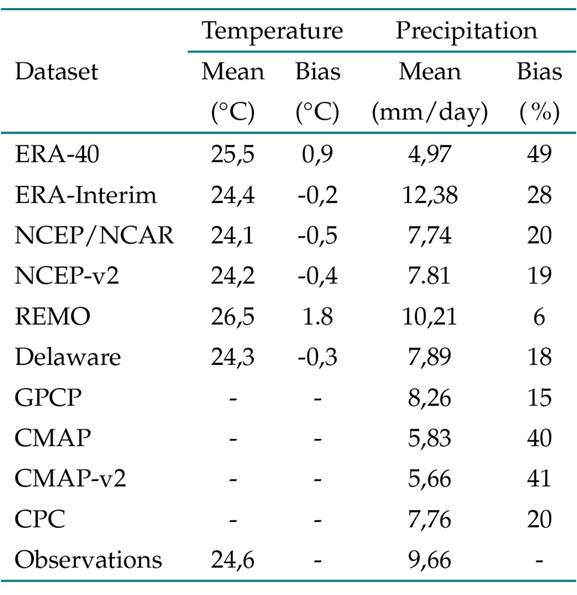
Table III Average of the monthly means of the annual temperature and precipitation cycle in the CAB for the different datasets considered. To calculate each bias, the reference value is that corresponding to the observations. The bias is in ◦C for the temperature and expressed as a percentage for the precipitation.
All observational products, along with ERA-40, consistently underestimated precipitation year-round, as depicted in Figs. 3a, 3b, and 3c. Specifically, ERA-40 reported its maximum underestimation in May, with a peak difference of 8.5 mm/day, and its minimum value in January, with just a 1 mm/day difference. In contrast, ERA-Interim consistently overestimated precipitation, reaching its highest difference in January, at 5.3 mm/day, and its lowest in June, with a minimal difference of 0.02 mm/day. On the other hand, REMO showed a pattern of overestimating precipitation from September to April, underestimating it during the remaining months. NCEP/NCAR and NCEP-v2 consistently overestimated precipitation from November to February while underestimating it in the remaining months. ERA-Interim exhibited a noteworthy trend of increased precipitation, with a rise of 2 to 3 mm/month over the last few decades in its available data period, a phenomenon not observed in the actual measurements.
As for the modal character of the annual cycle, REMO, CMAP, and CMAP-v2 described a similar behavior, which was very different from that of the observations. None of these three datasets clearly showed the unimodal character presented by the observations. On the contrary, they were more inclined towards a bimodal regime (Fig. 3b).
On the other hand, the NCEP/NCAR and NCEP-v2 reanalysis described a monomodal cycle that was out of phase and with a very short dry season. Fig. 3c shows that the dataset that best describes the annual cycle is GPCP, followed by Delaware and CPC, although all three exhibit negative bias. This is not fully evident in Table III, since REMO had the lowest percentage of bias in the calculation of the intra-annual average, despite the fact that it was a dataset with a bimodal annual cycle, which has periods of underestimation and overestimation throughout the year. With respect to the dispersion of values for each month, GPCP showed the highest agreement with the observations. However, in general, there was no agreement between the different datasets considered (Fig. 3d).
Fig. 5 shows the long-term mean precipitation maps for the observations and the different gridded datasets.
The observations showed a relatively homogeneous spatial pattern of precipitation, with values ranging from 195 to 395 mm/month throughout the basin, except for ten stations. Five stations reported values above 395 mm/month, four of them located near the western border in the area west of 76,0◦ W (WB76). Meanwhile, the other five stations recorded values below 170 mm/month, all of which are also situated near WB76. The observations, ERA-Interim, REMO, and Delaware showed that this is an area of high spatial variability regarding precipitation. CMAP, CMAP-v2, GPCP, and CPC underestimated precipitation in that area. ERA-40 showed a generalized underestimation throughout the basin, and ERA-Interim showed overestimation mainly in the eastern part of the study area. NCEP/NCAR and NCEP-v2 underestimated precipitation in the area south of the equator and west of 72◦ W. As will be seen later, it was in this area where NCEP/NCAR and NCEP-v2 exhibited the highest errors regarding the water balance. ERA-40, NCEP/NCAR, the observational products Delaware, GPCP, CMAP, CMAP-v2, and CPC showed a predominantly negative bias throughout the basin, while ERA-Interim and REMO showed a positive one. This is consistent with the values shown in the graphs on panels a, b and c of Fig. 3.
Surface water and energy balances in the CAB
This section presents a comparison of the water and energy balances in the CAB for the datasets where the different components of the hydrological cycle were available. These were ERA-40, ERA-Interim, NCEP/NCAR, NCEP-v2, and REMO. Furthermore, the condition of closure of the balances was evaluated.
The surface water balance of REMO and the reanalyses is expressed in Eq. (1):

where WS is the surface water storage (mm), t is time (months), P is the total precipitation (mm/month), E is the total surface evapotranspiration (mm/month), and R is the total runoff (mm/month). RES (mm/month) corresponds to the residual that comes from the assimilation process. During this process, a new state of the atmosphere is generated, which is closer to the observations but different from the one simulated by the model. Therefore, the atmospheric states are discontinuous, which disturbs the water balance. RES can also be regarded as an estimate of the general error in the water balance. Thus, Eq. (1) can be reorganized as Eqs. (2) and (3) (41):


where AB is the absolute water balance and RB is the relative water balance ( % of P), and AB and RB include both RES and the change of WS. According to 42, RES contributes more significantly to the annual time scale than the temporal change in WS. In the first part of this section (Components of the water and energy balances), the spatial averages of P, E, R, and B were computed for the entire CAB. The anual cycles of P, E, and R were produced (one value per month per variable) following Eq. (4):
where xij is the value of P, E, or R (mm/month) in month i and on tile j; p is the number of dataset tiles within Amazonia; and k is the total number of months throughout each dataset’s entire time period (e.g., k = 66 for January, NCEP/NCAR, as described in column 3 of Table I).
Finally, one value (Y; mm/month ) is computed for each month. The AB of datasets is averaged annually (one value per year) for the entire CAB. To this effect, the annual average values of P, E, and R are first computed using Eq. (4), except that k is now 12, the number of months within the period from 1 January to 31 December of the same year. AB is then calculated using Eq. (2) for each year.
In the second part of this section (Long-term mean of the water balance components), precipitation, evaporation, runoff, and the relative water balance from the four reanalyses and REMO were averaged on a monthly time scale for the 1994-2010 period (or the period of intersection with 1994-2010, as shown in column 4 of Table I) for each dataset tile. For REMO, this was not necessary since it is available with a monthly temporal resolution. The values of P, E, and R were then averaged for the entire period of each tile, following Eq. (5:)

where X (mm/month) is the averaged variable P, E, or R; xi is the value of P, E, or R in year i; and n is the total number of years in the 1994-2010 period (17, 8, or 7 values, as explained above).
RB is computed from the averaged values of P, E, and R using Eq. (3). To consider only data for the Amazonia, the mask shown in Figure 1b is applied.
According to Equation 4.1 in 43, the storage of energy G on the surface of the earth can be written in the following terms:

where SR is the solar radiation, TR is the terrestrial radiation, LHF is the latent heat flux, and SHF is the sensible heat flux. G ≈ 0 for long periods of time (in the order of years).
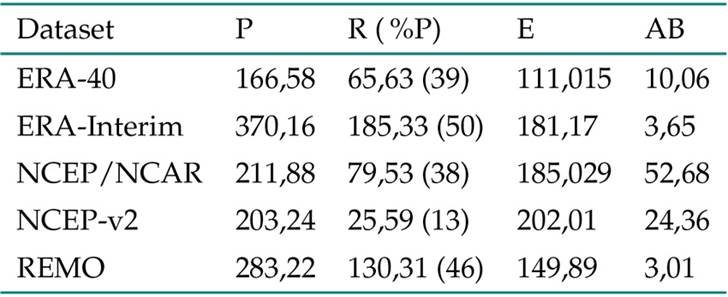
Table IV Individual components of the surface water balance in the CAB for the period available in each of the datasets, as indicated in column 3 of Table I. P Precipitation, R runoff, E evaporation, and AB absolute water balance, expressed in mm/month. The runoff is also reported as a percentage with respect to precipitation (numbers in parentheses). AB is calculated according to Eq. (2).
In section 4.1, an analysis of the components of the surface water and energy balances is carried out. This analysis is based on the ERA40, ERA-Interim, NCEP/NCAR, NCEP-v2, and REMO reanalyses. In contrast, no analysis of the balances was performed using direct observations, since, for Colombia, components such as runoff, sensible heat flux, latent heat flux, and thermal radiation, are not directly measured on a regular basis. For example, in 2010, IDEAM published a national water study 17 for the first time and has since conducted updates every four years ( (44); 45; 46). In these three updates, IDEAM estimates runoff based on evapotranspiration and precipitation, and it estimates evapotranspiration based on precipitation and temperature.
Components of the water and energy balances
Table V Individual components of the surface energy balance in the CAB for the period available in each of the datasets, as indicated in Table I. SR solar radiation, TR thermal radiation, LHF latent heat flux, SHF sensible heat flux, and G storage of surface energy. LHF is also reported as a percentage relative to SR (numbers in parentheses). These parameters are expressed in W/m2. G is calculated according to Eq. (6). For NCEP-v2, there are missing LHF values from 2003, so the climatological LHF value was calculated for the 1994-2002 period.
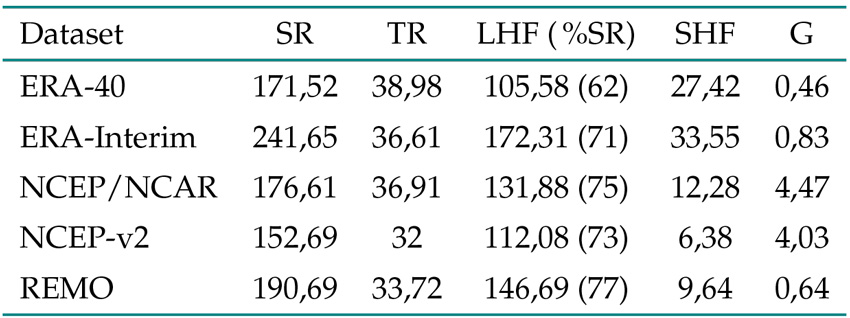
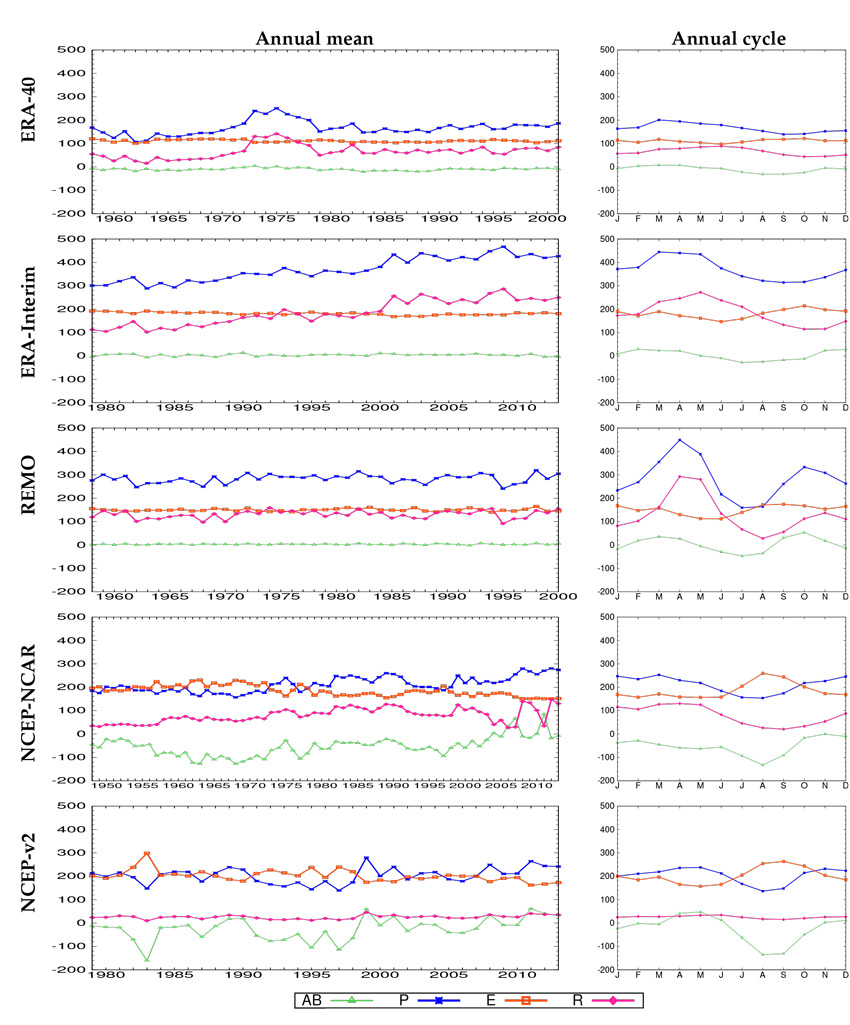
Figure 6 P Precipitation, R runoff, E evaporation, and AB absolute water balance for the available periods indicated in column 3 of Table I, expressed in mm/month. Annual averages (left) and anual cycle (right).
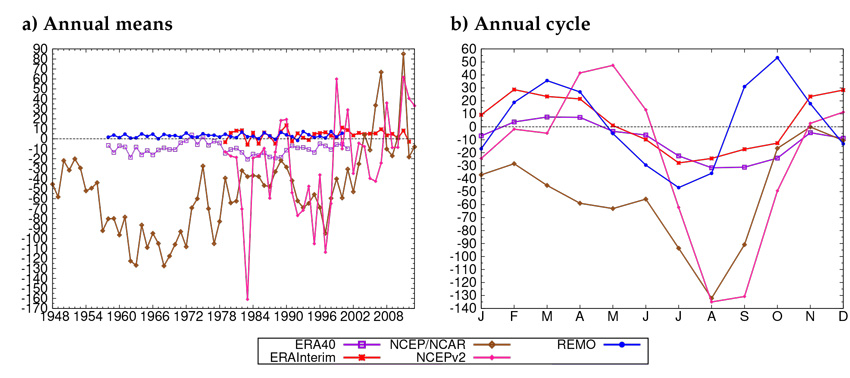
Figure 7 Comparison of absolute water balances (AB). a) Annual means, b) annual cycle, expressed in mm/month.
The annual means and the annual cycle of the individual AB components for the ERA-40, ERA-Interim, NCEP/NCAR, NCEP-v2 reanalysis, and REMO are shown in Fig. 6. The values were calculated for the periods available in each of the datasets and are shown in Table I.
The annual means and the annual cycle of AB for each of these five datasets are shown in Fig. 7. Table IV summarizes the averages of the water balance components in the periods available in each of the datasets. The different components of the energy balance are shown in Fig. 8 in terms of the annual means and the annual cycle for the CAB. In Fig. 9, a comparison regarding energy storage G in the CAB is presented which includes each of the five datasets. In addition, Table Vshows a summary of the energy balance component averages for the periods available in each dataset.
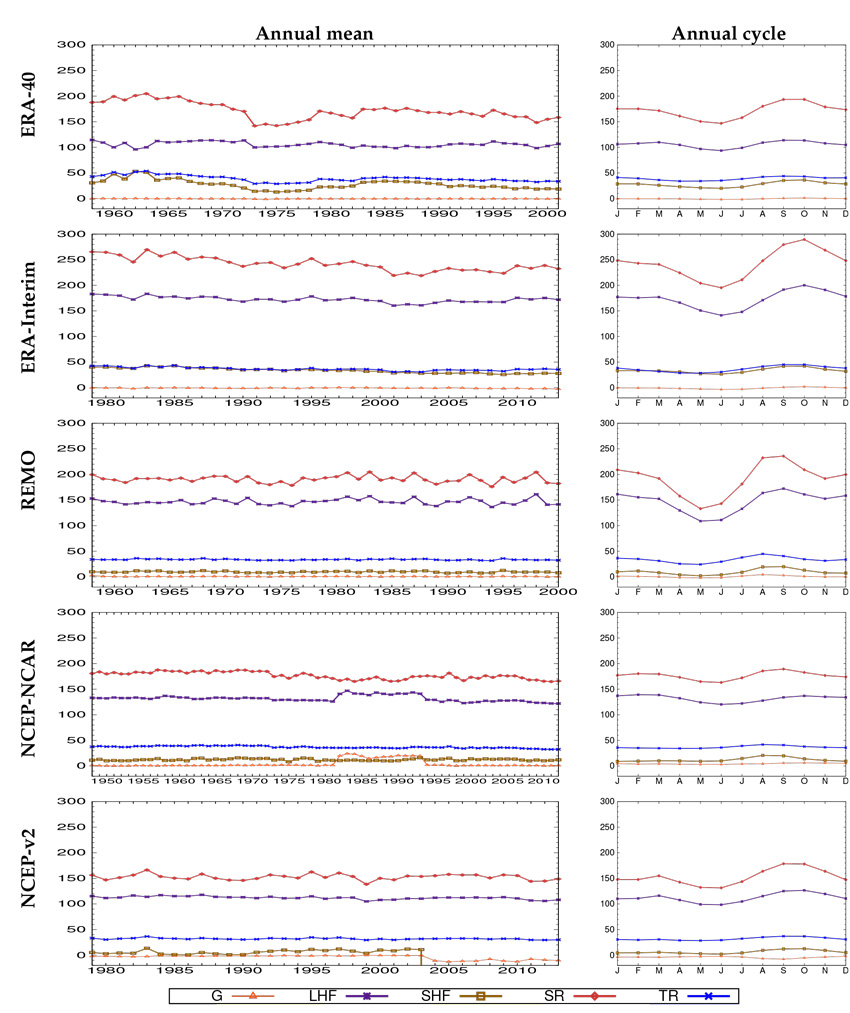
Figure 8 Energy balance components in the CAB for the available periods indicated in Table I. SR solar radiation, TR thermal radiation, LHF latent heat flux, SHF heat flow, and G stable energy storage, expressed in W/m2. Annual mean (left) and annual cycle (right).
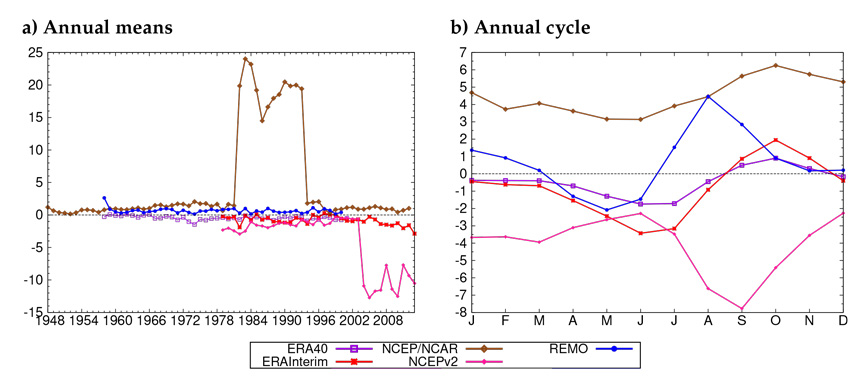
Figure 9 Comparison of the energy storage (G) in the CAB. a) Annual means, b) annual cycle, expressed in W/m2. For the NCEP-v2, there are missing LHF values from 2003, so the climatological LHF value was calculated for the 1994-2002 period.
ERA-40 exhibited increased precipitation and runoff from 1962 to 1975 (Fig. 6). ERA-Interim also recorded an increase in these two variables, albeit over the entire period, and had the highest precipitation values of all datasets. In addition, from 2000 on, ERA-Interim had the highest runoff values. NCEP/NCAR also exhibited increased precipitation from 1997 to 2013. In general, REMO and NCEP-v2 reported no tendency in the precipitation. However, REMO showed the second-highest precipitation value( Table IV).
Regarding ERA40, ERA-Interim, and REMO, it is evident that the runoff followed precipitation variations in both the annual means and the annual cycle. In contrast, for NCEP/NCAR, in the 2002-2006 period and again in 2011, there were declines in runoff that were not accompanied by decreases in precipitation. On the other hand, NCEP-v2 did not show correspondence between precipitation and runoff in the annual cycle. In addition, NCEP/NCAR and NCEP-v2 sometimes showed evaporation values that were higher than the precipitation values in both annual means and the annual cycle.
When comparing the evaporation values in the CAB to the evaporation map provided by IDEAM (Fig. 10), it is evident that NCEP/NCAR, NCEP-v2, ERA-Interim, and REMO show similar values to those observed in the northern regions of the country, such as the departments of La Guajira and Atlántico. These northern regions are classified as having an arid or subhumid climate according to the Martonne climate classification, unlike CAB, which experiences a humid and rainy climate.
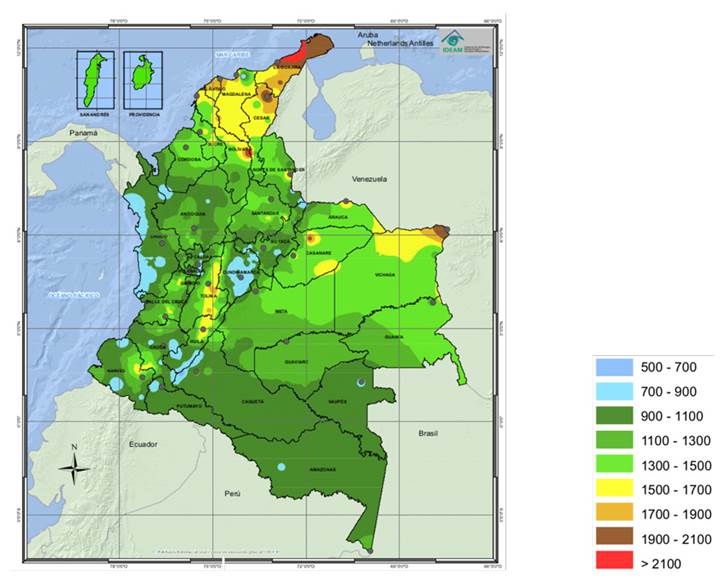
Figure 10 Multi-year total annual evaporation average (mm/year). Adapted from Instituto de Hidrología Meteorología y Estudios Ambientales 16 and reproduced with their permission.
The long-term closure conditions of the water balance (AB ≈ 0) for the datasets evaluated was mainly fulfilled for REMO, followed by ERA-Interim and ERA-40 (green lines in the graphs on the left side of Fig. 6). On the other hand, NCEP/NCAR exhibited an average deficit of 53 mm/month throughout the data series. Its updated version, NCEP-v2, also showed a deficit, with an average value of 24 mm/month (Fig. 7, Table IV).
In most of the five datasets evaluated regarding the water and energy balances, the physical relation between latent heat flux and evaporation was clearly evident (Figs. 6 and 8), both in the annual means and the annual cycle (with the exception of NCEP/NCAR), despite the different behaviors of these two variables in each dataset. Likewise, the relation between solar radiation and latent heat flux in the five datasets was evident. This relation was reflected in the high percentage of latent heat flux with respect to solar radiation, which, for all datasets, was above 60 % (Table V). However, for NCEP/NCAR, there was a discrepancy in the period from 1981 to 1994 with regard to these components. This could be the main cause of the alteration in the energy storage observed in the same period for this dataset. For the NCEP-v2 dataset, from 2003 on, a deficit in the energy balance was noted, which was due to missing values in the latent heat flux from that year. According to the average energy storage (Table V) and the comparison presented in Fig. 9, the closure in long-term energy storage was generally well described in the five datasets, to a greater extent by ERA-40, followed by REMO and ERA-Interim.
Long-term mean of the water balance components
Columns 1 and 2 of Fig. 11 show the long-term mean of evaporation and runoff for the four reanalyses of the CAB. Regarding evaporation, ERA-40, ERA-Interim, and REMO showed lower values (80-140 mm/month) near the western border. This behavior is in line with the evaporation map created by IDEAM, as depicted in Fig. 10, which is based on observations. In contrast, NCEP/NCAR and NCEP-v2 showed the lowest values in the east of the basin. The evaporation map of IDEAM showed values of 700-900 mm in the Amazon piedmont and values around 1.000 mm for most of the basin, with an increase towards the north, reaching values close to 1.300 mm/year. ERA-40 showed evaporation values ranging from 80 to 120 mm/month (960 to 1.440 mm/year), which closely matched IDEAM’s data. In contrast, the other datasets reported values above this range.
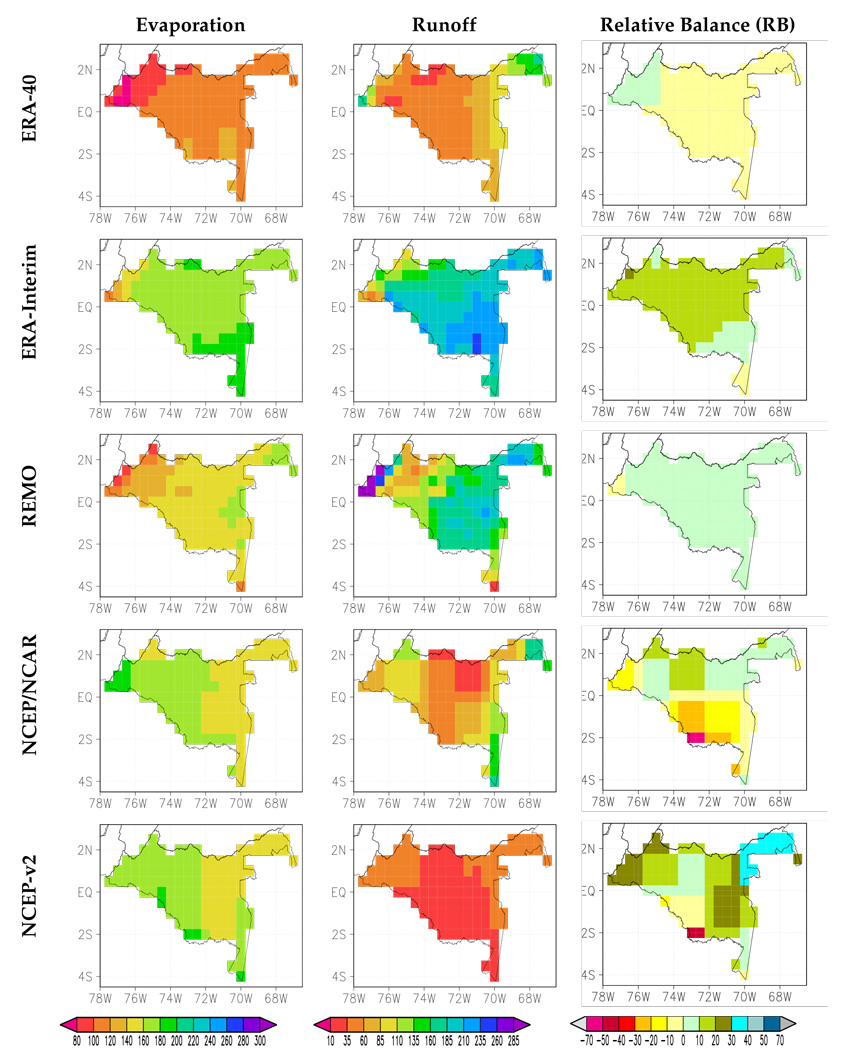
Figure 11 Long-term mean evaporation, runoff, and relative balance (RB) values (mm/month) for ERA-40, ERA-Interim, REMO, NCEP/NCAR, and NCEP-v2 in the CAB for the periods shown in columna 4 of Table I.
For ERA-40, ERA-Interim, and REMO, the spatial distribution of the low and high runoff values was very similar to that of the low and high values of precipitation, i.e., the precipitation and runoff maps in ERA-Interim and REMO show higher values in the foothills and east of 73◦ W. This spatial distribution is similar to the one shown in the runoff map elaborated by IDEAM (see Fig. 12), which exhibits runoff values mainly between 1.500 and 2.500 mm/year (125 and 208 mm/month) for the CAB. The runoff values closest to those of IDEAM corresponded to ERA-Interim and REMO, with a predominance of values between 60 and 285 mm/month. For the other datasets, values of 110 mm/month and less are predominant.
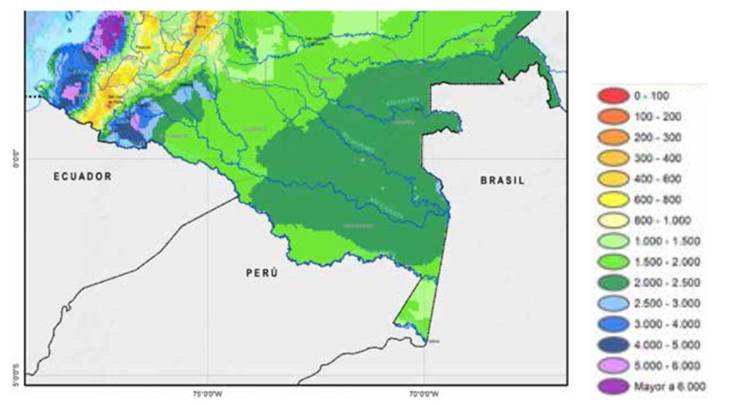
Figure 12 Multi-year average of total annual runoff (mm/year). Adapted from Fig. 17 in Instituto de Hidrología Meteorología y Estudios Ambientales 46 and reproduced with their permission.
Column 3 of Fig. 11 shows the closure of the water balance using the long-term mean RB values computed for ERA-40, ERA-Interim, REMO, NCEP/NCAR, and NCEP-v2 for the CAB. As expected, the water balance of REMO was closed, with values of RB almost equal to 0 % (values mainly between -6 and 6 %). The water balance of ERA-40 was also closed, and that of ERA-Interim was almost closed, since 85 % of the reanalysis tiles had a RB value between -2,5 and 15 %. Conversely, the water balances of NCEP/NCAR and NCEP-v2 were not closed. NCEP/NCAR (NCEP-v2) exhibited negative RB values between -6 and 60 % (-6 and -54 %) mainly in the southern (southwestern) area of the region. This is due to underestimation of precipitation in that region, as shown in Fig. 5. Furthermore, NCEP-v2 presented positive RB values (between 20 and 40 %) in the region north of 2◦ S and west of 71,5◦ W, as well as in the region east of 76◦ .
Discussion and conclusions
For this study, in situ stations were identified, where the temperature and precipitation variables inside the CAB were measured. Most of the stations did not have long periods in common, exhibited considerable amounts of missing data, and their geographical distribution was not uniform. There is greater availability of information for precipitation, but the number of stations per department is not proportional to its area. This is especially true for the department of Vaupés, where there is only one station. The departments of Guainía and Guaviare have no stations available within the CAB. In this study, we implemented a methodology that allowed for both an unbiased spatial comparison and a fair temporal comparison. The inclusion of date-to-date comparisons ensures a fair temporal assessment since in situ observations often have a significant volume of missing data (in most cases, up to 55 %), which can substantially alter the results.
The scope of this study involved an exploration of the potential of REMO, ERA40, ERA-Interim, NCEP/NCAR and NCEP-v2, and some observational products to provide meteorological variables where few or no observations are available, as well as to determine their reliability for representing both:
the general climatological characteristics of temperature and precipitation and
the surface water and energy balances of the CAB.
Temperature and precipitation
Based on the combination of the observations made at the in situ stations selected for the 1994-2010 period, a unimodal behavior in the annual temperature cycle was found as a general characterization of the CAB, with a minimum in June-July and a maximum in January, as well as average variations between 23,7 and 25,3 ◦C. This indicates little variability in the area, with a range of variation of only 1,6
When comparing the observed temperature in the CAB with that from the different datasets, it was found that most of the latter underestimated the temperature in both the annual means and the annual cycles, except for the ERA-40 reanalysis and the regional climate model REMO, which overestimated it. Delaware, ERA-40, and ERA-Interim exhibited consistency in the predominant unimodal character of the annual temperature cycle within the CAB. REMO, NCEP/NCAR, and NCEP-v2 did not display this consistency. The dataset closest to the observed temperatures was ERA-Interim, followed by Delaware, while the farthest were REMO and ERA-40. REMO is driven by ERA-40, which could explain why they have similar temperature biases.
Without glossing over the location bias along the western zone of the CAB due to the geographic location and the number of stations used in the assessment, it was found that the annual cycle of the observed precipitation showed a predominantly unimodal character, with a maximum in April-June and a minimum in January. The range of intra-annual variation was between 13,3 mm/day in May and 6,3 mm/day in January, and the average accumulated rainfall for one year was 3.540 mm.
The datasets that best reproduced the annual cycle of the precipitation were the observational products Delaware, CPC, and GPCP. The ERA-Interim reanalysis reproduced the unimodal carácter of the annual precipitation cycle relatively well.
The work of 7, also obtained from observational data, states that the highest precipitations occur in March-May in the north of the entire Amazon basin. However, there are two slight discrepancias with this study. First, 7 showed a slightly bimodal annual cycle, with the highest rainy season in the first part of the year. Another important difference was that he found an average value of precipitation of 6 mm/day for the northern region of the Amazon basin, whereas our analysis of the CAB found that the average of the monthly averages was 9,7 mm/day. This difference could be due to the fact that he included not only the south of Colombia, but also sectors of other countries like Peru, Brazil, Venezuela, Guyana, Suriname, and French Guiana.
Most of the datasets underestimated precipitation, with the exception of REMO and ERA-Interim, which showed the highest annual averages for this variable. However, there was a generalized increase in precipitation for ERA-40, ERA-Interim, NCEP/NCAR, and NCEP-v2 throughout their available periods, an aspect that is not evident in the observations conducted during the study period. The datasets with lower bias both in the annual cycle and in the annual means of precipitation correspond to GPCP, followed by Delaware and CPC. This coincides with the results of 19 for the Colombian Caribbean Basin. They show that the observational products Delaware and CPC have the closest proximity to in situ observations in relation to the annual cycle and the annual means of precipitation.
Water and energy balances
We studied the long-term mean of the water balance and the water cycle components for the regional model and the four reanalyses. The water balances of REMO and ERA40 are closed (|AB| ⪅ 10 %P ) in comparison with the other three reanalyses, whereas ERA-Interim revealed a positive water balance in much of the basin (10 %P ⪅ |AB| ⪅ 20 %P ), and NCEP/NCAR and NCEP-v2 revealed a mixed water balance, with positive and negative values of greater magnitude. The negative part of the water balances of NCEP/NCAR and NCEP-v2 was strongly influenced by inconsistencies in their components, e.g., large biases of evaporation and runoff throughout the basin and underestimations of precipitation mainly over the southern or southwestern area of the basin. On contrast, the high precipitation from ERA-Interim, when compared with those of the observations, contributed to the positive values of the water balance for a large proportion of the basin.
Precipitation, evaporation, and runoff were also assessed on a multiyear monthly basis for the basin. For REMO and the four reanalyses, the mean annual cycles of the water balance components showed a different temporal evolution. Furthermore, the amounts of water differed, especially the precipitation and runoff of ERA-40, NCEP/NCAR, and NCEPv-2. The NCEP/NCAR and NCEPv-2 reanalyses did not accurately allocate a sufficient quantity of precipitated water between evaporation and runoff. Notably, there are years, especially prior to 1974, in which more water evaporates than precipitates. On the other hand, although the water balance of ERA-Interim was almost closed and its runoff values were the most consistent in comparison with the runoff map of IDEAM 12, ERA-Interim was the dataset with the greatest increase in precipitation for the whole period, an aspect that was not evidenced in the observations. NCEP/NCAR and NCEP-v2 appeared to be the least consistent among the five datasets for the CAB (as shown in Section 4, Figs. 7 and 11, and Table IV). This agrees with the results of 7 obtained for the entire Amazon basin using the NCEP-v2 reanalysis. Each of the four reanalyses and REMO have their own strengths and weaknesses. Therefore, care should be taken in using any of the reanalyses of terrestrial water cycle components, especially for impact studies.
According to the comparison between the horizontal global irradiation map elaborated by IDEAM (Fig. 13) and Fig. 8, the observed solar radiation reaching the surface of the CAB was between 3 and 4,5 kWh/m2·day (125,0 and 187,5 W/m2) and was relatively well represented by NCEP-v2, ERA-40, NCEP/NCAR, and REMO - in that order. In contrast, ERA-Interim overestimated it by a high percentage (about 40 %).
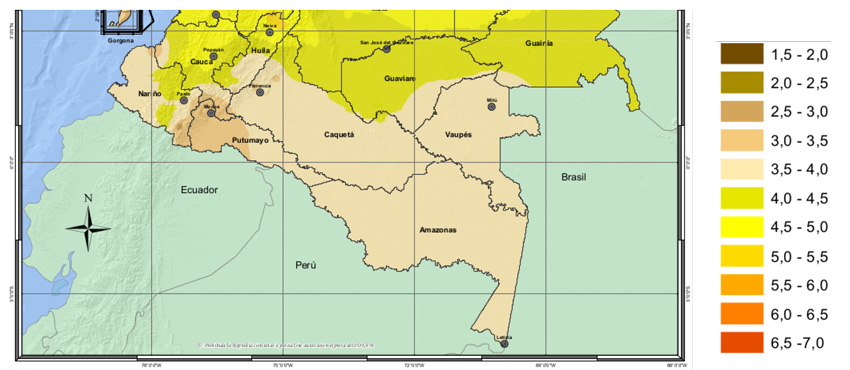
Figure 13 Multi-year average of daily annual horizontal global irradiation (KWh/m 2/day). Adapted from Instituto de Hidrología Meteorología y Estudios Ambientales (47) and reproduced with their permission.
In general, the five datasets fulfill the long-term closure condition of the energy balance. This is done to the greatest extent by ERA-40, followed by REMO and ERA-Interim. However, the overestimation of solar radiation in ERA-Interim suggests that the other fields involved in the energy balance would also be overestimated.
In summary, the results presented in this study regarding the water and energy balances in the CAB suggest that the five datasets considered (the four reanalyses and REMO) should be treated with special care in research, as their precipitation values may exhibit overestimation, underestimation, or both. In addition, regarding the temperature, which is directly related to solar radiation, the five datasets also show bias. Thus, these datasets could provide an unrealistic representation of the hydrological and energy fields, although this is fulfilled to some extent by the closure conditions of the water and energy balances.

