


 English (pdf)
 Article in xml format
 Article references
 Send this article by e-mail
 Cited by SciELO
  Cited by Google
  Similars in
SciELO
Similars in
SciELO  Similars in Google
 Permalink
INTRODUCTION
The Navío Quebrao Lagoon (NQL) is a relevant body of water because it is part of the Flamingos Flora and Fauna Sanctuary (SFFF). The sanctuary was established for the protection of the pink flamingo (Phoenicopterus ruber, Linnaeus, 1758). The lagoon also serves as economic support for the fishing communities, mostly indigenous people settled in its surrounding areas. The NQL experiences physiographic and biodynamic changes from October to March, leading to variations in hydrology and water physicochemical variables (Ricerca e Coorperazione - Corpoguajira, 2001). Cachirra (a word given by the natives of the area) is an event consisting of the massive mortality of juvenile fish inhabiting the lagoon, which results from changes during a low precipitation season. These changes lead to a progressive increase in salinity and a reduction of food availability, as indicated by de la Lanza-Espino et al. (2020). The authors mention that the variations in the coastal physicochemical and biological parameters are the result, among others, of natural factors such as climate.
The Cachirra event negatively impacts the economy of the indigenous people living in the area (Rosado et al., 2011) because the species involved in this event, specifically the mugilids, do not reach the commercially required sizes to be well valued in the market. This affects the potential revenues for the local fishermen. The constant opening of the river mouth to allow the influx of water, which is instrumental to the growth of the species, is restricted by the community. This situation creates a dilemma that should be tackled in order to encourage the ancestral culture of the Cachirra event, given that it is part of the cultural identity of the people living in the area.
Numerous studies in NQL have focused on the fields of hydrology and hydrodynamics (Negri, 2000); hydrodynamic, climatic, biological, and socioeconomic aspects (Ricerca e Cooperazione - Corpouajira, 2001; Ruiz & Ramírez, 2002); regulation of artisanal use (Pérez, & Ceballos, 2002); floristic and ecological aspects (Rosado & Cortés, 2006); physicochemical variables and phytoplankton population (Rosado & Márquez, 2004); mathematical modeling (Annichiarico & Guzmán, 2006; Nardini, 2005); and artisanal fishery (Bedoya, 2004). Several studies assess the impact of salinity and temperature on growth (Shikano et al., 2001). The increased salinity negatively affects the feed conversion rate and efficiency, the protein intake, and the efficiency of protein utilization (Al-Khshali, 2017; Schofield et al., 2011).
In general, Mugilidae species have a high ecological plasticity. Mugilids are able to consume a variety of foods: detritus (which they can also filter out), algae, crustaceans, mollusks, insects, and large amounts of silt from the bottom (Cardona, 2001; Fernández-Delgado, et al., 2000). These features make them an ecologically important family due to its decisive contribution to the energy and matter flow from the lower to the upper levels of the ecosystems they inhabit (Almeida, 2003). Several mugilid species can inhabit the same estuary, as they utilize the food distributed from the thin water surface film to the bottom mud, either by direct grazing or using plant-detritus food chains as an energy source (Crosetti & Cataudella, 1995). Due to this, Mugilidae is always one of the dominant fish families in the ecosystems it inhabits (Oliva-Paterna et al., 2006; Simier et al., 2004; Strydom, 2003). The majority of Mugilidae species are highly euryhaline (Cardona, 2001).
This study aims to generate basic information on the behavior of the most relevant aspects regarding the environmental and biological factors that affect the dynamics of the NQL. It also aims to identify the relevant variables causing the massive fish mortality during the Cachirra event. The findings of this study could be used by provincial government agencies to design comprehensive policies and strategies that may lead to short-term mitigation of fish mortality and to reduce crustacean and mollusk presence in the lagoon. According to a study by Negri (2000) about the environmental impacts on the hydrological and hydrodynamics of the lagoon, the logging of forests in the main tributary channel and sand extraction activities were found to have a major impact. The research concluded that, within 20 years, the NQL would be completely clogged. Therefore, local authorities need to regulate these activities and must implement strategies to preserve the formation of the Cachirra event since it influences the cultural identity of the people living in the area. At the same time, the preservation of the event allows crustaceans to reach a larger size, thus improving their commercial value and the subsequent increase in the income of the indigenous people and afro-descendant communities living in the surroundings of the lagoon.
METHODOLOGY
Study area
The area under study is called Navío Quebrao Lagoon or Camarones lagoon, and it is located in the Northwest of the department of La Guajira, in the municipality of Riohacha (11° 27'-11° 22' North and 73° 11'-73° 7 ' West). It is at an altitude of 5 masl and has a maximum flood surface of 9 km2, approximately 900 ha (Figure 1).

Methods
Research activities were conducted from October 2016 to March 2017. They covered the wet season (October, November, and December) and the dry season (January, February, and March). Climatological, biological, and physicochemical variables, as well as the sequence of fish mortality by species were measured again in 2018. The average values were used for variable analysis. In the wet season, three sampling stations were designated. A sampling station known as S1 was located 100 m from the mouth of the Camarones river. The S2 site was located 100 m from Arroyo de Los Indios and S3 at the center of the lagoon. In the dry season, there is a displacement and a significant reduction of the lagoon area to approximately 5 ha on the western side of the lagoon. The water column also decreases, maintaining a uniform depth during drought time. Thus, only one sampling station was established (S3) at the center of the lagoon.
The main changes or disturbances occur at the entrance of Arroyo Camarones [Camarones Stream], which correspond to S1; the others correspond to the mouth of the lagoon (S2). No additional sampling stations were installed, since the other areas are dead spots where the variables do not show any alteration that is relevant for the study. The location of the S3 station was selected considering that the evaporation process starting in December causes S1 and S2 to disappear, thus reducing the water area to approximately 50 ha in the western sector, where S3 is located. It is important to mention that there are no major industries or roads in the area. There are only some small houses belonging to indigenous communities who are very isolated from each other, and they have no impact on the dynamics of the lagoon.
Climatological and physicochemical variables
Data corresponding to climatological variables (maximum temperature, minimum temperature, average temperature, relative humidity, sunshine, maximum wind, wind speed, precipitation, evaporation, and cloudiness) were provided by IDEAM (2017). A WTW 3320 Multiparameter was utilized to perform in situ monitoring (in triplicate) of physicochemical variables (salinity; potential of Hydrogen, pH; dissolved oxygen, DO; and water temperature). Turbidity was measured with a HACH 2100P turbidimeter. Samples were collected in triplicate in 500 mL polyethylene bottles to determine (ex-situ) the concentrations of nitrites and ammonium. They were then transported and kept at 4 ºC to be analyzed at the Environmental Quality Laboratory of Universidad de La Guajira within 8 hours of their collection (APHA, AWWA, & WEF, 2012). Following Camargo and Alonso's (2006) recommendations, we selected five variables due to the lethal effects they can have on fish survival: temperature, dissolved oxygen, nitrites, pH, and ammonium.
The standardized methods (APHA, AWWA & WEF, 2012) used for the analysis of the physicochemical variables are indicated in Table 1.
Table 1 Variables, methods, and equipment for physicochemical analysis
Source: Authors, based on APHA, AWWA & WEF (2012)
Inventory of fish species, biometric parameters, and stomach contents
For the identification of the species, previous knowledge and the existing specialized bibliography were used (Cervigón & Fischer, 1979; Chasqui-Velasco et al., 2017; Román, 1979; Rosas-Luis et al., 2016) after weekly manual randomized sampling of moribund floating fish species throughout the lagoon. We recorded the sequence of fish mortality for the species involved in the Cachirra event. Samples were also taken from arranchaderos, places where fish are laid in the open for sun-drying, following their collection with different fishing equipment such as cast nets, trammels, and manuals (Rosado et al., 2011; Ruiz & Ramírez, 2002).
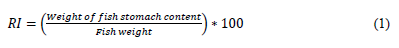
We measured the total length (TL) of the fish with an ichthyometer (a fish measuring board) and the weight (W) with a balance in order to compare the commercial size to the size and weight of the species of the Cachirra event. The length-weight relationship of the species was determined using the allometric growth formula W = a*Lb (Froese, 2006; Huxley, 1950) and linearized by means of a logarithmic transformation. The state of gastric repletion (SGR) and food content were determined using a randomized sample of 50 individuals for each species. Their stomachs were extracted, and their content was preserved in 10% formaldehyde and analyzed with a Nikon E400 stereoscope (Sánchez-Hernández et al., 2010). The Repletion index (RI) was calculated with Equation (1) (dos Santos, 1978; Molina-Ocampo, 1993):
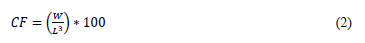
Taxonomic classification of animal samples was conducted only for the upper categories, namely insects, crustaceans, nematodes, and polychaetes. The rest of the samples were classified as detritus, filamentous algae, microalgae, and sand. Following Pauly (1984), the condition factor (CF) was used to determine the relationships between feeding and fish growth during the various stages of development. Equation (2) was used to obtain this factor:
The species involved in the Cachirra event were determined through a survey that inquired fishers for the species that they considered to be components of the event. The identified species were those with greater acceptance and demand in the market, as well as those prefferred by the community due to their flavorful taste, which is acquired during the salting and sun-drying process.
Mortality sequence in component species of the Cachirra event
The dry season began in December 2016 and lasted until February 2017. Constant observations were made of the body of water, and, if fish mortality was observed in the area, then the species were collected and measured. The salinity and the salinity range that caused the death of the species were determined using the WTW 3320 Multiparameter.
Statistical analysis
For the analysis and interpretation of the physicochemical and climatic results, the initial data were transformed into a correlation matrix by applying Pearson's product-moment correlation coefficient between pairs of physicochemical and climatic variables using the R statistical package, version 3.2.2. In order to search for associations between the studied variables, a cluster analysis was performed using Ward's algorithm and the similarity matrix based on the Bray Curtis Index. The evaluation of significant differences in the temporal behavior of all the physicochemical variables during the study was carried out by means of the non-parametric Wilcoxon test with a significance level of 0,05.
RESULTS
Climatic variables
Table 2 reports climatic variable data corresponding to the wet months (October, November, and December 2016) and the low water level period (January, February, and March 2017). We observed variations in the records of precipitation, cloudiness, wind speed, and evaporation during the wet and dry seasons, which affected the biodynamics of the lagoon.
Table 2 Record of the main climatic variables in the Navío Quebrao Lagoon
| Variables | Units | Rainy season (2016) | Drought time (2017) | ||||
|---|---|---|---|---|---|---|---|
| Oct. | Nov. | Dec. | Jan. | Feb. | Mar. | ||
| Maximum temperature | °C | 36,9 | 34,7 | 34,6 | 34,7 | 36,1 | 36,4 |
| Minimum temperature | °C | 22,4 | 20,8 | 21,7 | 19,8 | 19,2 | 18,9 |
| Average temperature | °C | 28,4 | 27,7 | 27,8 | 28,0 | 27,0 | 27,5 |
| Relative humidity | % | 78,0 | 80,0 | 75,0 | 63,0 | 64,0 | 66,0 |
| Solar brightness | h/sun | 217,8 | 194,5 | 228,7 | 278,7 | 242,8 | 231,7 |
| Maximum wind | km/h | 42,0 | 39,0 | 46,0 | 65,0 | 68,0 | 62,0 |
| Wind speed | m/s | 2,8 | 2,4 | 2,7 | 2,8 | 4,9 | 4,3 |
| Precipitation | mm | 126,4 | 138,6 | 14,9 | 1,9 | 0,0 | 0,0 |
| Evaporation | mm/day | 6,2 | 4,6 | 6,1 | 7,6 | 7,9 | 8,3 |
| Cloudiness | Octas | 7/8 | 6/8 | 5/8 | 4/8 | 3/8 | 2/8 |
Source: Authors, based on IDEAM (2016, 2017)
Physicochemical variables
Table 3 shows the behavior of the physicochemical variables during the wet and dry seasons, as well as the variations in salinity experienced from October (6,0 ± 0,6 PSU) to March (67,4 ± 1,36 PSU).
Table 3 Average records of physicochemical variables in the months of rain and drought
| Variables | Units | N | Rainy season (2016) | Drought time (2017) | ||||
|---|---|---|---|---|---|---|---|---|
| Oct. | Nov. | Dec. | Jan. | Feb. | Mar. | |||
| Salinity | PSU | 3 | 6,0 ± 0,6 | 23,0 ± 2,64 | 33,6 ± 1,24 | 35,0 ± 0,36 | 41,5 ± 1,41 | 67,4 ± 1,36 |
| pH | Unit | 3 | 8,0 ± 0,2 | 7,9 ± 0,3 | 7,9 ± 0,26 | 8,5 ± 0,17 | 8,1 ± 0,2 | 8,2 ± 0,26 |
| Dissolved oxygen | mg/L | 3 | 5,2 ± 0,4 | 5,6 ± 0,43 | 5,4 ± 0,3 | 5,2 ± 0,1 | 5,1 ± 0,36 | 4,4 ± 0,52 |
| Water temperature | °C | 3 | 29,0 ± 0,91 | 28,0 ± 0,91 | 28,0 ± 0,62 | 26,0 ± 0,70 | 26,0 ± 0,36 | 28,0 ± 0,52 |
| Nitrite | mg/L | 3 | 0,40 ± 0,04 | 0,50 ± 0,09 | 0,40 ± 0,1 | 0,01 ± 0,01 | 0,01 ± 0,01 | 0,01 ± 0,01 |
| Ammonium | mg/L | 3 | 0,20 ± 0,02 | 0,50 ± 0,04 | 0,50 ± 0,05 | 1,00 ± 0,2 | 1,00 ± 0,1 | 1,00 ± 0,17 |
Source: Authors
Species inventory
Table 4 indicates the presence of 34 species comprised by 20 families, mostly of marine and estuarine origin. We observed four genera belonging to Carangidae and Penaeidae families (11,8%); three genera belonging to Gerreidae and Mugilidae (8,8%); and one genus for each of the following families: Belonidae, Clupeidae, Dasyatidae, Gobiidae, Poeciliidae, and Pomacanthidae (2,9%). Fishermen of the area have linked the Cachirra event to twelve species out of the 34 species found. That is 35,3% of the total number of species living in the lagoon. Cachirra species are members of seven families, which is 35,0% of the total families in the lagoon.
Table 4 Reported species and components of the Cachirra event
| Family | Scientific name |
|---|---|
| Ariidae | * Bagre Marinus Mitchill |
| * Cathorops spixii Agassiz | |
| Belonidae | Strongylura marina Walbaum |
| Bothidae | Citharichthys spilopterus Günther |
| Carangidae | Chloroscombrus chrysurus L. |
| * Caranx hippos L. | |
| Oligoplites saurus Bloch & Schneider | |
| * Trachinotus falcatus L. | |
| Centropomidae | * Centropomus ensiferus Poey |
| Centropomus undecimalis Bloch | |
| Clupeidae | Harengula clupeola Cuvier |
| Dasyatidae | Dasyatis guttata Bloch & Schneider |
| Elopidae | * Elops saurus L. |
| Engraulidae | Anchovia clupeoides Swainson |
| Gerreidae | * Diapterus rhombeus Cuvier |
| Eucinostomus argenteus Baird & Girard | |
| * Eugerres plumieri Cuvier | |
| Gobiidae | Gobioides broussonneti Lacepède |
| Lutjanidae | Lutjanus griseus L. |
| Megalopidae | Tarpon atlanticus Cuvier & Valenciennes |
| Mugilidae | * Mugil curema Valenciennes |
| * Mugil incilis Hancock | |
| * Mugil liza Valenciennes | |
| Palaemonidae | Macrobrachium acanthurus Wiegmann |
| Macrobrachium carcinus L. | |
| Penaeidae | Penaeus notialis Perez |
| Penaeus schmitti Burkenroad | |
| Penaeus subtilis Perez | |
| Xiphopenaeus kroyeri Heller | |
| Poeciliidae | Poecilia vivipara Bloch & Schneider |
| Pomacanthidae | Pomacanthus paru Bloch |
| Portunidae | Callinectes bocourti Milne |
| Callinectes sapidus Rathbun | |
| Sciaenidae | * Micropogonia furnieri Desmarest |
| * Cachirra component species |
Source: Authots
Mortality sequence in species involved in the Cachirra event
Table 5 shows the sequential order of deaths for the 12 Cachirra species. The species most susceptible to salinity were C. spixii and B. marinus, with values ranging between 45 and 50 PSU. The most resistant were M. liza and E. saurus, which died when the salinity exceeded 70,0 PSU.
Parametric variables
M. incilis had the highest number of captures during fishing days (584 fish), followed by M. liza (204 fish). B values were close to 3,0. C. spixii reached the highest value (2,9730). r 2 values were above 0,8, with the highest value (0,9354) corresponding to C. spixii (Table 6).
Table 6 Size-weight relationship for the component species of the Cachirra event
| Species | Relationship parameters | ||||
|---|---|---|---|---|---|
| n | Equation | a | b | r 2 | |
| C. spixii | 74 | W=0,01850 L2,9730 | 0,01850 | 2,9730 | 0,9354 |
| E. saurus | 117 | W=0,01830 L2,8669 | 0,01830 | 2,8669 | 0,8080 |
| M. curema | 99 | W=0,00807 L2,4358 | 0,00807 | 2,4358 | 0,9565 |
| M. incilis | 584 | W=0,03280 L2,7602 | 0,03280 | 2,7602 | 0,9764 |
| M. liza | 204 | W=0,05460 L2,5857 | 0,05460 | 2,5857 | 0,8560 |
Source: Authors
Mugilids were the most abundant species, both before and during the Cachirra event. We identified a marked difference in CF and RI values before and after the mortality process. M. curema reached its highest CF value (2,10); and E. saurus and M. liza showed the highest RI values before the Cachirra event (1,80 and 1,70). M. liza and M. incilis had the highest values (0,58 and 0,40) after the event (Table 7).
Table 7 Number of individuals (n) by species and descriptive statistics of the variables TL, TW, CF, and RI before and after the Cachirra event
n: number of individuals; Max: maximum; Avg: average; σ: standard deviation; CF: condition factor; RI: repletion index
Source: Authors
Table 8 shows the stomach contents of different species that constitute the Cachirra event. During the wet season, the food supply is very diverse, predominantly consisting of organic matter, crustacean remnants, detritus, among others. Conversely, the food supply is meager during the dry season.
Table 8 Stomach content of some component species of the Cachirra event
| Species | Type of food | |
|---|---|---|
| Rainy season | Drought season | |
| E. saurus | Detritus, fish remains crustacean remains, and shrimp. | Crustacean remains |
| M. liza | Organic matter, vegetal detritus, sediments, diatoms, copepods, algae, mud, and organic detritus. | Organic detritus |
| M. incilis | Organic matter, plant detritus, sediments, diatoms, copepods, crustaceans, algae, mud, and organic detritus. | Organic matter and detritus |
| M. curema | Organic matter, plant detritus, sediments, diatoms, copepods, mud, organic detritus, and crustacean remains. | Mud and organic detritus |
| C. spixii | Seaweed and shrimp postlarvae. | Vegetal detritus |
| M. furnieri | Organic detritus, ostracods, and bivalves. | Organic detritus |
| C. ensiferus | Fish and shrimp remains, detritus, insects, crabs, and crustacean remains. | Crustacean remains |
Source: Authors
Discussion
We identified different factors that interact with salinity to significantly reduce the water column during the Cachirra event in the NQL. From October to March, variables such as sunshine, evaporation, winds, and cloudiness showed a high correlation with the water temperature of the lagoon, as well as with the increase in salinity (Table 9). During these months, water temperature records showed minor variations. These changes did not affect the fish metabolism. Additionally, the water column did not exceed 30 cm in March, and the action of the northeastern winds, known by the locals as Northeast or trade winds, plays a vital role in the dynamics of the NQL. The wind's strength and origin also determine the climatological (Table 2) and oceanographic features of the area.
Table 9 Correlation matrix of climatological and physicochemical variables
| Variables | RT | RH | SU | MW | PR | EV | CL | S | pH | DO | WT | NI | AM |
|---|---|---|---|---|---|---|---|---|---|---|---|---|---|
| RT | 1 | ||||||||||||
| RH | 0,495 | 1 | |||||||||||
| SU | -0058 | -0,851** | 1 | ||||||||||
| MW | -0,573* | -0,992** | 0,797** | 1 | |||||||||
| PR | 0,516* | 0,867** | -0,757** | -0,848** | 1 | ||||||||
| EV | -0,375 | -0,914** | 0,730** | 0,910** | -0,825** | 1 | |||||||
| CL | 0,539* | 0,882** | -0,796** | -0,898** | 0,853** | -0,793** | 1 | ||||||
| S | -0,610* | -0,707** | 0,315 | 0,716** | -0,676 | 0,766** | -0,432 | 1 | |||||
| pH | -0,354 | -0,845** | 0,791** | 0,798** | -0,726 | 0,629* | -0,598* | 0,624* | 1 | ||||
| DO | -0,102 | 0,265 | -0,075 | -0,270 | 0,163 | -0,609* | 0,074 | -0,528* | 0,038 | 1 | |||
| WT | 0,554* | 0,802** | -0,748** | -0,807** | 0,646* | -0,503* | 0,808** | -0,323 | -0,796** | -0,329 | 1 | ||
| NI | 0,717** | 0,552* | -0,336 | -0,546* | 0,649* | -0,305 | 0,427 | -0,611* | -0,753** | -0,342 | 0,658* | 1 | |
| AM | -0,186 | 0,516* | -0,624* | -0,488 | 0,549* | -0,735** | 0,581* | -0,223 | -0,151 | 0,626* | 0,092 | -0,273 | 1 |
| * The correlation is significant at a level of 0,05 (2-tailed). | |||||||||||||
| ** The correlation is significant at a level of 0,01 (2-tailed). | |||||||||||||
| RT = Room temperature | S = Salinity | ||||||||||||
| RH = Relative humidity | pH = Potential of Hydrogen | ||||||||||||
| S = Sunshine | DO = Dissolved oxygen | ||||||||||||
| MW = Maximum wind | WT = Water temperature | ||||||||||||
| PR = Precipitation | NI = Nitrites | ||||||||||||
| EV = Evaporation | AM =Ammonium | ||||||||||||
| CL = Cloudiness | |||||||||||||
Source: Authors
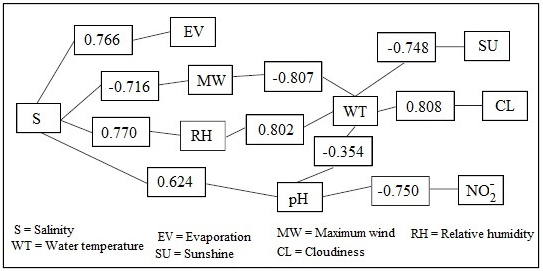
Table 9 shows the different correlations that occur between the climatic and physicochemical variables. Salinity is negatively correlated with wind (r = -0,716) and relative humidity (r = -0,707), but positively with evaporation (r = 0,766). The water temperature shows positive correlations with relative humidity (r = 0,802) and cloudiness (r = 0,808), but negative ones with sunshine (r = -0,748), wind (r = -0,807), and pH (r = 0,796). In turn, the pH has a negative correlation with water temperature (r = -0,796) and nitrite (r = -0,753), but a positive one with salinity (r = 0,624).
In Figure 2, two major associations are described: the first, defined by the variables precipitation, relative humidity, cloudiness, water temperature, nitrite, ambient temperature, dissolved oxygen, and ammonia; and the second, which comprises winds, evaporation, salinity, sunshine, and pH. According to the Wilcoxon test, there are no significant differences in the average behavior of the physicochemical variables in the rainy and dry seasons (p>0,05).
Source: Authors
Figure 2 Correlation horizon between climatological and physicochemical variables (October-March)
Our data (Table 3) showed atypically high values of NO2 - and NH4 + from October to November. During this season, the lagoon receives the most significant water contribution from the Camarones river. Most variables except salinity showed no variations that affected the existing species. In the NQL, the increments in salinity are gradual, varying from 35 ± 0,36 to 67,4 ± 1,36 PSU. Therefore, toxicity is also reduced, and, in October and September, NO2 - and NH4 + reach their maximum values while salinity reaches its minimum values. These changes, according to Partridge and Jenkins (2002), may lead to fish stress, exerting its most significant effect at 67,4 ± 1,36 PSU. Water is essential for life, and maintaining its quality is vital (Bueno et al., 2019). Values to protect aquatic animals from nitrogen compound toxicity have been proposed and recommended by different authors (EEA, 2005; Alonso, 2006; CCME, 2010). However, the recommended values are well below the data found during the wet season within the framework of this study. Neither fish nor crustacean mortality have ever been observed in this season. Therefore, we can infer that salinity is the determining factor in the mortality of these species in the NQL, as shown in Table 5.
It is emphasized that the concentration of minerals in shallow water bodies varies significantly from one brackish water body to another, due to differences in climatic, geographical, and topographic conditions, in biological activity, and in the time of analysis. The soil and the erosion or mineralization of rocks constitute edaphic sources of ions for freshwater bodies and eventually for salty bodies (Fuentes & Massol-Deyá, 2002). Bodies of water can be typified according to their total mineral content. Estuarine mineralization is affected by different climatic factors (winds, hours of illumination, precipitation, evapotranspiration, tides, solar brightness) and hydrological factors (current river discharge and tides) in such a way that, in rainy seasons, the salinity shows a tendency towards 0 UPS, as well as during low tides and in times of rising in the rivers that form the estuaries. On the other hand, in periods of drought or high tide, it tends to increase along with the minerals. Salinity depends on the stratification of the estuary. Thus, in estuaries with a saline wedge, salinity increases (Rosado & Castro-Echavez, 2011).
The inventory of species of the NQL showed that it posseses a great wealth of fish coming from the sea and, in a lesser extent, from its tributaries. Our data (Table 4) indicate that, out of the 20 families and 34 species reported, only 12 species (which represent 35,5% of the total population) are part of the Cachirra event. Our study and the one by SENA and Ministerio de Ambiente y Desarrollo Sostenible (1998) showed similar results, but notable discrepancies were observed in the number of species living in the NQL. Our study found commercially relevant species usually sold at high prices in regional and national markets, such as different types of prawns (P. schmitti and P. notialis, P. monodon), sea bass (C. undecimalis and C. ensiferus), and mugilids (M. liza, M. incilis, and M. curema). The aforementioned species are the foundation of the economy of the communities located around the NQL.
From January to March, an abrupt alteration of conditions begins, and salinity increases from 35 ± 0,36 to 67,4 ± 1,36 PSU (Table 3). This change causes a notable loss in the lagoon’s biological biodiversity because salinity (Smyth & Elliott, 2016), temperature (Molina et al., 2020), and turbidity (Romero-Berny et al., 2020) influence the spatial and temporal composition of fish communities. Furthermore, Smyth and Elliott (2016) indicate that there is also an energetic cost required in order to adapt to a changing ambient salinity, which may have consequences for organisms. Therefore, the variation from 34 species in October 2016 to 12 species in March 2017, allows stating that the salinity increase is a prominent factor that affects species mortality. The result is a decrease in the number of susceptible species, which also shows the persistence of those more abundant species, as is the case of mugilids such as M. curema, M. incilis, and M. liza. In some cases, fish can survive due to their osmoregulation capabilities (Stone et al., 2014) and their eating habits when a high concentration of nutrients are available due to evaporation in hypersaline environments, which agrees with what was indicated by Arjonilla and Blasco (2003) regarding the salinity-evaporation parameter, which increases the concentration of both ammonium and silicates.
Organisms from euryhaline environments, namely M. liza and E. saurus, can adapt to high salinities (Costa et al., 2008) during the dry season, but they do not forfeit their level of acclimatization during the wet season, which contributes to their distribution through salt adaptation (Chung, 2001). This acclimatization extends to other species such as crustaceans and tropical mollusks. Serrano et al. (2011) observed successful acclimatization of gray snapper (L. griseus) juveniles to hyposaline and hypersaline environments (0-60 PSU) after an adjustment of 96 h, thus demonstrating that ranges of acclimatization to changes in salinity vary from species to species.
In general, the studied species exhibit different values corresponding to negative allometric growth (Table 6), except C. spixii, which presented an isometric growth ,with a B value almost equal to 3,0 (2,9730). Negative allometric growth means species have little weight for their length. Cachirra event constituents, whose B value is less than 3,0, gain length in less time than it takes for their weight to increase, as is the case of E. saurus and the mugilids (M. curema, M. incilis, and M. liza). The growth of these species does not increase as a function of size cubic power; these variations depend on time and the sampling system used. Bravo et al. (2009) reported comparable results for H. aurolineatum, an abundant species in Margarita Island (Venezuela). Studies with various species and environments support the finding that it was possible to ensure that B values ranged between 2,5 and 4,0. Under natural conditions, these values are rarely equal to 3,0, a fact that coincides with the results obtained in our study.
Fishermen in the area use selective fishing gear with mesh eyes ranging from – to 1, which is known as ‘shrimp chinchorro’. This equipment allows older fish to be captured and juveniles to escape. The use of shrimp chinchorros explains that the vast majority of fish sizes before and after the Cachirra event are well below the average, corresponding to juvenile fish that have not yet achieved their first maturation, a condition reflected in the high values of the CF reached by the species, especially by juvenile mugilids. During December, mugilids abound in the coastal zone and penetrate the lagoon in search of refuge and food. Guerra and Marín's (2002) study of M. liza in the Unare Lagoon in Venezuela determined that this species reaches an average size of 67,3 cm, and Ruiz and Ramírez (2002) indicate an average length of 23,1 cm for M. incilis. Both sizes are above the sizes reported for these species before and after the Cachirra event, thus reinforcing the hypothesis that most of the components of this event are in juvenile stages. It is worth adding that fish length-weight relationships may vary according to sex, sexual maturity, and food consumption.
Botero-Arango and Castaño-Rivera (2005) concluded that the fact that they did not find any statistical evidence relating the environmental variables to the CF does not discard their influence on fish welfare. In contrast, Osorio (1985) concluded that CF values are higher in September, October, and November, when environmental conditions such as lagoon depth and salinity are less extreme, which agrees with the values obtained in the present study. Although there was no consistent finding of heavier fish with a higher CF before the Cachirra event, it was observed that mugilids showed high CF values, thus reflecting a better condition or nutritional status, increased by the amount of detritus brought by the rivers during the wet season, which constitutes the primary source of food for mugilids (Osorio-Dualiby, 2016).
The difference found in the RI before and after the Cachirra event (Table 7) agrees with Franco and Bashirullah's (1992) study. These authors found that specimens with empty stomachs (RI<0,5) are larger than those that with an RI> 0,5. The abundance and biodiversity of food during the wet months explains that fish before the Cachirra event have higher RI than after the event. Alcocer (1997) argues that biodiversity reduction in saline lakes can be very drastic, especially in hypersaline lakes, which may be limited to a primary producer or another biotic group with high osmoregulatory capacities, as is the case of E. saurus and M. liza.
Castro-Aguirre (1982) and Raz-Guzmán (1995) highlighted the great influence that environmental variations and biological processes exert on the structure and dynamics of estuarine communities. According to the latter, salinity and temperature are the most relevant factors. Guevara et al. (2007) found that, during the rainy season in the Términos lagoon (Mexico), penaeid shrimp (Peneidae) and crustaceans predominate in the stomach contents of fish, decreasing during the dry season, which corresponds to December, January, and February in the NQL.
Some studies demonstrate the variation in the stomach contents of the main component species of the Cachirra event (Table 8) such as the mugilids Mugil curema, M. incilis, and M. liza, which feed mainly on phytoplankton and secondarily on debris. Mugil curema exhibits the highest consumption of phytoplankton among the three species. These results are similar to those reported by Osorio-Dualiby (2016). Franco and Bashirullah (1992) reported that M. curema feeds preferentially on benthic diatoms, organic debris, inorganic fine sediments, and dinoflagellates. Gómez-Canchong et al. (2004) indicated that M. incilis has a high consumption of detritus, followed by phytoplankton and a very low consumption of zooplankton. Bustos and Pérez (2003) and Cogua et al. (2013) indicated that M. incilis preferably consumes centric diatoms and pennadas and that Mugil liza showed a high consumption of phytoplankton and a low consumption of detritus.
CONCLUSIONS
Climatological, physicochemical, and food availability variables in the dry season exert significant effects on the composition and mortality of fish species in the NQL. These variables determine a sequence of mortality due to the progressive increase in salinity known as the Cachirra event. Mugilidae is a family with a higher number of species resistant to salinity increases, which is due to its great osmotic potential and better nutritional status. Most of the components of the Cachirra event are in juvenile stages. Their length-weight relationship can vary according to sex, sexual maturity, and food intake.
The mineralization of the Navío Quebrao lagoon is affected by different climatic factors (winds, hours of illumination, precipitation, evapotranspiration, tides, solar brightness) and hydrological factors (discharge from the river, current, and tides), as well as by the winds, high temperatures, salinity increases, and accelerated clogging by transport and dumping of sediments by its tributaries, the latter being the most important and meriting the implementation of public strategies that lead to mitigating the felling of trees and extractive activities of the Camarones riverbed, considering that the Cachirra event plays an important role in the cultural identity of the inhabitants of Camarones and serves as sustenance for the economy of the indigenous communities located in their surroundings.

