


 English (pdf)
 Article in xml format
 Article references
 Send this article by e-mail
 Cited by SciELO
  Cited by Google
  Similars in
SciELO
Similars in
SciELO  Similars in Google
 Permalink
1. INTRODUCTION
Nowadays, radars are not only important in warfare scenarios, but in many civilian applications such as sea and air traffic control, meteorology and highway security1. The radar’s main function is detecting objects within its exploration area and estimating their position, speed and movement direction, by processing the echo signal received at the antenna2.
Detecting a radar objective can be often a difficult task because, in most cases, the echo signal is mixed with an interfering component, known as clutter. This component appears as a result of the echo produced on elements surrounding the target. In the case of coastal or ocean exploration, the interfering contribution is called sea clutter. Generally, sea clutter is regarded as a significant problem in the performance of radar devices since it introduces more errors that other types of background signals such as land clutter3.
A radar detector has two basic parameters: the false alarm probability (Pf) and the probability of detection (Pd). These parameters have an inverse proportional relationship, that is, one can be improved by sacrificing the other one. According to the Neyman-Pearson criterion, the false alarm probability takes precedence4. In other words, the designer must first guarantee a certain level of false alarm probability before attempting to increase the probability of detection by other means.
Due to the high amount of received echo signals and their frequent fluctuation, adaptive processing techniques are applied for detection purposes. These sliding window based schemes are known as CFAR (Constant False Alarm Rate) processors, and operate by establishing a threshold based on the average background magnitude5,6.
Regardless of the used CFAR alternative, the applied sliding window mechanism is the same. The window moves throughout the coverage region, and contains a group of reference cells around a central cell that is used to decide on the presence of a target. Each radar resolution cell has a chance to occupy the central position. The reference cells that have not yet occupied the center form the lower window; while those who have been already evaluated constitute the upper window.
The decision about the presence of an objective is taken by multiplying the average of all reference cells by an adjustment factor (T) and comparing the result with the central cell. If the magnitude of the central cell exceeds the calculated threshold, the system will indicate the signal corresponds to a target. Generally, the increase of T benefits the false alarm probability and provokes a loss in the probability of detection7,8.
Radar clutter is heterogeneous because it presents two types of sudden fluctuations: changes in the clutter mean and the occurrence of multiple nearby targets9. These non-homogeneities distort the calculation of the average from the cells in the window and therefore alter the detector’s performance since the operational false alarm probability will deviate from the original value conceived in the design.
For correcting the above problem, different CFAR mechanisms have been presented proposing various ways of estimating the background average. The two schemes that constitute the foundation of the theory of detection are the CA-CFAR (Cell Averaging-CFAR) and OS-CFAR (Ordered Statistics-CFAR)10.
The CA-CFAR is commonly regarded as the reference model for comparing new implementations10-12. It performs the traditional averaging procedure by adding the magnitudes of the reference cells and dividing the result by the number of cells. Nevertheless, it exhibits a weak behavior against heterogeneous signals13.
Moreover, the OS-CFAR computes the background mean by ordering the values and selecting the one that is in the center of the window. Thus, it achieves a better response to the presence of multiple objectives but the estimation made on the average is poor and the solution consumes high processing times9.
Since both the CA-CFAR and the OS-CFAR have limitations in their performance, several authors have proposed different alternatives that solve some of the observed problems. However, the gain of the new implementations is often measured only by comparing it to the CA-CFAR and under specific conditions. There is little reference providing a clear comparison between various solutions under similar conditions.
According to the analysis above, the authors of the current investigation aimed at comparing the performance of several CFAR alternatives regarding the maintaining of the false alarm probability, which is the fundamental detector’s parameter. Initially, they conducted a study about the state of the art which allowed them to select the most promising CFARs. Then, they prepared a sequence of test profiles including multiple heterogeneities in a simulation environment created in MATLAB. Each test profile was presented to the selected architectures, obtaining a characterization and comparison of their performance under critical radar clutter scenarios. The compared alternatives were the CA, OS, MSCA, AND, OR and IS-CFAR processors. The results of the study allow drawing conclusions about which architecture is more suitable to be applied for improving Cuban radar systems.
The paper proceeds as follows. The second section, called “Materials and Methods” introduces the operating principles of the different addressed detectors, along with details of the profiles conceived for testing. The third section, under the name of “Results and Discussion” describes the observed performance of each scheme against the different simulated situations. Finally, in “Conclusions and Future Research”, the main contributions of the investigation are summarized and recommendations are offered for ways of improving the results.
2. MATHERIALS AND METHODS
The current section is divided in two sub-sections for better understanding. In the first one, the selected detectors are presented, with a brief description of each one. In the second sub-section, the conditions in which the experiments were conducted are described, along with the test scenarios.
2.1 CFAR alternatives
The authors first conducted a review of the literature finding about 25 CFAR detectors they consider were the most commonly used. The most important consulted papers were14-34. From these references, six CFARs were selected for the experiments, trying to involve solutions executing different techniques.
The CA-CFAR and OS-CFAR architectures were included in the experiments because they are the classical averaging and ordered statistics processors. The MSCA-CFAR24 (Selection of Clutter Average Minimum-CFAR) processor was selected because it implements an improved averaging technique. The AND-CFAR and OR-CFAR (27, 30) were added as mixed solutions. Finally, the ISCFAR (Improved Switching-CFAR)26 was chosen because it applies switching techniques that are completely different from the previous ones.
2.1.1 MSCA-CFAR processor
The MSCA-CFAR is based on the division of the reference window into several sub-windows of reduced size. This detector extracts the sample with the lower magnitude from each sub-window and computes the average of all minimum values. This approach eliminates the interference from nearby targets but is responsible for a poorer estimate of the clutter average.
Figure 1 shows a block diagram of the MSCA- CFAR’s internal structure. According to its original conception, the system can use any size for the sub-windows that can even share some reference cells. In this project, five sub-reference windows were placed to each side of the central cell. Each sub-window contained 8 cells, so that the first two cells of each sub-window were shared with the last two of the previous one.

2.1.2 AND-CFAR and OR-CFAR processor
The AND-CFAR and OR-CFAR processors are based on a fusion of the CA-CFAR and OS-CFAR techniques. Both alternatives require the calculation of detection thresholds using traditional averaging and ordered statistics methods with the TCA and TOS adjustment factors. The AND-CFAR detects an objective only when the value of the center cell (Y) exceeds both the CA and OS thresholds; whereas the OR-CFAR rejects the existence of an objective only when the magnitude of is smaller than both thresholds.

Figure 2 shows the internal structure of the ANDCFAR and OR-CFAR processors. In the current project, a common T was utilized as a replace of the TCA and TOS factors. This simplifies the scheme’s operation while maintaining its proper functioning.
2.1.3 IS-CFAR processor
Considered as an improvement of the S-CFAR, the IS-CFAR architecture attempts to achieve a better performance under heterogeneous scenarios without applying a very complicated algorithm for estimating the background average. To perform the detection, the processor compares each cell of the window with the center cell multiplied by a correction factor (α). Cells having a magnitude smaller than α are placed in the S0 set; the rest goes to S1. At the end, if the number of samples in S0 surpasses a predefined value (NT), the average is calculated using the cells contained in S0; otherwise the S1 set is used for the same purpose.
In this investigation, the authors worked with α = 0,5 and NT = 32. Therefore, all the cells included in S0 had a magnitude smaller than half the input of the central cell; and the set having more samples was selected for computing the clutter mean.

2.2 Description of the test environment
The CA, OS, MSCA, OR, AND and IS-CFAR detectors were tested using in all cases a 64 cells reference window according to choices made on recent investigations (8, 35, 36) . The processed samples were computer-generated using a Rayleigh distribution whose mean was forced to one. The functions used for clutter modeling were the ones presented and validated in35, corresponding to the following probability density function (1):
 (1)
(1)Initially, Set A was generated having 300 000 groups of 65 samples each. Every group corresponded to an independent occurrence of a sliding window filled with homogeneous clutter. Then, multiple Monte Carlo simulations were performed by continuously adjusting each detector’s T value while processing Set A, until a figure that guaranteed a Pf = 10-3 was obtained, with an error inferior to 1%. The found T was interpreted as the design adjustment factor that guaranteed the wanted Pf. Table I shows the T figures drawn from this experiment.
Table I ADJUSTMENT FACTORS (T) GUARANTEEING Pf = 10-3
| CFAR Processor | Adjustment Factor (T) |
|---|---|
| CA-CFAR | 3,03 |
| OS-CFAR | 3,31 |
| MSCA-CFAR | 10,6 |
| OR-CFAR | 3,31 |
| AND-CFAR | 3,02 |
| IS-CFAR | 3,9 |
Source: the authors
Afterwards, the CFAR processors response to sets with a structure similar to Set A, but including no-homogeneities in each window, was recorded. A total of 11 different profiles sets were defined for testing. The first seven represented different multiple target situations; while the remaining four stood for sudden clutter changes.
As shown in Fig. 4, the multiple target profiles were generated by forcing the background’s average to one. Profiles 1 and 2 contained an interfering objective in the cell number 15 (from left to right) with amplitudes of 3 and 6 respectively; equivalent to a signal to noise ratio of 9,54 dB and 15,56 dB. Profiles 3 and 4 repeated the scenario but changed the interfering target to the position 45 of the sliding window. Finally, profiles from 5 to 7 included high magnitude samples both in cells 15 and 45.
Profiles for clutter magnitude changes are presented in Fig. 5. Profiles 8 and 9 described two sudden increases in the upper window’s amplitude, keeping the center cell in the lower region. Moreover, scenarios 10 and 11 simulated two amplitude reductions where the central cell belonged to the upper portion.


3. RESULTS AND DISCUSSION
The current section presents a characterization of the performance exhibited by the CA, OS, MSCA, OR, AND and IS-CFAR processors after facing the previously described scenarios. More specifically, the analysis is focused on the deviation experienced in the operational false alarm probability.
3.1 Performance against the interfering target profiles
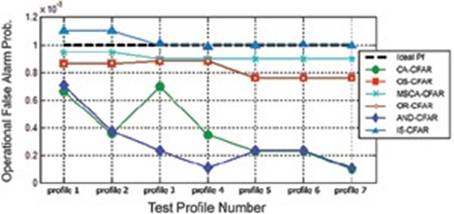
Fig. 6 displays the results of the analysis for profiles from 1 to 7 which contained interfering target situations. As it can be seen, the CA-CFAR and AND-CFAR processors experienced the greatest deviations from the design Pf. This is because interfering objectives directly influence the method for calculating the average applied by these schemes. Besides, it is understandable that the ANDCFAR had displayed the lowest false alarm probabilities: it only detects a target when it’s confirmed both by cell averaging and ordered statistics.
Conversely, the OS-CFAR and OR-CFAR alternatives showed a significantly better performance, which was only beaten by the MSCA-CFAR and the IS-CFAR. Specifically, the IS-CFAR was the one that exhibited the best behavior, maintaining an overall deviation inferior to ten percent from the design. However, the MSCA-CFAR was a challenging rival that even got the best results for the first two profiles, although the difference with the IS-CFAR was not significant. In addition, the MSCA-CFAR was able to maintain its operational Pf always below the design value which is a desired response.
Analyzing Fig. 6 from a general perspective, profiles 1 and 3 were the ones that introduced the slighter alterations in the performance. The fact is justified because they were the ones having interfering targets with the lowest magnitudes. At the same time, it can be concluded that most of the measurements were below the design Pf value. This was an expected result since the addition of objectives in the window causes the average to increase, resulting in higher magnitude thresholds that trigger fewer false alarms.
3.2 Performance against profiles with clutter changes
The processors’ performance against profiles with clutter changes was quite poor compared to that observed for interfering targets. Fig. 7 contains two graphs illustrating the results. On the left, a graph similar to Fig. 6 is presented relating the profile number with the experienced Pf. The same chart is offered on the right but in logarithmic scale.
Source: the authors.
Figure 6 OPERATIONAL FALSE ALARM PROBABILITY EXHIBITED BY THE TESTED DETECTORS AFTER PROCESSING THE FIRST SEVEN PROFILES

Source: the authors.
Figure 7 OPERATIONAL FALSE ALARM PROBABILITY DISPLAYED BY THE TESTED DETECTORS AFTER FACING SCENARIOS WITH CLUTTER LEVEL CHANGES
As it can be seen, no detector maintained a good overall response to the addressed profiles. For scenarios 8 and 11, the best results were achieved by the IS-CFAR which on the contrary was the worst solution to profiles 9 and 10. Maybe the best stability was exhibited by the MSCA-CFAR that had the best behavior for profiles 9 and 10, and maintained a relatively low deviation for profile 11. So, as a conclusion of the experiment, the authors state that the IS-CFAR and the MSCA-CFAR alternatives are the more stable schemes, even though they incurred into considerable fluctuations in some scenarios.
3.3 Processing time
Processing time provides an additional variable for measuring the suitability of each solution. The average time consumed in producing an output for a 65 cells window is shown in Table II. The figures were obtained using a Pentium Dual-Core 2,50 GHz with 2 GB of RAM.
Table II AVERAGE TIME SPENT ON PROCESSING A CLUTTER WINDOW
| Scheme | Time in |
|---|---|
| CA-CFAR | 3,9 |
| OS-CFAR | 8,1 |
| MSCA-CFAR | 7,0 |
| OR-CFAR | 11,35 |
| AND-CFAR | 11,38 |
| IS-CFAR | 6,39 |
Source: the authors.
As expected, the CA-CFAR processor was the one that executed the faster detection because it directly computes the arithmetic average. The OS-CFAR architecture consumed about twice as much time given the required ordering of the samples. The ORCFAR and AND-CFAR schemes took even more time since they need to evaluate both the cell averaging and ordered statistics mechanisms. Meanwhile, the MSCA-CFAR and IS-CFAR consumed slightly less time than the OS-CFAR as they carry out only partial arrangements of the information.
4. CONCLUSIONS AND FUTURE RESEARCH
The performance of six CFAR schemes was tested against 11 computer-generated Rayleigh clutter profiles containing almost 20 million samples. As a result, the authors concluded that the MSCA- CFAR and IS-CFAR alternatives exhibited the smaller deviations of the operational false alarm probability from the value conceived in the design; while completing the performance in a reduced time interval. Nevertheless, certain scenarios with clutter level changes caused all tested processors to strongly fluctuate their false alarm probability, losing thereby their CFAR property.
This paper makes a direct contribution to the theory of CFAR detectors. More specifically, the authors found radar processors with good overall performance that can be applied to improve the detection systems of Cuban coastal radars. Also, the simulated architectures will be included in the MATE-CFAR 2 test environment which is a progression of the first version of MATE-CFAR presented in7. This environment has both educational and research purposes since it will allow simulating multiple clutter modeling distributions and CFAR alternatives.
It is considered that it would be helpful to reproduce the current study including other CFAR algorithms, searching mostly for an improved response to clutter level changes. Likewise, the addition of new test profiles containing more than one interfering target and more than one clutter level change is recommended. The authors will focus next in the test of the addressed detectors regarding the probability of detection.

