


 English (pdf)
 Article in xml format
 Article references
 Send this article by e-mail
 Cited by SciELO
  Cited by Google
  Similars in
SciELO
Similars in
SciELO  Similars in Google
 Permalink
INTRODUCTION
The Arecaceae family is one of the most numerous in the plant kingdom, highlighting its diversity in the tropical zones of the world (Galeano & Bernal, 2010). This family is made up of 190 genera and 2,360 species distributed in tropical and subtropical areas around the world, with Asia and America being the tropics' richest in species (Galeano & Bernal, 2010). Colombia is the second-richest country in palm trees in America and the third in the world, after Malaysia and Brazil (Galeano et al., 2015; MADR - Ministerio de Agricultura y Desarrollo Rural, 2021). Since it has approximately 250 species belonging to 45 genera (Galeano & Bernal, 2005) geographically distributed in the Amazon, the Caribbean, the Pacific, and the Andes of the country (Galeano & Bernal, 2010).
Wild palms are one of the most useful groups of plants in the tropics, and their ethnobotanical importance is undeniable (Bernal et al., 2011). In addition to their ecological importance and contribution to biodiversity, palms constitute a resource of socio-cultural and economic importance and have been traditionally used as raw materials for various purposes (Valois-Cuesta et al., 2013).
Mauritia flexuosa is known by the names of moriche in the Eastern Plains of Colombia, canangucha, cananguche or canangucho in the departments of Caquetá and Putumayo, burití and mirití in Brazil, moriche in Venezuela, aguaje in Peru, morete in Ecuador, and palm real in Bolivia (Trujillo-González et al., 2011). It is abundant in the Orinoco savannahs and the Amazon Rainforest and is considered an important socioeconomic resource for indigenous communities due to its multiple uses and edible fruits (Gilmore et al., 2013; Virapongse, 2017a). Its fruit is widely used in the production of sweets and ice cream, while the oil is used for cooking and serves as a raw material for the cosmetics industry (Freire et al., 2016; Milanez et al., 2016; Speranza et al., 2016). Previous studies have highlighted the importance of this species for its nutritional value due to the presence of antioxidants and antimicrobial capacity (Koole et al., 2013). Due to its high anthocyanin content, the fruit decreases free radical levels, lipid peroxidation, and proinflammatory state (Quiroga et al., 2017). This species is a source of fibers for the elaboration of handicrafts for indigenous Sikuani communities (Mesa-Castellanos et al., 2017).
Other palms that stand out for their importance in the communities that inhabit the Amazon region belong to the Euterpe genus, such as edulis, oleraceae, and precatoria. The latter (E. precatoria Mart.) is known in countries like Brazil and Colombia as heart of palm. Its fruits are the traditional food of the Amazonian inhabitants; they are harvested from natural populations, employing management practices that have repercussions on the harvested populations and their productivity (Aranguren et al., 2014). They have a high economic potential because all parts of the plant are used for food, such as the fruit in smoothies, ice creams and juices; for the construction of houses using the leaves; and for pharmaceutical use to treat muscle pain and snake bites where the roots and stem are used (Aranguren et al., 2014).
E. oleracea, better known as asaí or açaí in Portuguese, is used by the native populations of the Amazon basin of Brazil, Colombia, Venezuela, Ecuador, and Suriname as food in drinks and desserts (Galate et al., 2014). Regarding its economic importance, the açaí pulp obtained from fruits shows a remarkable richness in bioactive compounds, dietary fibers, vitamins, and minerals (Clarke et al., 2011; Yamaguchi et al., 2015).
Despite the economic, social and environmental importance, the genetic variability existing in wild palms, mainly of the genus Mauritia and Euterpe, is unknown, which is a limitation to having a better understanding of the genetic structure, dispersal, phylogenetic relationships, and population dynamics of the species that make up these genera. In addition to the above, the lack of knowledge of genetic diversity limits the identification of elite genotypes, as well as their possible use as a source of potentially useful genetic variation.
The concern for the loss of variability and the extinction of valuable species with great economic potential has aroused interest in carrying out genetic diversity studies in order to obtain information that contributes to their conservation and sustainable use. Molecular markers are a valuable tool that has been frequently used in studies like these (Ramos et al., 2021).
Inter-Simple Sequence Repeat (ISSR) molecular markers are DNA segments located between repetitive nucleotide sequences, which generally occur in non-coding regions of the genome. They are dominant markers and have the advantages of being simple, fast, highly reproducible, and highly polymorphic, as well as requiring small DNA amounts, which makes them highly informative (Gupta et al., 2021; Ghanbari et al., 2022).
The ISSR technique has been used successfully for the assessment of genetic diversity and phylogenetic studies in plants (Ma et al., 2021; Yancheva & Mavromatis, 2021; Mir et al., 2021; Hocaoglu-Ozyigit et al., 2022). Molecular characterization studies in wild palms have been carried out with ISSR markers (Rossi et al., 2014; Chagas et al., 2015; Pinheiro et al., 2017; Madar et al., 2019). The objective of this study was to evaluate the genetic diversity of wild palms Mauritia flexuosa, Euterpe precatoria, and Euterpe oleracea with ISSR molecular markers.
MATERIALS AND METHODS
Plant material. Fifty-one genotypes of wild palms from the departments of Meta, Nariño, Guaviare, Caquetá, Guainía, Putumayo, Vaupés, and Amazonas were evaluated. The species M. flexuosa, E. oleracea, and E. precatoria were included, which consisted of 11, 18, and 22 genotypes, respectively (Table 1). Three to four leaflets were taken from each accession, in good phytosanitary condition, stored in silica gel and transported to the laboratory, where they were stored at a temperature of -20°C.
Table 1 Genotypes of wild palms used for molecular characterization with ISSR markers.
| ID | Species | Department | Municipality | Latitude | Length |
|---|---|---|---|---|---|
| 6 | E. oleracea | Meta | Villavicencio | 04°03'32.98''N | 073°27'55.29''O |
| 8 | E. oleracea | Vaupés | Mitú | 01°15'58.12"N | 070°12'16.61"O |
| 17 | E. oleracea | Guainía | Inírida | 03°54'4.25"N | 067°54'00.69"O |
| 18 | E. oleracea | Vaupés | Mitú | 01°15'58.12"N | 070°12'16.61"O |
| 20 | E. oleracea | Nariño | Tumaco | 01°47'18.16"N | 078°46'44.94"O |
| 21 | E. oleracea | Nariño | Tumaco | 01°47'18.16"N | 078°46'44.94"O |
| 22 | E. oleracea | Nariño | El rosario | 01°44'32.93"N | 077°20'09.85"O |
| 23 | E. oleracea | Nariño | Tumaco | 01°44'32.97"N | 077°20'10.73"O |
| 25 | E. oleracea | Nariño | Tumaco | 01°47'18.16"N | 078°46'44.94"O |
| 26 | E. oleracea | Nariño | Tumaco | 01°47'18.16"N | 078°46'44.94"O |
| 27 | E. oleracea | Nariño | S. Domingo | 01°36'20.06"N | 078°50'40.92"O |
| 28 | E. oleracea | Nariño | S. Domingo | 01°36'20.06"N | 078°50'40.92"O |
| 33 | E. oleracea | Guaviare | San José | 02°31'36.05"N | 072°38'47.52"O |
| 34 | E. oleracea | Guaviare | San José | 02°31'36.05"N | 072°38'47.52"O |
| 46 | E. oleracea | Amazonas | Leticia | 04°08'38,4'' S | 069°57'22,0'' W |
| 47 | E. oleracea | Amazonas | Leticia | 04°08'42,0'' S | 069°57'22,2'' W |
| 50 | E. oleracea | Amazonas | Leticia | 03°45'50,2'' S | 070°23'30,2'' W |
| 51 | E. oleracea | Amazonas | Leticia | 03°45'50,7'' S | 070°23'25,1'' W |
| 1 | E. precatoria | Meta | Villavicencio | 04°03'32.98''N | 073°27'55.29''O |
| 2 | E. precatoria | Guaviare | San José | 02°31'49.83''N | 072°40'06.76''O |
| 3 | E. precatoria | Putumayo | Mocoa | 0°22'32.26''N | 075°05'42.89''O |
| 4 | E. precatoria | Putumayo | Mocoa | 0°22'32.26''N | 075°05'42.89''O |
| 5 | E. precatoria | Guaviare | San José | 02°33'54.76"N | 072°35'49.72"O |
| 7 | E. precatoria | Caquetá | Florencia | 01°36'48.74"N | 075°39'17.33"O |
| 9 | E. precatoria | Guainía | Inírida | 03°54'4.25"N | 067°54'00.69"O |
| 10 | E. precatoria | Guaviare | San José | 02°31'36.05"N | 072°38'47.52"O |
| 11 | E. precatoria | Guainía | Inírida | 03°54'4.25"N | 067°54'00.69"O |
| 12 | E. precatoria | Guaviare | San José | 02°31'49.83''N | 072°40'06.76''O |
| 13 | E. precatoria | Guaviare | San José | 02°31'49.83''N | 072°40'06.76''O |
| 14 | E. precatoria | Amazonas | Leticia | 03°48'37.54"S | 070°17'53.03"O |
| 15 | E. precatoria | Guaviare | San José | 02°31'36.05"N | 072°38'47.52"O |
| 19 | E. precatoria | Guainía | Inírida | 03°54'4.25"N | 067°54'00.69"O |
| 24 | E. precatoria | Putumayo | Mocoa | 0°22'32.26''N | 075°05'42.89''O |
| 29 | E. precatoria | Meta | Villavicencio | 04°03'32.98''N | 073°27'55.29''O |
| 30 | E. precatoria | Guaviare | San José | 02°36'4.43"N | 072°37'10.28"O |
| 31 | E. precatoria | Guaviare | San José | 02°36'4.43"N | 072°37'10.28"O |
| 32 | E. precatoria | Guaviare | San José | 02°36'4.43"N | 072°37'10.28"O |
| 48 | E. precatoria | Amazonas | Leticia | 04°07'54,1'' S | 069°57'14,4'' W |
| 49 | E. precatoria | Amazonas | Leticia | 04°07'54,5'' S | 069°57'15,1'' W |
| 52 | E. precatoria | Amazonas | Leticia | 04°08'41,1'' S | 069°57'18,3'' W |
| 35 | M. flexuosa | Meta | Puerto Gaitán | 04°18'30.53"N | 072° 5'21.81"O |
| 36 | M. flexuosa | Meta | Puerto Gaitán | 04°18'30.53"N | 072° 5'21.81"O |
| 37 | M. flexuosa | Meta | Puerto Gaitán | 04°18'30.53"N | 072° 5'21.81"O |
| 38 | M. flexuosa | Meta | Puerto Gaitán | 04°18'31.42"N | 072° 5'22.73"O |
| 39 | M. flexuosa | Meta | Puerto Gaitán | 04°18'31.42"N | 072° 5'22.73"O |
| 40 | M. flexuosa | Meta | Villavicencio | 04° 2'49.50"N | 073°32'47.50"O |
| 41 | M. flexuosa | Meta | Villavicencio | 04° 5'37.56"N | 073°36'49.88"O |
| 42 | M. flexuosa | Meta | Villavicencio | 04° 5'37.64"N | 073°36'49.97"O |
| 43 | M. flexuosa | Meta | Villavicencio | 04° 5'37.35"N | 073°36'50.39"O |
| 44 | M. flexuosa | Meta | Villavicencio | 04° 5'37.35"N | 073°36'50.80"O |
| 45 | M. flexuosa | Meta | Villavicencio | 04° 5'37.54"N | 073°36'50.83"O |
DNA extraction and PCR conditions. DNA extraction was carried out in the Plant Biotechnology, Animal Reproduction, and Genetics laboratories at the Universidad de los Llanos (Villavicencio, Meta). Genomic DNA was extracted using the DNA Extraction Kit (PowerSoil®) and DNA Isolation Kit - MO BIO Laboratories. DNA quality evaluation was performed using 0.8% agarose gels run in 0.5X TBE Buffer (0.045M Tris-Borate; 0.001M EDTA) at 80 volts for 45 min, using a Maxicell Primo EC-340 Electrophoresis Gel System chamber. To determine the amount and concentration of extracted DNA, the NanoDrop ND-1000 spectrophotometer was used. The quantified DNA was diluted in distilled water with a volume of 100µl to 10ng/µl. Seven ISSR-type primers (Technologies Inc.), whose sequence is shown in Table 2, were used.
Table 2 ISSR primers used to determine genetic diversity in wild palms.
| Primer | Sequence (5’ - 3’) |
|---|---|
| CCA | DDB(CCA)5 |
| CGA | DHB(CGA)5 |
| TG | HVH(TG)7T |
| AG | HBH(AG)7ª |
| CT | DYD(CT)7C |
| CA | DBDA(CA)7 |
| ACA | BDB(ACA)5 |
Degenerate sites: H (A or T or C); B (G or T or C); V (G or A or C); D (G or A or T); Y (C or T).
The amplification reaction was prepared in a final volume of 25 µl. The reaction mixture included 1X Buffer, 1.5 mM MgCl2, 0.2 mM dNTPs, 1U Taq Polymerase, 2 µM primer, and 10ng genomic DNA. Amplification was carried out in a LabNet Multigene Optimax thermal cycler. Initial denaturation was at 95°C for 5 minutes; denaturation at 95°C for 30 seconds; annealing at 50°C (AG, CA and ACA primers); 55°C (CCA, CT and TG primers) and 58°C (CGA primer) for 45 seconds; an extension at 72°C for 2 minutes; 37 cycles from denaturation to extension; and finally, an extension at 72°C for 7 minutes. The amplified products were separated by electrophoresis on 1.2% agarose gels stained with GelRed. The samples were run at 150 volts for 1 hour, and visualization was performed in a Benchtop UV transilluminator M-15.
Statistic analysis. A binary matrix of absence (zero) and presence (one) was constructed. The similarity estimate was calculated using the method of Nei & Li (1979). The cluster analysis was performed using the UPGMA method, and a dendrogram was generated using the statistical package NTSYS-pc version 2.0. The cophenetic correlation coefficient, which is a measure between the similarity values of the dendrogram and those of the original similarity matrix, was calculated using the COPH and MXCOMP programs of the NTSYS-pc statistical package version 2.0.
An analysis of molecular variance (AMOVA) was performed using GenAlEx software version 6.2 (Peakall & Smouse, 2012) with 999 permutations in order to determine the differences between and within the groups formed. To estimate the average heterozygosity parameters (HE) and the percentage of polymorphic loci, the unbiased formula of Nei & Li (1979) was used, which is defined as Sij= 2Nij/(Ni + Nj), where Nij is the number of bands present in cultivars i and j, and Ni and Nj represent the number of bands present in cultivars i and j, respectively. The unbiased F statistic was determined with a 95% confidence interval. These analyzes were performed using the TFPGA statistical package (Tools for Population Genetic Analyzes, version 1.3) (Miller, 1997).
RESULTS AND DISCUSSION
Genetic diversity with ISSR. The seven primers used for the characterization of 51 palm genotypes generated a total of 153 amplified bands with molecular weights between 200 and 1000 bp, which ranged from 15 for the CT primer to 34 for the CGA primer (Table 3).
Table 3 Genetic diversity statistics (Nei, 1973) estimated from ISSR data evaluated in palm genotypes.
| Primer | Bands | Polymorphic loci | HE | Polymorphic loci (%) | Fst |
|---|---|---|---|---|---|
| ACA | 30 | 29 | 0.87 | 95.49 | 0.26 |
| AG | 18 | 16 | 0.66 | 87.00 | 0.08 |
| CA | 18 | 17 | 0.54 | 93.62 | 0.16 |
| CCA | 20 | 16 | 0.47 | 79.81 | 0.18 |
| TG | 18 | 16 | 0.78 | 91.20 | 0.27 |
| CT | 15 | 13 | 0.64 | 87.64 | 0.18 |
| CGA | 34 | 33 | 0.97 | 96.90 | 0.29 |
| Mean | 153 | 140 | 0.70 | 90.24 | 0.20 |
HE: expected average heterozygosity. Fst: coefficient of genetic differentiation.
In a study of three populations of the moriche palm M. flexuosa using nine ISSR markers, 97 polymorphic bands were reported in 51 individuals evaluated (Rossi et al., 2014). Cardona et al. (2018) obtained 241 estimated alleles with a minimum of 17 alleles on the CGA primer and a maximum of 47 alleles for the ACA primer by evaluating seven ISSR primers in African palm (E. guineensis Jacq.). When comparing these studies carried out in different plant species, the number of estimated alleles obtained (153) in this research can be considered adequate to estimate genetic parameters.
The genetic diversity of Nei or diversity or expected heterozygosity (HE) was 0.70, which reveals a high genetic diversity in the palm genotypes evaluated. The highest HE values were found in the CGA primers with 0.97, ACA with 0.87, and TG with 0.78, while the lowest value corresponded to the CCA primer with 0.47 (Table 3). The high HE value (0.70) indicates that the results could be influenced by the allogamous nature of the species evaluated, which tends to favor the conservation of a high percentage of heterozygotes. According to Gomes et al. (2011), the high genetic diversity observed in populations of M. flexuosa is due to the fact that the species is allogamous. Regarding the species E. oleracea and E. precatoria, despite being monoecious plants, the fertilization process is generally crossed due to the high degree of self-incompatibility, as well as the non-synchronization in the maturation of the reproductive organs, which favors allogamy (Calzavara, 1972).
The results found here agree with those reported by Ramos et al. (2021), who found high genetic diversity (HE=0.66) when evaluating the genetic structure in populations of Euterpe precatoria Mart. in the Brazilian Amazon with microsatellite markers. Carvalho et al. (2020) found high heterozygosity values (He= 0.68) in their study of genetic diversity of E. edulis with microsatellite markers. In studies of genetic diversity in the species M. flexuosa using microsatellite markers, are reported the investigations of Sander et al. (2018), who found high genetic variation (HE = 0.63-0.74), Melo et al. (2018) obtained HE values between 0.52-0.88 and Montúfar et al. (2020) average HE values of 0.70.
Similar results were found in other palm species, such as the date palm Phoenix dactylifera (Yusuf et al., 2015), the oil palm Elaeis guineensis Jacq. (Gan et al., 2021), and Oenocarpus bataua (Escobar et al., 2018), which could indicate a behavior common to plants of the Arecaceae family.
The average polymorphism percentage obtained was 90.24%, where the ACA and CGA primers showed the highest values, corresponding to 95.49 and 96.90%, respectively (Table 3). These primers were the ones that contributed the most to diversity and may be appropriate for use in future research on the evaluation of genetic diversity and population structure of wild palms. It should also be noted that the primers AG, CA, CCA, TG, and CT showed important values of polymorphism; however, the CCA primer was the one with the lowest value (79.81), for which reason it was considered the primer with the least contribution to genetic diversity. Similar results were reported by Castro et al. (2022), who found that the level of polymorphism detected in the evaluated populations of M. flexuosa using microsatellite markers was high, above 90%.
In the characterization of 10 date palm cultivars, Phoenix dactylifera, using ISSR and AFLP molecular techniques, it was found that the level of polymorphism between cultivars for ISSR ranged from 20 to 100% with an average of 85%, while the levels of polymorphism for AFLP varied from 63 to 84% with an average of 76% (Sabir et al., 2014). Gomes et al. (2011), when evaluating the genetic diversity in four populations of M. flexuosa with AFLPs markers, observed an average percentage of polymorphism comprised between 82% and 99.1%.
The fixation index (F st ) yielded a value of 0.20. According to Wright (1978), this value indicates a moderate genetic differentiation. This is possibly due to the existing gene flow between the palm tree genotypes evaluated, showing that there are no crossability barriers or marked differences between the species. The TG and CGA primers presented a high level of polymorphism, as well as exhibiting high F st values of 0.27 and 0.29, respectively, concerning the other primers evaluated (Table 3). Therefore, they could be useful to achieve greater differentiation between the genotypes of the genera Euterpe and Mauritia evaluated. The AG primer was the one that yielded a F st of only 0.08, thus being the lowest of the primers used.
The moderate differentiation found in the present study can be explained by the cross-pollination typical of these palm species, the transport of plant material carried out by man, or by migration events of strains or seeds by water currents, birds and other animals. Works on palms have reported that the fruits of E. precatoria and E. oleracea are part of the diet of several animals that are seed dispersers in the forest, being the birds of the Psittacideae, Ramphastidae, and Cracidae families, the main wild animals that help in seed dispersal (Rocha & Viana, 2004). According to Virapongse et al. (2017b), the swamps where populations of Mauritia flexuosa develop host a high density and diversity of animals (primates, ungulates, rodents, frugivorous birds, and even reptiles and fish) that consume their lipid-rich fruits. Consequently, it has been assumed that this faunal diversity could favor an important seed-mediated gene flow (Montúfar et al., 2020).
Ramos et al. (2018), in their study of the natural populations of E. precatoria, found low genetic differentiation and high pollen flow. The authors reported that these results could be influenced by animals as the main pollen dispersal vector, which pollinate different plant species in tropical forests. Similar results have been reported using ISSR (Sugai et al., 2016) and SSR (Carvalho et al., 2020) markers.
For their part, Coelho et al. (2020) found a moderate to high F st value among the E. precatoria populations analyzed (from 0.10 to 0.37), indicating limited gene flow among the populations analyzed. The authors affirm that the differences found among the populations of this palm should not be related to habitat fragmentation but to evolutionary events that occur naturally, such as local adaptation (Brancalion et al., 2018). Likewise, they affirm that the pattern of genetic differentiation found among the populations is probably influenced mainly by morphological differences.
In contrast, Santos-Cochev-da-Cruz et al. (2022), in their work on genetic diversity and population structure in populations of E. precatoria, found high genetic differentiation (F st =0.77), low heterozygosity, and high inbreeding rate in all loci evaluated. According to the authors, the results could be influenced by the low flow of pollinators and by the reduction in the number of E. precatoria individuals in the fragments.
Cluster Analysis
The UPGMA average genetic clustering analysis based on the Nei & Li (1979) similarity coefficient clustered the palm genotypes into six groups at a similarity level of 37% (Figure 1). According to the cophenetic correlation coefficient, a high correlation was detected (r=0.83), which indicates that the dendrogram faithfully represents the values of the similarity matrix.
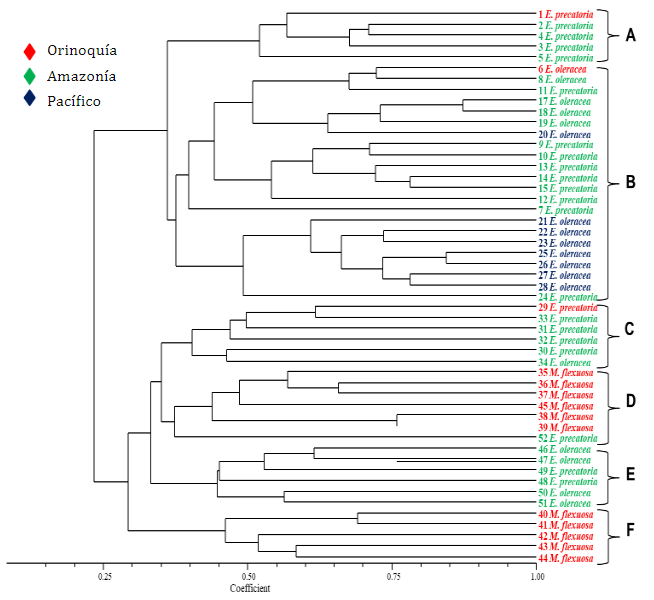
Figure 1 Dendrogram for the 51 wild palm genotypes, based on the Nei-Li (1979) similarity coefficient and estimated with seven ISSR markers.
It can be seen that group A was formed by five genotypes, while group B was the one that gathered the highest number of genotypes (22) corresponding to E. oleracea species with 13 genotypes and E. precatoria with nine from the Amazon and Pacific regions. Within this group, a subgroup with a similarity level of 40% was formed mainly by genotypes of the E. oleracea species collected in the department of Nariño.
Group C consisted of two E. oleracea genotypes and four E. precatoria, for a total of six genotypes. Similarly, group E consisted of six genotypes, of which half corresponded to the species E. oleracea and the rest to E. precatoria. The tendency of grouping genotypes of these two species in groups A, B, C, and E is possibly due to the constant flow of genes or the presence of common alleles that share the genotypes because they are species of the same genus.
Groups D and F were made up of individuals of the species M. flexuosa, which were collected in the department of Meta, which is part of the Orinoquía region. It is worth mentioning that group F was the one that presented the lowest degree of similarity, corresponding to 29%. Possibly, this is due to the morphological characteristics of the species as well as the presence of unique alleles, which make the individuals separate from the rest of the formed groups. The characterization with morphological descriptors could be useful to complement the molecular characterization and thus identify promising genotypes that can be included as parents in recombination programs.
The ISSR technique allowed for the discrimination of genotypes not only by the species to which they belong, i.e., E. oleracea, E. precatoria, and M. flexuosa, but also by their place of origin. Therefore, this technique can be considered a useful tool for assessing genetic diversity in populations.
The AMOVA revealed that 89% of the variation observed in this study was attributed to genetic differentiation within the groups formed, and the remaining 11% was due to the genetic variance component between groups (Table 4). Our results agree with those reported by Rossi et al. (2014) when evaluating three populations of M. flexuosa with ISSR markers, where AMOVA showed that 84.1% of the total genetic variation was within populations, while 15.9% was between populations. Similar results have been reported by Ithnin et al. (2017) and Montúfar et al. (2020).
Table 4 Molecular Analysis of Variance (AMOVA) for the groups formed with the seven ISSR markers.
| Source of variation | Degrees of freedom | Sum of squares | Middle Square | Total variation |
|---|---|---|---|---|
| Between groups | 2 | 127.48 | 63.74 | 11% |
| Within groups | 48 | 999.22 | 20.82 | 89% |
| Total | 50 | 1,126.71 | 100% |
The high variation found within the groups formed suggests that it is necessary to complement this information with other types of analysis, such as genetic structure, phylogenetic studies, as well as morpho agronomic characterization of characteristics of economic importance, among others. This will allow a better understanding of the genetic structure and population dynamics of the species evaluated in this study.
CONCLUSIONS
The seven ISSR markers used for characterizing the fifty-one (51) palm genotypes generated a total of 153 amplified bands, showcasing a polymorphism range from 87.00 to 96.90, with an average of 90.24.
The expected heterozygosity (HE) has a range of 0.47 to 0.97, with a mean of 0.70, which reveals a high genetic diversity in the evaluated palm genotypes. The high HE value (0.70) indicates that the results could be influenced by the allogamous nature of the species evaluated, which tends to favor the conservation of a high percentage of heterozygotes.
The fixation index F st has a value between 0.08 and 0.29, with an average of 0.20, showing a moderate genetic differentiation. The moderate differentiation found in the present study can be explained by the cross-pollination typical of these palm species, the transport of plant material carried out by man, or by migration events of strains or seeds by water currents, birds, and other animals.
The UPGMA average genetic clustering analysis based on the Nei & Li (1979) similarity coefficient clustered the palm genotypes into six groups at a similarity level of 37%, indicating a high correlation (r=0.83).

