


 English (pdf)
 Article in xml format
 Article references
 Send this article by e-mail
 Cited by SciELO
  Cited by Google
  Similars in
SciELO
Similars in
SciELO  Similars in Google
 Permalink
I. INTRODUCTION
If a person is looking for a new way to get around the city, they might want to try augmented reality. It is a technology that overlays computer-generated images into the user’s view of the real world, and can be used for a variety of purposes, including navigation. There are a few different augmented reality apps that can be used for orientation; they all work in slightly different ways. Some use phone’s GPS to show the user a map of their environment with arrows and superimposed instructions. Others use the camera to show a view of the surrounding world with icons for different sights superimposed on the screen.
Augmented reality [1] has existed for many years, but it only gained ground recently due to advances in technology and miniaturization. This has led to greater processing power and lower costs, making it more accessible to the general public. In the professional realm, augmented reality can be used to interact with virtual interfaces in the real world, allowing architects or clients to see a proposed structure in the intended location. This can give a more accurate idea of what the final product will look like. Similarly, augmented reality [2] has the potential to be used in large complexes such as airports, educational campuses, and factories. This would allow visualizing real-time information of these places, through indications, advertising, or tourism, and it would be practical and descriptive for those who are not familiar with the place.
This article aims to show the development of an augmented reality tool that helps people orient themselves in large places, such as auditoriums and rooms. The mobile information system used by the camera to generate elements superimposed on the real world, in this case a graphical interface, provides detailed and dynamic information about the environment or place where it is located, and the user can interact with it. The system was validated in a controlled environment: a university campus.
An investigation on the previous works -or those related to augmented reality- was carried out to understand how the proposal presented in this article is different from other works. The research focused on identifying the main areas of the augmented reality technology that had already been explored, identify innovations or improvements in existing solutions, and investigate possible applications for the proposed augmented reality tool, two of which were highlighted.
A. Campus Guide Using Augmented Reality Techniques [3]
Augmented reality techniques are being used to create an app that facilitates students and faculty members access the campus information. This includes the availability of classrooms, internet connection, opening hours of the administrative offices, and contact details to communicate easily with the person in charge. This application is not only practical and innovative for the user, but also allows them to obtain information through augmented reality using the camera of their mobile device. This is especially enhanced for newcomers, who can use it to navigate the campus and improve their arrival times to classrooms.
B. Augmented reality mobile application for the location of classrooms on the Porvenir Campus of the University of Amazonia [4]
The SARA mobile application has been developed in this University so that students, especially new ones, can find their classrooms in the educational complex. This application uses augmented reality to indicate the exact location of the different areas at Campus Porvenir. It helps students to find their classrooms in a more effective and timely manner, thus avoiding being late, entering the wrong classrooms, or interrupting the development of tasks. The table 1 presents a comparison between OARU and related works.
Table 1 Comparative table of related articles.
| Item name | Orientation system using Augmented Reality for Universities (OARU) | Campus Guide Using Augmented Reality Techniques [3] | Augmented reality mobile application for the location of classrooms on the Porvenir Campus of University of Amazonia [4] |
|---|---|---|---|
| Methodology | Level of research on this type of application | None | Methodological design composed of the exploratory and projective method. |
| Technologies |
|
|
|
| Object |
|
Facilitate the collection of data and opening times of the faculty rooms through augmented reality; flat information is shown in 2D (includes additional information of the room). | Learning about the university environment through 3D models generated or superimposed on the reference label. |
The OARU information system presents distinctive elements compared to the related works, which played an important role in the construction of and support to the proposed problematic.
III. METHODOLOGY
This work was proposed under a documentary design and the approach was based on the qualitative method, which aims to find the solution of the problem directly in the environment, i.e., it was possible to select two levels of research to have a composite methodology that best suits the needs. Its characteristics are described below.
A. Application Research
This level of research makes it possible to find innovative treatments or solutions to the problems presented in the article. Then, an intervention was made according to the needs of the population. To validate the impact, the results are evaluated considering previously defined indicators.
B. Descriptive Research
The characteristics of the involved parties can be presented through descriptive research; in addition, it is necessary to analyze the difficulties that arise at the University campuses regarding the ease of orientation and obtaining information on the available environments. The information was acquired through surveys, without neglecting the observation necessary for the correct analysis of usability tests.
C. Documentary Research Design
CyberGraphic sources allow us to identify the implementation of augmented reality in different alternatives and techniques. The work was divided into phases to give structure and solution to the main idea. Phases are composed of orderly activities referring to the PMBOK Guide [5]. The development methodology was also considered to establish them: Phase 1. Start and planning; Phase 2. Execution; Phase 3. Validation.
1) Start and Planning. To determine the methodology to be used, a characterization was carried out to find out which one fits the needs of the work team better. To this end, 3 Agile development methodologies were evaluated based on qualitative and quantitative criteria. Considering the characteristics, the XP methodology [6] [7] adapted better to the needs of the development team and obtained a higher score, as shown in Table 2.
Table 2 Characterization of development methodologies.
| Feature/ Methodology | Scrum | XP | Kanban | |||
|---|---|---|---|---|---|---|
| Task | Sprints | 4 | Iterations | 5 | List of tasks (priority) | 4 |
| Role definition | Yes | 1 | Yes | 1 | No | 0 |
| Partial deliveries | Yes | 1 | No | 0 | No | 0 |
| Flexible about new requests | No | 0 | Yes | 1 | Yes | 1 |
| Visualization of the execution process | Yes | 1 | No | 0 | Yes | 1 |
| Application only in software development | No | 0 | Yes | 1 | No | 0 |
| Score | 7 | 8 | 6 | |||
Based on the development methodology, requirements were structured as user stories; in this way, the information was obtained from the perspective of the end user, and the requirements were made on the roles of administrator and end user. To understand the structure of user stories, the following parts were identified:
How: The type of user or role within the system.
I want: The need, suggestion, or requirement from the user’s perspective.
For: Purpose or utility expected from the system.
Then: Expected result or consequence after completion or fulfillment of the user story.
Table 3 presents an example of a student role user story.
To visualize the operation and interaction of users or actors with the different systems correctly we made a functional diagram, as seen in Fig. 1.

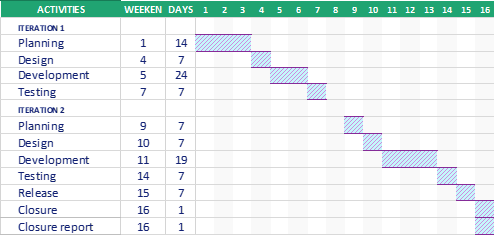
Once the methodologies and delimitations were established, a schedule of activities was set. It was necessary to fulfill the previously established phases. To do this, we considered the development times and the number of activities, as a result we obtained an iteration plan Table 4 4).
Table 4 Iteration plan.
| Iteration | User Story | Task |
|---|---|---|
| 1 | User account | Authentication and registration interface design |
| 1 | Element generation | Design of the AR interface |
| Generating an element for an environment | ||
| 1 | Handling overlapping elements | Design of interactive element options |
| Response of overlapping elements to interaction. | ||
| 1 | Select Schedule | Creation of a local database |
| List subjects | ||
| Select and save the course | ||
| 1 | Customize schedule | Add event |
| Modify courses | ||
| Delete inserted course or event | ||
| 1 | User preferences | Update data |
| Delete account | ||
| 1 | Manage events | Interface design for event management |
| 1 | Manage administrators | Interface design for managing administrators |
| 2 | Manage events | Add information |
| Edit information | ||
| Find information | ||
| Delete information | ||
| 2 | Manage administrators | Add administrator |
| Edit administrator | ||
| Find administrator | ||
| Remove administrator | ||
| 2 | Massive upload of events | Design the interface in Excel |
| Read the timetable file | ||
| Generate a single format file | ||
| Website design | ||
| Save information in the database | ||
| 2 | Connect spaces | Web interface design |
| Add the corresponding references of each room | ||
| 2 | Directions for Locating the room | Add location data to other rooms |
| Add access button to Crawl’s function |
Once the activities were established in each iteration, it was possible to set up a schedule of activities (Fig. 2). By adjusting the time required for each task, it was possible to make a partial delivery within the agreed schedules, to later carry out the analysis and corrections for the next iteration.
2) Execution. In this phase, the designs and development of the augmented reality [8] mobile application and the administrative systems were carried out. For this, it was necessary to use different types of tools and technologies to construct the system.
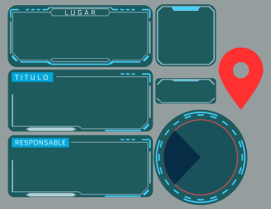
In the first activity, the mockups and interfaces were made. For this, it was necessary to use tools such as Figma ( Fig. 3) And Unity editor (Fig. 4), and the pieces that make up the UI (User Interface) of augmented reality were joined.

In the second activity, the class, responsibility, and collaboration (CRC) cards were elaborated. They correspond to the object-oriented development methodology that facilitates communications between classes. It is also known by making it easier to understand the connections between objects and because the entire development team can contribute an example of a card corresponding to the login, which has a header that refers to the name of the class. It also describes the responsibility it fulfills and if there are other related classes, such as the User class (Table 5).
Table 5 Example of CRC cards.
| Login | |
|---|---|
| Responsibility | Collaboration |
| The user can login to the system | User |
| Verify/validate data | |
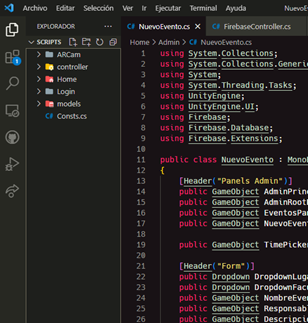
In the third activity, corresponding to coding, Unity was used to develop the application and to implement augmented reality through the AR Foundation Framework. Unity is complemented with an external code editor; thus, it was necessary to use Microsoft Visual Studio Code tool, as shown in Figure 5.
For persistence within the application, the local SQLite database was used. Moreover, the Google Firebase platform was removed [9], some of its cloud storage services were used (Fig. 6).

Additionally, in the last iteration, we identified the need to optimize the tasks corresponding to the administrator role; therefore, a large part of the process of uploading the schedules to the database was automated, this task must be carried out before starting a new semester. To obtain the events corresponding to each room, macros developed in the Visual Basic editor were used (Fig. 7), which generated a .CSV file for bulk upload to the system.

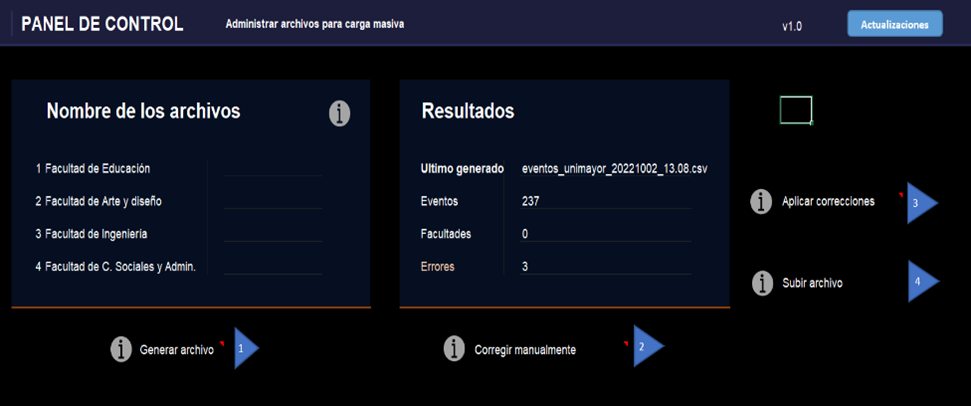
It was also necessary to facilitate the process of uploading many files to the system; therefore, a website where the managers -in this case those with the role of administrators- upload the information in a few steps was developed (Fig. 8).

3) Validation. Validations, i.e., the acceptance tests, are the final phase of each iteration, they assess if the results satisfy the end user requirements. In this way, we verify if each user story is fulfilled. An example of the evaluation of a user story was the generation of elements in augmented reality, as shown in Table 6, which presents the need to generate elements -specifically virtual interfaces with the information of the rooms- in augmented reality. The conditions for its execution were consolidated, a series of inputs or steps, to later obtain some results. Finally, an evaluation criterion is given by a member of the development team to determine their level of satisfaction with the expected result.
Table 6 Example of a use case.
| Test Case | |
|---|---|
| Code: A002 | N° User story: US-5 |
| User story: Element generation | |
| Execution conditions: Obtain a label that the application will recognize nearby. | |
|
| |
| Expected result: A virtual interface with a reference label is displayed | |
| Test evaluation: The test was completed satisfactorily | |
IV. RESULTS AND DISCUSSION
The development of this work ends with the presentation of results. This development contributed to create new knowledge in the field of Augmented Reality and contributed an innovative solution to problems related to the academic schedule, thus facilitating its use and strengthening institutional capacity [5].
In phase 1, the research and development methodologies were defined, and the activities and delivery plan were set. Agile development methodologies, in this case XP [10], suited the needs of a small team better and greatly facilitated development.
In the second phase, both augmented reality and the application interface were designed considering the user stories described in the previous phase. CRC cards were also produced to assign tasks to the development team. Once the responsibilities have been established and the activities developed, a software product corresponding to a mobile application with augmented reality for schedule management was obtained, as can be seen in Fig. 9. Mobile app interface.

The process of obtaining the events stored in the Excel files was automated by a system of macros developed with Excel Visual Basic for the administrator role, the resulting graphic interface is presented in Fig. 10.
Tools were also added to facilitate data management by the administrator, e.g., the possibility of connecting the places with the closest ones. This task is part of the indication system of the augmented reality application (Fig. 11).

Additionally, we identified the need to visualize the use connections between places through a graph. To do this, it was necessary to create the D3.js library [11], that allowed to use the data stored in firebase, as can be seen in Fig 12.

In the final phase, the acceptance tests were carried out, and it was validated that all the requirements described in the user stories were met. It was also verified that the system works correctly. Stakeholders provided feedback and the system was deployed to production. The work was completed and successful.
V. CONCLUSIONS
The information presented in the article allowed us to conclude that it was necessary to learn how to use augmented reality tools, since some of them were unknown or knowledge was scarce. Even so, the proposed objectives were successfully achieved. Choosing an Agile development methodology enabled the efficient distribution of activities in accordance with the established guidelines in a short period of time.
During the development of the application, we identified the need to have the option to upload events massively to a database; therefore, Google tools such as Firebase were used [9]. They facilitated development and use. There were difficulties extracting the information from the schedule of each faculty because each one had a different format, this implied more development time to automate the data extraction process.
The usability tests were carried out with the administrative and student personnel. They showed that the required times were less than those established, which ratifies the success of the tests. This is probably because most people are familiar with mobile devices. This technology provides a new perspective in the way of obtaining information about university environments.

