


 English (pdf)
 Article in xml format
 Article references
 Send this article by e-mail
 Cited by SciELO
  Cited by Google
  Similars in
SciELO
Similars in
SciELO  Similars in Google
 Permalink
Introduction
It is estimated that cocoa bean world production is 4,651 thousand tons annually 1. The consumption of chocolate products in 2017 was 102 billion dollars, and it has been projected that in 2022, it will grow by 8% 2. Consumer preferences are based on its pleasant flavor and health benefits for being a source of antioxidants 3-6, anticancer potential 7, and cardiovascular protection 8.
The cocoa bean quality is essential to compete in the world market, and it is determined by several factors, such as the size and quantity of fruits, color, acidity and flavor, degree of bitterness, polyphenol content, nutritional composition, and fermentation quality 9. In particular, fermentation has been considered the most critical post-harvest process for developing positive sensory attributes in cocoa beans by forming flavor and aroma precursors generated by biochemical and enzymatic reactions 10. Cocoa fermentation is a spontaneous microbiological process; it is known that the microorganisms that initiate it are yeasts, thanks to the high content of carbohydrates, low pH, and the limited availability of oxygen in the pulp 11. The main activity of yeasts is the production of ethanol from carbohydrates, in addition to the assimilation of citric acid and the degradation of pectin 12,13. This activity leads to the production of CO2 favoring anaerobic conditions, allowing the development of lactic acid bacteria, which hydrolyze complex sugars, consume citric acid, and produce lactic acid, acetic acid, and mannitol 14. The fermentation protocols for the cocoa bean stimulate the growth of acetic acid bacteria (AAB), oxygenating the mass through periodic turning. AAB oxidizes the ethanol produced by the yeasts to acetic acid, which diffuses through the cocoa shell, causing a rupture of the polyphenols and the lipid membranes of the cell vacuoles, mixing the cellular content. Various enzymatic reactions occur, and polyphenols are oxidized; this reaction is partly responsible for eliminating the bitter taste of the beans 15. Since the transformation of ethanol into acetic acid is an exothermic reaction, heat is produced, favoring the development of bacteria of the Bacillus genus, which contribute to the taste and the production of pectinolytic enzymes. These species can also enter from the beginning of fermentation 16.
Regarding the influence that some factors exert on the quality of the cocoa bean, Carrillo et al. 17 indicated that there is a proportional relationship between the content of polyphenols and the geographical location (altitude) of the crops. These authors concluded that, at a lower altitude, a higher content of polyphenols, flavan-3-ols and epicatechin in cocoa beans was found. For their part, Tee et al. 18 found in their research that ripe cocoa fruits produce beans with a higher content of flavonoids, catechins, and total phenols, managing to produce a chocolate with the highest score in flavor intensity and complexity and the lowest in acidity and astringency. Finally, Agudelo et al. 19) and Oracz and Nebesny 20 confirmed the effect of different genotypes and geographical locations in various harvest years on the content of some metabolites (total polyphenol content, antioxidant capacity, and metal chelating activity) in cocoa beans.
The chemical composition of the cacao bean establishes the amounts and type of precursors formed during the fermentation and drying processes that lead to flavor formation, influencing, thus, the type and intensity of flavor 21. Likewise, it has been shown that climatic conditions (geographic location) and genotype influence the micronutrient content of the cocoa bean, specifically fats, carbohydrates, proteins, theobromine, niacin, minerals (calcium, iron, potassium, magnesium, sodium, and phosphorus) and vitamins 22. Accordingly, this research aimed to evaluate the incidence of three factors such as the maturity stage, genotype, and geographical location on some physicochemical parameters during fermentation that are considered relevant for cocoa quality. These factors were evaluated considering that the stage of maturity and the genotype of the fruit determine the chemical composition of the bean, specifically the content of storage proteins, polysaccharides, and polyphenols.
Methodology
Study place
The study was developed in two locations in the department of Huila, Colombia. The first place is located in the municipality of Algeciras, with an average altitude of 1,013 meters above sea level (m.a.s.l.), characterized by having a tropical monsoon climate (Am) of the Köppen-Geiger classification system, with an average annual temperature of 22.9 °C and an average rainfall of 1,284 mm. The second place is located in the municipality of Garzón, with an average altitude of 876 m.a.s.l., characterized by having a tropical climate with dry summer (As) in the Köppen-Geiger classification system, with an average annual temperature of 23.4 °C and rainfall average of 1,104 mm.
Plant material
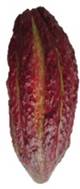
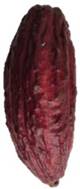
Cocoa fruits of the genotypes CCN51, ICS95, and TSH565 were selected for this study. These genotypes were in a productive development stage with 10 years of establishment. The fruits were picked following the collection framework permit granted to AGROSAVIA under Resolution No. 1466 of December 03, 2014, of ANLAS (Colombia), during the execution of the project "Technological strategies for harvesting and fermentation of cocoa beans to improve the Colombian cocoa sector" of the five-year-agenda of AGROSAVIA. Maturity stages were defined based on days after anthesis (DAA), respiratory activity (RA) in mL CO2 kg-1 h-1, and pod color (according to the Munsell color chart). Table 1 shows the parameters to establish the maturity stages of the genotypes studied.
Table 1 Characteristics of the maturity stages of cocoa fruits of the CCN51, ICS95, and TSH565 genotypes in Algeciras and Garzón (Huila, Colombia).
| Genotype | Algeciras | Garzón | ||||
|---|---|---|---|---|---|---|
| CCN51 | Stage 2 |
|
DAA: 118-135 RA: 51.49 Color: 2.5R4/6 | Stage 2 |

|
DAA: 130-152 RA: 47.77 Color: 2.5R4/8 |
| Stage 3 |

|
DAA: 136-152 RA: 40.12 Color: 5R3/10 | Stage 3 |

|
DAA: 153-174 RA: 68.60 Color: 2.5R4/10 | |
| Stage 4 |

|
DAA: 153-169 RA: 42.98 Color: 2.5R4/10 | Stage 4 |

|
DAA: 175-196 RA: 70.19 Color: 2.5R5/10 | |
| ICS95 | Stage 2 |
|
DAA: 100-123 RA: 69.11 Color: 5RP3/6 | Stage 2 |

|
DAA: 155-176 RA: 43.97 Color: 5RP3/4 |
| Stage 3 |

|
DAA: 124-146 RA: 63.78 Color: 2.5R4/8 | Stage 3 |

|
DAA: 177-197 RA: 51.02 Color: 5R4/6 | |
| Stage 4 |

|
DAA: 147-169 RA: 38.23 Color: 2.5YR3/6 | Stage 4 |

|
DAA: 198-218 RA: 47.38 Color: 5R4/10 | |
| TSH565 | Stage 2 |

|
DAA: 160-176 RA: 42.88 Color: 5RP3/8 | Stage 2 |

|
DAA: 110-130 RA: 38.77 Color: 5R3/6 |
| Stage 3 |
|
DAA: 177-193 RA: 35.31 Color: 2.5R4/10 | Stage 3 |

|
DAA: 131-150 RA: 49.87 Color: 5R4/10 | |
| Stage 4 |

|
DAA: 194-210 RA: 29.37 Color: 2.5R4/10 | Stage 4 |

|
DAA: 151-170 RA: 55.26 Color: 2.5R5/10 | |
Days After Anthesis (DAA); Respiratory Activity (RA) in mL CO2 kg-1 h-1; Color according to the Munsell color chart
Fermentation
Two hundred fruits were harvested from each maturity stage, genotype, and locality and were taken to the Nataima research center of Corporación Colombiana de Investigación Agropecuaria - AGROSAVIA. The fermentable dough was placed in wooden crates, and fermentation was carried out for seven days.
Experimental design
An asymmetric factorial design in completely randomized 3x3x2 blocks was established for a total of 18 combinations of treatments. Three levels were considered in the first two factors, and only two were included for the last factor. The number of replicates for each treatment combination was three. The factors studied were three maturity stages (2, 3, and 4), three cocoa clones (CCN51, ICS95, and TSH565), and two locations (Algeciras and Garzón); each fermentation day (0, 3, and 7) was considered a block. The response variables were the pH (bean and pulp), titratable acidity (bean and pulp), and fermentation index (bean).
On days 0, 3, and 7 of fermentation, a sample of 23 g was taken aseptically from the center of the mass for physicochemical analysis.
The bean was separated from the pulp to be processed independently (bean and pulp). Then, 2 g of each were weighed and macerated with 20 mL of distilled water and filtered. With the filtrate obtained, the following variables were measured: pH with a HANNA® instruments brand potentiometer (AOAC 970.21) and percentage of titratable acidity with NaOH (0.1 N) (AOAC 942.15).
The fermentation index was calculated following the method described by Amanquah (23 with some modifications. To 0.2 g of the fermented, dry and macerated cocoa beans, 20 mL of methanol: HCL (97: 3) were added, homogenized for 1 min, and left to rest in a refrigerated environment (8°C) for 19 hours. After centrifugation using a Heal Force® centrifuge (Shanghai, China) for 20 min at 4,500 rpm and filtering with a Whatman No. 2 filter paper, the supernatant was read in a spectrophotometer (Thermi scientific®) at absorbances of 460 and 530 nm.
Statistical analysis
The response variables were analyzed through an analysis of variance (ANOVA), and multiple comparisons (pairwise) were made using Tukey's test with a significance level of α = 0.05. Additionally, a longitudinal analysis was carried out as there are measurements over time, and autocorrelation of individuals over time can occur, allowing the results to be contrasted through another analysis. In the two statistical analysis methods used, the corresponding validation of model assumptions was carried out, including normality, homoscedasticity, and independence on the model residuals. The analyses of variance were performed with the statistical software SAS (Statistical Analysis System, 1985), and the longitudinal analysis was carried out with the R software version 3.6.1 (Core Team 2022).
Results and discussion
Analysis of variance
The analyzes of variance (ANOVA) for bean acidity, pulp acidity, bean pH, pulp pH, and fermentation index showed R-squared (R2) values of 0.755046, 0.701617, 0.770895, 0.843668 and 0.846367, respectively, indicating a high percentage of the explained variation of the response variables on the models, allowing high reliability when interpreting the experimental data.
In all cases, the assumptions of normality, homoscedasticity, and independence on the standardized residuals were satisfied. A square root transformation was performed to validate model assumptions in the pulp acidity variable.
Table 2 Statistical p-values of the factors in five response variables
| Response | Bean acidity | Pulp acidity | Bean pH | Pulp pH | Fermentation index |
|---|---|---|---|---|---|
| Source | p-value Prob>F | p-value Prob>F | p-value Prob>F | p-value Prob>F | p-value Prob>F |
| Location | <.0001 | 0.0003 | <.0001 | 0.0066 | 0.1270 |
| Genotype | 0.0003 | 0.4278 | <.0001 | <.0001 | <.0001 |
| Maturity stage | 0.1335 | <.0001 | 0.0681 | <.0001 | 0.0053 |
| Day | <.0001 | <.0001 | <.0001 | <.0001 | <.0001 |
| Location*Genotype | 0.6098 | 0.6243 | 0.0003 | <.0001 | 0.0143 |
| Location*Marurity stage | 0.5035 | 0.0195 | 0.0029 | 0.0005 | 0.4930 |
| Genotype*Maturity stage | 0.3857 | <.0001 | 0.2623 | <.0001 | 0.0113 |
| Treatments | 0.0091 | <.0001 | <.0001 | <.0001 | 0.2088 |
The ANOVA (Table 2) shows that the location and the day of fermentation have a significant effect (p < 0.001) on bean acidity and also on the maturity stage and day. Furthermore, the genotype*maturity stage and location*genotype*maturity stage interactions have a significant effect (p < 0.001) on pulp acidity.
Multiple Pairwise comparison
Tukey's multiple Pairwise comparison test results (Table 3) show statistically significant differences (p ≤ 0.05) in most of the variables except for pulp acidity in the genotype factor, bean acidity and bean pH in the maturity stage factor, and fermentation index in the treatments.
Table 3 Tukey's multiple (pairwise) comparison test for five response variables per factor and level
| Factor | Level | Bean acidity | Pulp acidity | Bean pH | Pulp pH | Fermentation index |
|---|---|---|---|---|---|---|
| Location | Algeciras | 3.43 ± 2.49 a | 7.07 ± 4.51 a | 5.71 ± 0.57 b | 4.13 ± 0.42 a | - |
| Garzón | 2.55 ± 1.71 b | 5.76 ± 2.80 b | 6.00 ± 0.50b | 4.13 ± 0.56 a | - | |
| Genotype | CCN51 | 2.47 ± 1.62 b | - | 6.02 ± 0.33 a | 3.98 ± 0.41 b | 0.61 ± 0.33 b |
| ICS95 | 3.14 ± 2.22 a | - | 5.82 ± 0.61 b | 4.17 ± 0.36 a | 0.88 ± 0.58 a | |
| TSH565 | 3.35 ± 2.54 a | - | 5.71 ± 0.62 b | 4.14 ± 0.64 a | 0.97 ± 0.79 a | |
| Maturity stage | 2 | - | 5.32 ± 2.02 b | - | 4.15 ± 0.46 a | 0.76 ± 0.60 b |
| 3 | - | 7.73 ± 5.06 a | - | 4.01 ± 0.62 b | 0.80 ± 0.55 b | |
| 4 | - | 6.18 ± 3.33 b | - | 4.13 ± 0.37 a | 0.91 ± 0.69 a | |
| Day | 0 | 1.15 ± 0.46c | 4.22 ± 1.46 c | 6.31 ± 0.20 a | 3.82 ± 0.22 c | 0.34 ± 0.09c |
| 3 | 2.49 ± 1.40 b | 5.59 ± 2.15 b | 5.92 ± 0.45 b | 3.94 ± 0.24b | 0.59 ± 0.21 b | |
| 7 | 5.33 ± 1.72 a | 9.42 ± 4.72 a | 5.33 ± 0.43 c | 4.52 ± 0.50 a | 1.53 ± 0.53 a |
n = 3 ± standard deviation. Means with a common letter are not significantly different (p > 0.05).
Longitudinal analysis
Table 4 Longitudinal analysis for five response variables
| Coefficient | Bean acidity | Pulp acidity | Bean pH | Pulp pH | Fermentation index | |
|---|---|---|---|---|---|---|
| (Intercept) | Value | 0.80 | 1.41 | 6.39 | 3.75 | 0.07 |
| SE | 0.27 | 0.10 | 0.07 | 0.06 | 0.05 | |
| t-value | 2.93 | 20.71 | 92.68 | 57.79 | 1.36 | |
| p-value | 0.0038 | 0.0000 | 0.0000 | 0.0000 | 0.17 | |
| Day 3 | Value | 1.34 | 0.53 | -0.38 | 0.12 | 0.25 |
| SE | 0.21 | 0.08 | 0.06 | 0.03 | 0.05 | |
| t-value | 6.19 | 3.60 | -6.07 | 3.58 | 4.84 | |
| p-value | 0.0000 | 0.0004 | 0.0000 | 0.0005 | 0.0000 | |
| Day 7 | Value | 4.18 | 0.98 | -0.98 | 0.70 | 1.19 |
| SE | 0.21 | 0.08 | 0.06 | 0.03 | 0.05 | |
| t-value | 19.32 | 12.11 | -15.43 | 20.80 | 23.10 | |
| p-value | 0.0000 | 0.0000 | 0.0000 | 0.0000 | 0.0000 | |
| Garzón | Value | -0.87 | -0.47 | 0.28 | -0.05 | - |
| SE | 0.20 | 0.09 | 0.05 | 0.05 | - | |
| t-value | -4.33 | -2.53 | 5.51 | -1.09 | - | |
| p-value | 0.0000 | 0.0124 | 0.0000 | 0.2772 | - | |
| ICS95 | Value | 0.66 | - | -0.20 | 0.18 | 0.27 |
| SE | 0.25 | - | 0.06 | 0.07 | 0.05 | |
| t-value | 2.66 | - | -3.19 | 2.55 | 5.33 | |
| p-value | 0.0087 | - | 0.0017 | 0.0119 | 0.0000 | |
| TSH565 | Value | 0.90 | - | -0.31 | 0.17 | 0.37 |
| SE | 0.25 | - | 0.06 | 0.07 | 0.05 | |
| t-value | 3.62 | - | -4.86 | 2.48 | 7.11 | |
| p-value | 0.0004 | - | 0.0000 | 0.0141 | 0.0000 | |
| Maturity stage 3 | Value | 0.48 | 0.63 | -0.12 | -0.12 | 0.04 |
| SE | 0.24 | 0.10 | 0.06 | 0.05 | 0.05 | |
| t-value | 2.02 | 4.03 | -1.93 | -2.38 | 0.71 | |
| p-value | 0.0453 | 0.0001 | 0.0549 | 0.0183 | 0.4814 | |
| Maturity stage 4 | Value | 0.31 | 0.30 | -0.03 | 0.06 | 0.15 |
| SE | 0.24 | 0.10 | 0.06 | 0.05 | 0.05 | |
| t-value | 1.32 | 0.94 | -0.55 | 1.21 | 2.95 | |
| p-value | 0.1894 | 0.3484 | 0.5844 | 0.2268 | 0.0037 | |
SE: standard error; values not shown (-) were not significant
A longitudinal analysis was performed for the bean acidity variable, and an autoregressive structure of order 1 AR(1) was adjusted for the data with a correlation of 0.095. A statistically significant difference (p ≤ 0.05) was evidenced in the day, location, and genotype factors. Bean acidity increased by 1.34 units on average from day 0 to day 3 of fermentation and 4.18 units on average from day 0 to day 7 of fermentation if all other variables remained constant. In Garzón, the acidity of the bean decreased by 0.87 units on average with respect to Algeciras if the other variables remained constant. Regarding the genotype, the acidity of the bean in ICS95 increased by 0.66 units on average compared to CCN51, and TSH565 increased 0.89 units on average compared to CCN51 if the other variables remained constant. At 5% significance, there are no significant differences between maturity stages with respect to bean acidity. According to Tukey's multiple pairwise comparison test and the longitudinal analysis presented in Tables 3 and 4, respectively, cocoa bean acidity is lower in the CCN51 genotype than in ICS95 and TSH565. In the evaluation carried out by Horta-Téllez et al. 24, these authors found that the total acidity of clone CCN51 was the lowest compared to the other genotypes evaluated (ICS01, ICS95, ICS39, and TSH565). This behavior was attributed to the difference in initial total soluble solids and the microbiota profile. Each cocoa genotype has a unique flavor character 25. These flavor differences can be attributed to the inherent genetic composition of the bean, botanical origin, and location 21.
Regarding the longitudinal analysis for pulp acidity, an autoregressive structure of order 1 AR(1) was adjusted for the data with a correlation of 0.22. With a significance level of 5%, significant differences are evident in the day and location factors. In the maturity stage factor, there was a significant difference in stage 3 compared to stage 2, while stage 4 did not present differences compared to stage 2. The acidity of the pulp on day 3 increased by 0.53 units on average compared to day 0 of the fermentation, and on day 7, it increased 0.98 units on average with respect to day 0 of fermentation if the other variables remained constant. In the town of Garzón, pulp acidity decreased by 0.47 units in relation to the municipality of Algeciras if the other variables remained constant. Regarding the maturity stages, pulp acidity in stage 3 increased by 0.63 units compared to stage 2. At 5% significance, there are no significant differences between genotypes. Regarding days of fermentation, it was observed that bean and pulp acidity increased from day 0 to day 7, consistent with the effects of fermentation, since volatile and non-volatile acids are developed in the pulp, which, through the degradation of sugar by microorganisms metabolism during fermentation and subsequent diffusion to the bean, they cause a gradual increase in bean acidity. Acid production is necessary to achieve the death of the embryo and induce essential biochemical reactions in the bean. However, excessive production of acid results in a low pH of the bean and will affect the formation of peptides and precursor-type amino acids, as well as affect the flavor quality of the fermented beans 26. Moreover, Assa A and Yunus (27 indicated that cocoa fruit maturation affects the pH and acidity of the pulp and, therefore, of the bean. During the maturation process, using the pulp is necessary, specifically in the breathing process, generating slight evaporation of the pulp. This decreases the formation of alcohol during fermentation because the substrate is reduced, and the fermentation conditions are not aerobic. This, in turn, results in the slight formation of acetic acid. Hence, the acid content of the dry cocoa seeds remains low. In the current study, the acidity of the pulp was higher in maturity stage 3, which, according to López et al. 28, is the optimal fermentation maturity stage.
For the longitudinal analysis of bean pH, a compound symmetry structure was adjusted to the correlation matrix with a correlation of -0.02. There is a statistically significant difference (p ≤ 0.05) in the factors: day, location, genotype, and maturity stage. Bean pH on day 3 decreased by 0.38 units on average with respect to day 0, and on day 7, it decreased by 0.98 units on average concerning day 0 if the other variables remained constant. In the town of Garzón, bean pH increased by 0.28 units with respect to Algeciras if the other variables remained constant. In the ICS95 genotype, bean pH decreased by 0.20 units with respect to CCN51, and in the TSH565 genotype, it decreased by 0.31 units in relation to CCN51 if the other variables remained constant. In maturity stage 3, it decreased by 0.12 units on average compared to stage 2, and in stage 4, it decreased by 0.03 units on average compared to stage 2 if the other variables remained constant.
In the longitudinal analysis for pulp pH, an autoregressive structure of order 1 was adjusted with a correlation of 0.42. A statistically significant difference (p ≤ 0.05) was observed in the day and genotype factors. In the maturity stage factor there was a significant difference in stage 3 with respect to stage 2, while stage 4 did not show significant differences in relation to stage 2. On day 3, pulp pH increased by 0.12 units on average with respect to day 0; on day 7, it increased by 0.70 units with respect to day 0 if the other variables remained constant. In genotype ICS95, the pH value of the pulp increased by 0.07 units concerning CCN51, and in genotype TSH565, it increased by 0.17 units on average in relation to CCN51 if the other variables remained constant. Maturity stage 3 decreased the pH value of the pulp by 0.12 units on average with respect to stage 2 if the other variables remained constant.
The ANOVA (Table 2) also shows that the bean pH changes depend on the location, genotype, day, and location*genotype, location*maturity stage, and location*genotype*maturity stage interactions. The changes associated with pulp pH depend on the locality, genotype, maturity stage, day, and the locality*genotype, locality*maturity stage, genotype*maturity stage, and locality*genotype*maturity stage interactions. Regarding the genotypes evaluated, it was evidenced that CCN51 showed the highest bean pH and the lowest pulp pH. Likewise, in maturity stage 3, the lowest pulp pH was registered. This behavior coincides with what was exposed in the bean and pulp acidity discussion. Regarding the days of fermentation, bean pH decreased, and pulp pH increased as the fermentation progressed. This coincides with what was found in other studies 29-32 that relate the decrease in bean pH to the diffusion of organic acids to the beans, mainly acetic acid, produced by acetic acid bacteria present in the mucilage or pulp. Bean pH during fermentation is decisive for the rate of the enzymatic activity responsible for the production of flavor and aroma precursors, as well as the development of the typical brown color of cocoa beans 33,34. According to previous studies, enzymes have an optimal pH of 4.5-5.5 35, generating higher flavor potentials, while fermented beans with a pH of 4.0-4.5 develop samples with low flavor potential. The values obtained at the end of fermentation were similar to those stated by other authors, who have reported pH values of 5.0 26,36,37. The gradual increase in pulp pH during fermentation can be attributed to the decrease in the concentration of citric acid since yeasts and bacteria break it down to metabolize the sugars present in the pulp 30,13.
Finally, for the longitudinal analysis of the fermentation index, a compound symmetry structure was adjusted for the autocorrelation matrix with a correlation of -0.02. A statistically significant difference (p ≤ 0.05) was observed in the day and genotype factors; in the maturity stage factor, there was a significant difference in stage 4 with respect to stage 2, while stage 3 did not show significant differences concerning stage 2. On day 3 of fermentation, the fermentation index increased by 0.25 units on average in relation to day 0, and on day 7, it increased by 1.195 units concerning day 0 if the other variables remained constant. The ICS95 genotype increased by 0.27 units on average in the fermentation index with respect to CCN51, and TSH565 increased by 0.37 units in relation to CCN51 if the other variables remained constant. In maturity stage 4, the fermentation index increased by 0.15 units on average concerning stage 2 if the other variables remained constant. Rojo-Poveda et al. 38 define the fermentation index as capable of measuring the degree of fermentation based on the brown color formed in the cocoa beans. Therefore, over-fermented beans have a fermentation index of 1.6, while under-fermented beans have a fermentation index ˂ 1.0, indicating the integrity of the fermentation. The ANOVA (Table 2) shows that the changes in the fermentation index depend on the genotype, maturity stage, day, and the locality*genotype and genotype*maturity stage interactions. In the CCN51 genotype, a higher fermentation index was evidenced than in the other two genotypes evaluated. Maturity stage 4 registered a higher fermentation index, a product of over fermentation, an undesirable situation since it leads to the growth of molds and bacteria that can generate unpleasant flavors 39. The fermentation index increased progressively as the days of fermentation passed, a product of the rapid degradation of polyphenols during the initial stages of fermentation, leading to the leaching of colored compounds and, during later stages, the development of insoluble complex compounds that lead to the formation of the brown color typical of well-fermented cocoa beans 40.
Conclusion
The evaluation was carried out incidence of three factors such as the maturity stage, genotype, and geographical location on some physicochemical parameters during fermentation that are considered relevant for cocoa quality. The factor with the strongest influence on the physicochemical characteristics evaluated is the genotype, which affects bean and pulp pH and the fermentation index. We conclude that genotype CCN51 is an outstanding cocoa material with the lowest bean acidity and the highest bean pH and fermentation index. This conclusion demonstrates the potential of the CCN51 genotype to obtain high-quality cocoa beans. Likewise, with the results obtained in the current research, it is possible to establish a solution to the heterogeneity of bean quality, the main problem of international marketing, carrying out homogeneous fermentations of the same genetic material.

