INTRODUCTION
Carotenoid pigments are a group of compounds widely distributed in the nature and are responsible for the yellow, orange and red color of fruits and vegetables. The β-carotene is an important member of the carotenoid family, which is present in many fruits and vegetables such as carrots, squash, papaya, carambola, peach, spinach, broccoli, cabbage, among others [1,2]. Currently, the greatest interest in the carotenes is not only due to their pro-vitamin A activity, but also because of its diet antioxidant action, since it is able to trap and eliminate free radicals, reducing oxidative stress in the body [3]. In this way, when carotenes are incorporated into food to generate some color or to impart a functional characteristic, these remain exposed to isomerization and oxidation processes that can alter them. A possible solution to prevent this problem could be the microencapsulation, a technique commonly used to increase the carotenoids stability [4].
Microencapsulation is a technique where sensitive ingredients are packed inside a lining material, which protects the sensitive ingredient from adverse reactions, prevents the volatile ingredients lost and allows to control the encapsulated ingredient release [5]. Microencapsulation has important applications in the food industry as a protective of flavors and vitamin and other sensitive food ingredients. Various techniques for functional ingredient microencapsulation have been developed, which have been classified according to the nature of the method employed. There are physical procedures that require the mechanical mixing of the active component with the encapsulating component followed by evaporation of the dispersing medium [6]; chemical processes that are based on chemical and molecular structure and, affinity between the active component and the encapsulating agent. The following are some processes used for encapsulation: coacervation, molecular inclusion, spray drying and freeze drying, among others.
Spray drying and freeze drying are the methods commonly used to encapsulate food ingredients [6]. Through these methods, powder is obtained from of a liquid mixture, producing particles that protect the active material in matrices generally formed by polymers. These techniques are basically performed in three steps: emulsion preparation, homogenization and solvent removal. The first step is to disperse the active material in an agent encapsulant solution with which it is immiscible, the encapsulant material must have good emulsification properties, low viscosity, high solids content, in order to reducing the drying time, forming a film with a high content of solids around the drops of active material and increase its retention [7]. The second step is the homogenization of the emulsion, which consists of creating small ingredient drops in the encapsulating solution, forming a fine emulsion; sometimes the addition of emulsifying agents is necessary to achieve a good homogenization. Finally, the solvent elimination, which can be given at high temperatures (spray drying for example) or low temperatures (lyophilization). At this stage, the mixture of active agent and encapsulant, already homogenized, enter the drying chamber where simultaneously the solid matrix is formed and the solvent is removed [6,7]. Different cover materials are used in the food industry [8] such as gums, cellulose, proteins, and starches.
Although, gum arabic can be an excellent covering material, due mainly its emulsifying power and volatile retention capacity, it is less industrial used because its high cost and limited sources, promoting the interest to found other alternative materials [9]. The search for partial or total substitutes for gum arabic increased recently, revaluing the use of starch as a coverage material, thanks to its abundance and low cost. However, native starch presents certain functional limitations that affect its efficiency and have restricted its use as an encapsulating agent. To overcome these functionality problems have been proposed modification techniques to adapt the starch properties to the desirable conditions [10]. Advantage of these materials is their low cost, neutral flavor and good oxidation protection. However, as lacking emulsifying characteristics, several researchers have used this type of materials in combination with emulsifying agents such as gelatin, proteins of the serum and tween 80 [11]. The aim of this work was to evaluate the behavior of β-carotene encapsulated in starchy matrices at different storage humilities.
METHOD
This study was carried out in the laboratories of the department of industries from university of Buenos Aires (Buenos Aires - Argentina) and in the laboratories of the faculty of agricultural sciences of the university of Cauca (Popayán -Colombia). The experimental tests were carried out under conditions at 25°C, 1 atm and 0 msnm (Buenos Aires - Argentina) and 25°C, 824 hPa and 1760 msnm (Popayán)
Abrasive milling
The SEF fraction was obtained by abrasive milling using a laboratory rice mill Suzuki MT-95 (Suzuki, San Pablo, Brazil), which separates automatically pearled amaranth (SEF-starchy fraction yield, 70%) and bran (LPEF-lipid-protein fraction yield, 28%). The milling conditions were determined in preliminary trials (data not shown), where a milling time of 90 minutes was established for a 100 g load.
Wet milling
The amaranth grains (Amaranthus cruentus) previously obtained by abrasive milling was milled in a ball mill model PM-100 (Retsch, Haan Mettman, Germany) with one stainless steel milling cylinder (500 mL). The maceration solution of 0,3 g/L of NaOH (NaOH from Sigma Chemical Co., St. Louis, MO, USA) and 0,2 g/L of sodium dodecyl sulfate (from J. T. Baker Co., New Jersey, USA) was employed with a solution:grain ratio of 1,2:1 (mL:g). Wet-milling conditions were described by [12], after wet milling starch slurry was separated, then slurry was centrifuged and native starch (NS) was obtained, which was quickly frozen using liquid nitrogen (-196°C) and freeze-dried during 48 h at 56ºC and 0,04 mbar in at ALPHA 1-4 LD2 freeze dryer (Martin Christ Gefriertrocknungsanlagen GMBH, Germany). The SEF and NS samples previously obtained by abrasive and wet milling were pulverized in a planetary ball mill model PM-100 (Retsch) obtaining SEF-BM and NS-BM, respectively [12].
Matrices preparation
The (SEF-BM and NS-BM) samples were suspended in distilled water (5% w⁄w) and heated in a thermostatic bath (Vicking SRL, Buenos Aires, Argentina) at 95°C to gelatinize the starch. Trans-β-carotene in oil was added to the cooled gelatinized starch paste in a ratio of 1:50 g:g on dry basis. The ratio between the core and wall material was chosen based on literature reports [6,11, 13]. The mixture was stirred until complete homogenization employing an Ultra-Turrax T18B (IKA®-WerkeGMBH & CO.KG, Staufen, Germany) at 15.500 rpm for 10 min. Then, the samples were quickly frozen using liquid nitrogen (-196°C) and freeze-dried at same conditions described previously. 0,05% w/w Gelatin (Ge, from Merck KGaA, Darmstadt, Germany) was added to NS systems for generate emulsion.
Determination of the β-carotene content
The procedure for determining surface and encapsulated β-carotene content is based on the concept that β-carotene is lipophilic and soluble in hexane unless the rest of the matrix components. Surface β-carotene was extracted from the freeze-dried samples by washing them with 3 mL of hexane in a glass vial (5 mL) and shook in a Vortex-Genie 2 (Scientific Industry, Inc., Bohemia, New York, USA), at 1850 rpm for 8 min. The supernatant was measured at 452 nm using a spectrophotometer model V-630 UV-VIS (JASCO Inc., Maryland, USA). This wavelength was found to correspond to maximum absorbance of the spectrum from 200 to 600 nm and is agreement with previous results reported by [14]. The remaining matrix (without surface β-carotene) was dissolved by adding 1,5 mL of water and shook in a Vortex-Genie 2 at 1850 rpm for 2 min, in order to release encapsulated β-carotene. Then, the encapsulated β-carotene was extracted with 3 mL of hexane and shook in a Vortex-Genie 2 at 1850 rpm for 6 min; the hexane fraction was measured at 452 nm. The concentration of β-carotene was calculated according to equation (1) and expressed as (mg/gmatrix). An average value of three replicates was reported along with the standard deviation.
Where: A is the absorbance at 452 nm, MW is the molecular weight of β-carotene (536,8 g/mol), DF is the dilution factor, VH is the volume of hexane (0,003 L), ε is the molar extinction coefficient of β-carotene in hexane (145.300 L/mol cm, Rodríguez-Amaya, 2001), l is the path length (1 cm) and SM is the weight of starchy matrix in dry basis (0,04902 g).
Effect of storage humidity on encapsulated β−carotene
With the purpose to obtain systems with different content of water, the samples were exposed during 21 days at 25oC into vacuum desiccator with controlled relative humidity (RH). The salt solutions used were (analytical quality, Merck): LiCl (RH 11%), MgCl2 (RH 33%), MgNO3 (RH 52%), NaCl (RH 75%), KCl (RH 84%) KNO3 (RH 97%). In relation with the storage samples to 84% RH and 97% RH were exposed for 5 days; to prevent microbial growth. The samples were stored at 25°C in forced air oven SR71 model (FAC SRL, Buenos Aires, Argentina). All samples remained in darkness to avoid any other contribution to β-carotene degradation. The β-carotene concentration (C) was determined in triplicate at selected times. The initial β-carotene content (C0) was measured immediately after freeze-drying, and the results are expressed as the percent of remaining β-carotene (C/C0, %).
Determination of water sorption isotherms
The water content was determined gravimetrically by drying at 105oC up to constant weight (AACC 44-16) in forced air oven SR71 model. The results were expressed in dry basis (% d.b). An Aqualab Serie 3 (Decagon Devices, Pullman, Washington, USA) was employed to determine the water activity. The measures were done at 25°C by triplicate. The water adsorption curve was fitted using the GAB equation.
Differential scanning calorimetric (DSC)
Glass transition temperatures (Tg) of freeze-dried samples SEF-BM and NS-BM humidified at different relative humidity (11 to 97%) were determined employed a Mettler-Toledo DSC model calorimeter 822 (Schwerzenbach, Switzerland), calibrated with indium (156,6°C) lead (327,5°C) and zinc (419,6°C). Sample mass between 10 mg and 15 mg, were employed and the scan rate was 10°C/min. Tg values obtained were modeled using the Gordon and Taylor equation [15].
Where Tg1 and Tg2 are the starting temperatures of the glass transitions of solids amorphous and pure water respectively, W is the mass fraction of each component (subscript 1 for solids and 2 for water) and k is a constant that characterizes the effect of a second component (in this case water) on the Tg.
Statistical analysis
Relative humidity effect on encapsulation properties was evaluated by ANOVA. To compare with control sample, it was used the Dunnet test. To determine the differences between treatments, it was used the Tukey test, using the Prism 6 software (GraphPad Software, Inc., San Diego, CA, USA). In some cases, the value-p was calculated using a t-test to analyze the differences between the samples in a more exhaustive way.
RESULTS
The SEF-BM and NS-BM samples were stored at different conditions of relative humidity controlled between 11 and 97%. According to the relative stability diagram shown in [16] the lipid oxidation rate shows an U-type curve, which presents a maximum values in both low and high water activities, and a minimum between 0,3 and 0,5. It is important to point out that the most of the works that evaluate the β-carotene stability of based on water content do so by studying the stability of β-carotene as a function of time once the matrix used reached equilibrium moisture [17]. In present research, the water content influence on the quantity and structure of β-carotene after humidification between 11 and 97% RH was studied, so the results obtained will not obey the typical curve in U, since this corresponds to relative speeds and not to a carotene content.
The figure 1 shown the β-carotene remained content. Both the surface and encapsulated β-carotene were affected in the same way and in a manner dependent on storage humidity, although the encapsulated β-carotene content was always higher than the surface β-carotene, showing the protective capacity of the matrix. For both matrices, an area of greater degradation was observed between 9 and 16% d.b (with a minimum of 12% d.b), while the samples stored with higher humidities conserved a greater amount of β-carotene.
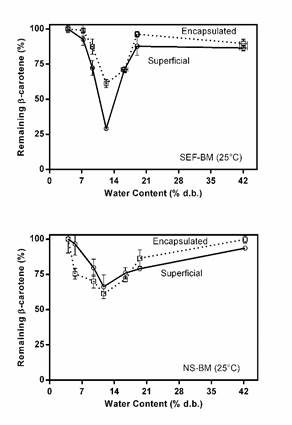
Figure 1 Behavior of the surface and encapsulated re-carotene remaining in the SEF and SN fractions at different relative humidity at 25°C dry base.
The fact that there are no differences between the two matrices analyzed may be due to the fact that the encapsulation and protection mechanisms are the same for both systems. The only difference between them is in the type of proteins they have (those of amaranth grain or gelatin), and obviously this does not affect the stability of β-carotene at different storage humidities. It is important to consider that the samples exposed to 19 and 42% d.b cross the area of maximum deterioration faster, which would explain the higher retention values of β-carotene.
Figure 2 shows the fine structure index (III/ II, %) for the humidified SEF-BM sample. The change in this index is small and similar for both the encapsulated β-carotene and surface β-carotene in the SEF sample.
This makes it clear that deterioration mechanisms observed cause minimal changes in β-carotene (isomerization, in this case), whether it is encapsulated.
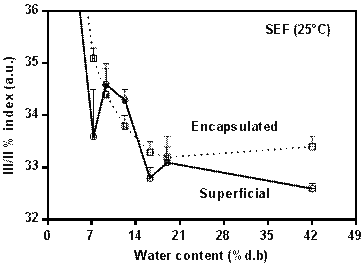
Figure 2 Behavior of the stability index III/II (%) of the surface and encapsulated ®-carotene remaining in the SEF fraction at different relative humidity at 25°C dry base.
That is, structurally, differences in water content would not be affecting the structure of β-carotene from changes produced by isomerizations. On the other hand, it is important to note that there was a slight reduction in the index values in the humidified samples with respect to the control sample (index III / II% of 37,5 ± 0,5). This reduction implies that there was an isomerization of β-carotene that could have been caused during the humidification time at 25°C.
Golman et al. (1983) demonstrated that the degradation of β-carotene in model matrices of microcrystalline cellulose vacuum dehydrated and subsequently humidified in a range of water contents between 0 and 21% at 35°C is due to the action of the remaining oxygen in the head space after sealing the vials. However, the deterioration evaluated by these authors corresponds to the degradation as a function of time once the vial was sealed after humidification. In that case, the degradation curve obtained is sigmoid, corresponding to a typical autocatalytic chain reaction, where there is a first induction period, a rapid period (propagation) and finally a delay or termination period [17]. The experiments shown in the figures 1 and 2, that the observed deterioration could be due to the oxidation generated by the oxygen in the air to which the samples were exposed when they were taken from the lyophilizer. While that exposure was for a very short time, it could have been enough to start the oxidation reaction.
If the degradation kinetics of β-carotene will be studied as a function of humidification time (experiment that would have to be done using as many desiccators as times would be measured, so as not to expose the samples to the air for the time of the test) and if this kinetics followed a degradation curve of the sigmoid form, the degradation mechanism could be corroborated. The figure 3 shows the deterioration caused by oxygen, which is more pronounced for surface β-carotene compared to encapsulated β-carotene. In this case, the oxygen present in the head space was sufficient to cause a large oxidation of the surface carotene. Golman et al. (1983) had observed how the concentration of oxygen (between 1 and 20%) causes an increase in the constant kinetics of degradation of β-carotene.
In order to understand the influence of the structural and physicochemical properties in the matrices on the stability of β-carotene, different properties of sorption, mobility and transition temperatures were analyzed. Water activity and moisture content are parameters considered relevant in food stability, since, being exposed to the relative humidity of the environment can gain or lose moisture to the given equilibrium level. This movement of water, in low humidity products, to reach equilibrium with the surrounding environment is identified with the term sorption and if the process is at a constant temperature it is possible to establish the moisture sorption isotherms. Thus, the isotherms can be moisture adsorption or desorption and graphically correspond to the content of water as a function of water activity (aw), at a certain temperature.
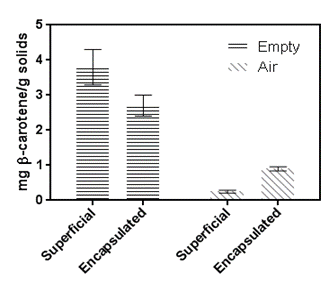
Figure 3 Amount of surface and encapsulated β-carotene after 21 days at 25°C in samples in an atmosphere of 11% relative humidity.
Figure 4 shows the water sorption isotherms for both SEF-BM and NS-BM samples. Both systems have a similar isotherm to each other with the typical sigmoid form (type II isotherm), characteristic of starch-derived polymers. Figure 4 shows the isotherms adjusted through the GAB model applied. The values obtained from these adjustments are shown in Table 1.
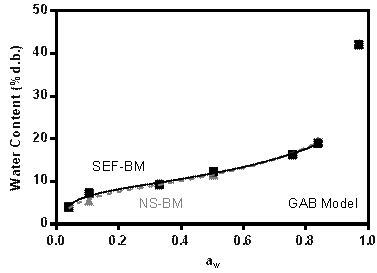
Figure 4 Water sorption isotherm for samples of ground starch fraction (SEF-BM) and native starch with ground gelatin (NS-BM) modeled by GAB.
Table 1 Parameters obtained by adjusting the water adsorption isotherms by the GAB model.

Standard error is included.
The GAB model takes multilayers conceptually into consideration and is the most widely used method due to its validity range. The GAB equation allows to obtain the monolayer sorption value (qm), which represents the amount of water that covers the exposed surface of the solid completely with a layer of a thick molecule [18].
The Guggenheim constant C is related to the heat of sorption of the water to the first layer of solid active sites, while the constant k is a factor that corrects the properties of the multilayer water molecules with respect to free water. Sorption values C and k found do not show significant differences between samples and were like those found in other starchy products [19]. Knowing the volume of a water molecule, it is possible to calculate the area of sorption (Sw), which is shown in Table 1. The values obtained showed no significant differences from each other and are in the range of starchy products. Due to the system generation process (lyophilization), the solute molecules were immobilized by rapid freezing and / or rapid dehydration, thereby obtaining an amorphous solid. One of the key parameters of study in dehydrated systems corresponds to the determination of the glass transition temperature (Tg).
The determination of the Tg curve for a sample allows to have a notion of the stability regions for a given system, knowing the zones corresponding to the amorphous state and that of an overcooled liquid or gummy region. The Tg corresponds to the temperature at which the glasses begin to soften and flow [20]. Amorphous solids exist in a non-equilibrium state and exhibit time-dependent changes as they approach equilibrium. The appearance of a vitreous material is that of a brittle rigid solid characterized by a very high viscosity (around 1012 to 1014 Pa.s) [20]. Molecular mobility in glasses is restricted to vibrations and rotational movements of short range [20]. The changes that occur in the vitreous state, during the so-called "physical aging", are extremely slow and therefore, the systems can be considered stable to physical and chemical changes [21]. At temperatures above Tg, the system passes from the vitreous state to the overcooled liquids, the viscosity decreases from approximately 1012 to 103 Pa.s, increases molecular mobility and translational movements, and in systems porous structural shrinkage occurs as a result of the decrease in viscosity and increased fluidity of the walls that support its structure. Due to their potential effect of increasing the diffusion coefficient of the reagents when the glass transition occurs, numerous authors analyzed the effect of the reagent on the kinetics of the chemical reactions controlled by the diffusion of the reagents. Therefore, in order to obtain greater protection from an encapsulated labile agent, it is desirable that the sample is vitreous, since the rate of deterioration reactions will be low and much lower with respect to the gummy state.
Figure 5 shows the rescans of the thermograms obtained by differential scanning calorimetry of the NS-BM samples. These thermograms show a transition that moves at lower temperatures as the water content increases. This transition corresponds to the Tg of the samples, which decreases due to the plasticizing effect of the water, causing an increase in mobility in them. Figure 6 shows the Tg curves obtained for the two systems analyzed as a function of the fraction of water.
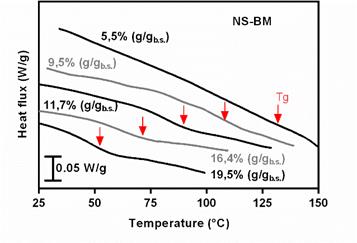
Figure 5 Thermograms obtained by differential scanning calorimetry of humidified freeze-dried samples between 11 and 84% relative humidity. The samplescorrespond to the systems obtained with native starch treated with ball mill (NS-BM). The thermograms shown correspond to the rescan. Water contents expressed in dry basis (b.s.) are reported.
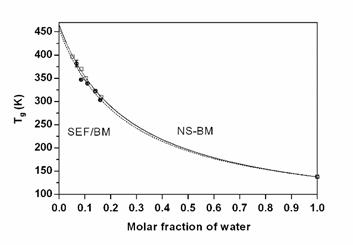
Figure 6. Glass transition temperature curve (Tg) for samples of ground starch fraction (SEF-BM) and native starch with ground gelatin (NS-BM) modeled by Gordon and Taylor. Standard deviationis included.
As expected, the curves were very similar for the two systems, with high Tg values for the entire range of water contents studied. The data obtained were adjusted with the Gordon and Taylor equation. The Tg values found for ground amaranth starch were 192±6°C, the value of which is consistent (although slightly lower) with the Tg values reported for starches from other sources 243 to 278°C for corn, 166±9°C for corn grits [22].
The lower values of Tg found could be due to the reduction in the length of the glucosidic chains, the product of grinding, although this was not confirmed experimentally. The constant k allows to characterize the effect of water on Tg. If the value of the ratio Tg1/Tg2 is high as in this case (the Tg of the second component is much lower than that of the first), k is also, and the second component will have a greater effect on the Tg of the first [23]. The values found coincide with the values reported in the literature for starches, which are in the range 3,8 to 6,2 [22].
It is important to note that in the range of 11 to 84% the samples were stored (at 25°C) above their Tg. Therefore, the changes observed in figures 1 and 2 are not a function of a drastic change in the mobility of the system produced by a change of state (from vitreous to gummy) [24]. All changes observed in these figures occurred in the vitreous state, as well as the changes observed during thermal storage [12, 25].
CONCLUSIONS
For both matrices, an area of greater degradation between 33 and 75% RH (with a minimum of 52%) was observed, while samples stored at higher relative humidity retained a greater amount of β-carotene. The fact of not finding differences between the two matrices analyzed may be due to the fact that both the encapsulation mechanism and the protection mechanism are the same for both systems. The only difference between them lies in the type of proteins they have (those of amaranth grain or gelatin), and evidently this did not affect the stability of β-carotene exposed to different relative humidity during storage.
The water sorption isotherms for the SEF-BM and NS-BM samples showed the typical sigmoid form (type II isotherm), characteristic of starch-derived polymers, adjusting satisfactorily using the GAB model. The glass transition temperature (Tg) of the samples decreased with the increase in relative humidity due to the plasticizing effect of the water. It is important to note that in the range of 11 to 84% the samples were stored (at 25°C) above their Tg value. Therefore, the changes observed in the stored samples cannot be attributed to a drastic change in the mobility of the system produced by a state transition (from vitreous to gummy). Is is concluded that the SEF matrix has a high potential as an encapsulating agent of hydrophobic compounds from the technological point of view due to the excellent physicochemical properties of the amylaceous matrix (high Tg, adequate surface of sorption), also exploiting the own amaranth proteins, thereby avoiding the extra addition of an emulsifier.


