


 English (pdf)
 Article in xml format
 Article references
 Send this article by e-mail
 Cited by SciELO
  Cited by Google
  Similars in
SciELO
Similars in
SciELO  Similars in Google
 Permalink
1. Introduction
Currently in Colombia it is estimated that there are about 14,357 Units of Mining Production (UPM), of which 63% has no mining titles [1] and therefore are considered of an illegal character [2]. In the entire country at least 10 departments reported that over 80% of their UPM do not have any kind of mining title [1] which progressively makes more difficult their control, monitoring and their regulation regarding environment, as well as for labor, tax and legal aspects, causing disturbances in a national, regional and local context in social, economic, environmental, criminal, tax and public order issues, contrary to what aims the policy and legislative framework of Colombia. Because of this situation, it is necessary that the environmental and control authorities come to possess the technical and technological mechanisms of an official status that enables them to identify, monitor and report figures of areas of mining activity in the country, thus making it possible to efficiently and effectively fulfill their functions of control, monitoring and regulation.
In this sense, remote sensing products can be considered as a key tool in the detection and monitoring of different phenomena and dynamics on land cover, due to their characteristics and benefits in the provision of multispectral information. For this purpose there are different methodologies and specific applications that identify several features, such as different aspects related to the mining sector, where is included the use of remote sensing and geographic information systems on a wide array of issues like the identification of diverse minerals [3] the mapping of potential minerals like gold [4], the evaluation of mining impacts on land cover [5], illegal mining monitoring [6], studying the influence of mining on water quality [7,8], eco-toxicology of water in mining operations [9], environmental monitoring in areas of mining [10] and evaluating the subsidence caused by mining activities from image fusion techniques [11,12], among others.
However, few studies have shed light on processes specifically addressing the detection of open-pit mining zones, yet there are some investigations that contemplate approaches on this issue, some of them are associated with the identification of minerals presence for exploration stages [13], but not to operating areas or open-pit mining activity; in the aforementioned research they applied remote sensing in detecting alluvial gold in the Colombian Pacific Coast, based in the use of Landsat-TM and Spot-XS images as a fundamental instrument of exploration, and supported with geomorphological and field observations as ancillary information, they made use of individual bands analysis, spectral indices, and relationships between bands and filtering techniques, all this helped them identify extensions of palaeochannel, palaeovalley and flow deposits of mud genetically related to alluvial gold, i.e. new explorations banks.
Likewise, hyperspectral imaging has been used in detecting minerals [14] from the analysis of large amounts of spectral data, and as a result, the LinMin supervised classification algorithm was proposed to estimate the uncertainty of observed spectral information. Another interesting study has been developed for locating and identifying sites of gold mining in French Guiana [15], from the generation of spectral indices such as NDVI and NDWI, used as bands in a new image and with filters of contrast. Thus, it was possible the identification and classification of new ore mining areas.
Taking into account the need to availably have a methodology for the detection of open-pit mining areas, this study developed a procedure based on the application of spectral indices and image fusion techniques for the detection of open-pit mining process implemented in the north-eastern department of Antioquia, evaluating the accuracy of this methodology through statistical methods.
2. Study area
The study area is located in the northeastern sector of the department of Antioquia, Colombia, comprising sections of the municipalities of Nechí, Caucasia, Zaragoza and El Bagre, (7º 51’ 1’’ N, 74º 53’ 34’’ W y 74º 37’ 15’’ N, 7º 23’ 58’’ W) (Fig. 1), with an area of 150.000 ha. This has been traditionally an open-pit region which has had a recent increase in mineral production [16].
3. Materials and methods
As the main input for the application of spectral indices and image fusion techniques, data from the Landast 8 LDCM sensor dated June 17 of 2014 was used. Along with this data, high-resolution images as UltraCam-D and RapidEye were also used, which have been previously used to identify and characterize the pictorial-morphological properties1 [17] of open-pit mining zones in the area under study [18]. The usage of the aforementioned data allowed the visual definition, differentiation and delimitation of mining areas from non-mining areas.

For the methodology of this study, nine spectral indices and two image fusion techniques were proposed and implemented for the detection of open-pit mining zones (Table 1), defined from reviewing previous specialized literature, where some of these indices and fusion techniques were designed and/or commonly implemented for the detection and the analysis of eroded zones [22], detection of minerals, soil types and/or rocks [23,24].
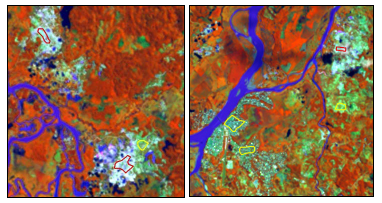
For each spectral index and image fusion technique, data of Mining and Non-Mining (which are the defined thematic classes of the study) was obtained by selecting trough the samples taken directly from the Landsat 8 LDCM image (some of which are shown in Fig. 2) image. For the samples of the thematic class “Mining”, these were made from the identification and characterization of its pictorial-morphological properties obtained through visual interpretation [18], both from the high resolution images (Ultra CAMD) as from the medium resolution ones (LDCM Landsat 8). As for the thematic class “No Mining”, the procedure consisted in the application of the Normalized Difference Vegetation Index (NDVI) in order to exclude coverage of photosynthetically active vegetation, where the inexistence of open-pit mining is manifest. From this result the samples were selected for the thematic class of No Mining, which mainly includes coverage of eroded areas, rocky areas, population centers and clean pastures (Fig. 2).
Table 1 Spectral indices and image fusion techniques

NIR = near infrared spectrum, RED= red spectrum, SWIR = short wave infrared spectrum, BLUE= blue spectrum, GREEN= green spectrum, PAN = pancromatic.
Source: The Authors.
Source: The Authors.
Figure 2 Samples of the thematic classes of Mining (red polygons) and Non-Mining (yellow polygons). Image Landsat 8 LDCM 955 20140617, RGB (5, 6, 4), USGS.
From these samples, 515 observations were obtained for Mining and 461 for Non-Mining to the application of spectral indices, whereas for the image fusion technique, 1.985 were for Mining and 1.883 for No Mining, both these set of samples correspond to the same sampled area (polygons), the more data for image fusion techniques is due to the fact that higher spatial resolution images are used.
In order to obtain the spectral index or image fusion technique with the highest potential for discriminating mining from non-mining areas, the Fisher’s discriminant ratio (or Fisher’s index) was used. This index allows obtaining a series of linear functions (discriminant functions) through the independent variables that assists in the interpretation of differences between various groups. This technique is widely used in spatial analysis to quantify the degree of separability of individual characteristics [32] based on statistical parameters of the mean (𝝁) and the variance (𝝈) [33]. In the case of multiple classes Fisher’s index is expressed by Eq. 1:
 (1)
(1)
Where 𝜇𝑖 and 𝜎𝑖 refer to the corresponding mean and variance values of the Mining areas samples characteristics, 𝜇𝑖 and 𝜎𝑖, are the mean and variance values of the Non-Mining areas. The characteristics with the highest Fisher’s ratio are more discriminating than those with lower index [33].
The Fisher’s separability criterion applies to samples that respond to various conditions. First, samples should have statistically different mean values; this condition is verified through the Student criterion [34]. Second, the two classes must follow a normal probability distribution; this condition is verified through the construction of empirical and normal probability curves for each class, and the subsequent demonstration of the goodness of fit between the two curves using the criteria of Kolmogorov-Smirnov test and 𝝌𝟐 [35]. All the analyses were performed to the level of two-tailed significance test 2α = 5% for each class.
By fulfilling all the conditions listed above, the index with the best separation potential of mining from non-mining areas can now be selected, according to the highest value of Fisher’s index.
In order to be able to tell a mining from a non-mining region apart using the pixel value, the discriminant breakpoint was used. This is estimated as the average of the two-groups pixel value average, as expressed in Eq. 2:
 (2)
(2)
where:
PCD |
Discriminant breakpoint |
𝜇𝑖 |
The average value of the pixel from the mining area sample |
𝜇 j |
The average value of the pixel from the non-mining area sample |
To evaluate the classification rule the apparent error rate equation is used, which is expressed as follows:
 (3)
(3)
where
RAE |
Apparent error rate |
Wrongly classified data |
Number of the sample data that are outside the range stipulated by the discriminant breakpoint |
Sample size |
Total number of data (pixels) |
The apparent error rate was calculated for both samples of mining and non-mining areas. Afterwards, the weighted average value that characterized the weighted rate of the apparent error was obtained.
4. Results and discussion
Initially, the level of separation of mining and non-mining classes for every spectral indices and image fusion techniques applied was visually evaluated from the comparative analysis of histograms.
This analysis is based on the degree of separability between the histograms of the samples in each of the spectral indices and images fusion techniques discussed, where the greater the distance or separation between histograms, the greater it’s potential to discriminate mining from non-mining areas; likewise, the lower the shared area between histograms, the greater the discriminant potential of the spectral index and image fusion technique. The shared area between histograms determines the inaccuracy of the discriminant power of the index or of the technique employed.
Figs. 3 and 4 shows the comparison of histograms for the nine spectral indices and for the two image fusion techniques employed. These figures illustrate that both the iron oxide spectral index (Fig. 3c), as the band 2 of the Brovey transform technique (Fig. 4b), have better degrees of separability and less shared area between histograms (the greater distance between the histograms peaks, the better the discriminant power). This shows a better potential to classify mining from non-mining areas compared to other indices and fusion techniques. Likewise, the indices and fusion techniques analyses allowed an evaluation of areas with less potential for mining areas, including the spectral indices of clay minerals (Fig. 3a) and ferrous minerals (Fig. 3b).
Subsequently, Fisher’s index was used to statistically evaluate the discriminant power of the nine spectral indices, and the six bands resulting of the two image fusion techniques. The implementation of this index is subject, as previously mentioned, to compliance with the conditions that the two samples present a normal distribution and that their average values are statistically different.
Fisher’s index is calculated once these conditions are met, and after analyzing the results it was found that the best image fusion technique was the Brovey transform in his band 2, since this technique had the highest Fisher’s index value. Therefore, this is established as the technique with the highest discriminant power to classify mining from non-mining areas. Fisher’s index results for each of the techniques are presented in Table 2.
As it has been mentioned, the concept of discriminant breakpoint was used for the definition of the pixel’s value that separates the mining from non-mining class, which represents the average value between the two classes. Since the data of these two classes follow a normal distribution, the modal value corresponds to the value of the arithmetic mean (Eq. 2). The resulting value of the discriminant point is 0.3225; therefore, every pixel with a value under 0.3225 was associated with the class of non-mining and values between 0.3225 and, the maximum value of for the mining class of 0.5237 (Table 2), correspond to the classification of mining.
To evaluate the validity of this classification scheme, the apparent error rate for the two classes was calculated and used to estimate the weighted apparent error rate, taking into account the amount of data in each class, according to Eq.3.
For the mining class, there were a total of 1.985 records where 223 of them were outside the range according to the value of the discriminant point, thus- resulting in apparent error rate of 11.2%. As for the non-mining class, it consisted of 1.883 records, 118 of which did not belong to the range set by the value of the discriminant point. The value of the apparent error rate is 6.4% and the weighted value of the apparent error rate corresponds to 8.9%.
Fig. 5 shows an example of the results obtained from the classification of open-pit mining zones using the Brovey transform in its band 2:

Source: The Authors.
Figure 3 Histograms comparison of the spectral indices for mining and non-mining classes. Spectral indices: a = clay minerals, b = ferrous minerals, c = iron oxide (ferric minerals), d = TNDVI, e = NDVI, f = simple ratio, g = DVI, h = principal components, i = sqrt simple ratio.

Source: The Authors.
Figure 4 Histograms comparison of the images fusion techniques for mining and non-mining classes. Image fusiontechniques: Brovey fusion a = band1, b = band2, c = band3. Wavelet fusion d = band1, e = band2, f = band3.
Table 2 Discriminant power values according to Fisher’s ratio.

*SD: Standard deviation. **FDR: Fisher’s discriminant ratio.
Source: The Authors.

5. Conclusions and recommendations
The Brovey transform image fusion technique in its band 2 was determined as the procedure with the highest discriminant power to classify open-pit mining zones, using as classification thresholds values between 0.3225 and 0.5237 for the area under study, with a weighted apparent error rate of 8.9%. It is important to highlight however, that this value is conditioned by the size of the mining and non-mining samples.
It was also shown that the ferrous minerals and clay minerals spectral indices have the least discriminant power for the area under study, despite the fact that these indices have been mainly designed for, and implemented in, the detection of certain types of minerals.
From the results obtained, the Brovey transform image fusion technique is identified as a major input for the detection and identification of open-pit mining areas, with a plausible prospection of being used as part of a monitoring system for such areas.
It is recommended to incorporate to the results presented in this article, an object-oriented image analysis, which enables the integration of other elements that could lead to the constitution of a new mappable thematic unity of the official map of land cover (Corine Land cover) called “Mining Zones”.

