


 English (pdf)
 Article in xml format
 Article references
 Send this article by e-mail
 Cited by SciELO
  Cited by Google
  Similars in
SciELO
Similars in
SciELO  Similars in Google
 Permalink
1. Introduction
Throughout history, the development of the conception about the Physical world and its interaction with the fundamental forces has given more relevance to light as one of the most important electromagnetic phenomena in the development of life, and, as a fundamental basis for many practical solutions that make our existence easier today. Because of this, applications with the greatest impact within the four major areas of influence of optics (Instrumentation, Metrology, Communications, Border Optics), such as the industrial uses in medicine, biology, communications, environmental monitoring, among others, have promoted this topic. [1]. These developments have been based on the study of the behavior of some properties of light such as the intensity of data transmission or illumination, analysis of spectral content, associated with colors for the construction of images, Identification of compounds, etc., just to mention some applications [2]. The Spin Angular Momentum and the Orbital Angular Momentum characteristics of light have been recently described [3]; the latter with great potential to generate and to improve existing engineering applications within the communications networks, as it is described in the article from BBC News which highlights this new technology as very promising. [4]
The Orbital Angular Momentum OAM, has revolutionized many fields; it has especially transformed the vision on Optical Communications [5]. Currently sending data through an optical fiber uses a coding principle where bit 1 is associated to a light pulse, and in its absence bit 0 [7]. These features are surpassed by Orbital Angular Momentum, due to its lack of need to interrupt the beam for data transfer, providing immunity to electromagnetic interference, increasing bandwidth, transmission rate and channel capacity, thus making the communication process more efficient [6]. For these reasons, methods have currently been developed which allow a deep study of the applicability of OAM. Within these methods, techniques have been produced for generation and detection, with experimental procedures, such as: digital image processing [7], Holographic diffraction [5] and Interferometry [8] among others. Methods and developments associated with the construction and implementation of a data decoding architecture are shown. They use spatial filters at nanoscale order. For this purpose, physics theory of OAM beams is presented. The arguments for selecting and design components of the decoder, as well as experimental details, discussions and results, showing the feasibility of the proposed method for decoding information.
2. Theoretical Formulation
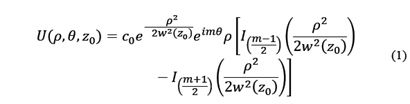
Consider a Bessel-Gauss beam with an integer topological charge m as an incident beam, whose electromagnetic field amplitude is given by [8,9]:
Where
 is a complex constant,
 the radius of the beam at the aperture plane,

 the radius of the wave front,
 Rayleigh’s range,
 is the beam waist,
 is the wave number of monochrome OAM beam, and
 are the modified Bessel’s functions. The term
 expresses the OAM’s phase, where the value of
 indicates the number of rotations of the wave front on the propagation axis, which is called the topological charge.
As Fig. 1 shows, the phase representation is between
 and
and
 , for a range of
 , equivalent to three rotations of the wavefront. The range display is possible thanks to the mapping of phase discontinuities mathematically limited to the interval
 .
.

Source: The Authors
Figure 1 Magnitude (normalized energy) and phase (unwrapped) of a Bessel - Gauss beam, with topological charge m = 3.
Eq.(1) describes the field distribution at a distance

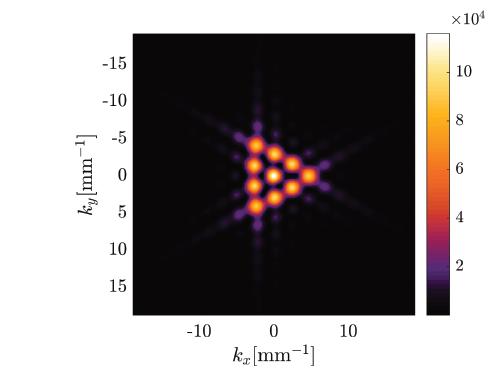
 . At this z-position an equilateral triangular aperture is located. If it is taken into account that the transmittance function associated corresponds to the unit value at its interior and zero outside, it is easy to calculate its diffraction pattern far field, as shown in the Fig. 2.

Source: The Authors.
Figure 2 Diffraction pattern resulting from diffraction by numerical simulation of an OAM beam with TC, m = 3, through an equilateral triangular aperture.
The triangular aperture provides a simple and easy method for determining the magnitude and sign of the topological charge of the OAM beam. The number of external spots or spots along one of its sides minus one corresponds to the topological charge of the optical vortex [10]. When the OAM beam has an opposite topological charge, the triangular diffraction pattern far field, is rotated 180 degrees compared to original one [11].
In quantum mechanics, Born´s rule predicts that quantum interference, for instance in a double-slit or Young's diffraction experiment, occurs through disjoint pairs of paths. A generalized version could allow multiple paths of interference. Sinha et al. performed a three-slit experiment, demonstrating the consistency of the postulate in both, semi classical and quantum regimes [12].
Under Born rule, the diffraction pattern by the triangular equilateral aperture, viewed as a combination of slits, can be reconstructed from the interaction between the multiple pairs of disjoint slits that may be contained within the triangular slit.
Sorkin [13], proposes a series of configurations of symmetrical functions, which generalize the terms of interference. Considering that
 are mutually disjoint sets, meaning the intersection between them is empty.

In eq. (2) the interference is described for three sets, which are intrinsically related to double and single sets, where
 represent the set of points, which form the apertures thus labeled (See Fig. 3).
 is the conjoint probability and,
 the probabilities that present a quantum measure of sets or its appropriate combination, respectively.
 represents the union of the disjoint sets.

Sinha et al. [12], make an interpretation of the Born rule for individual photons from wave functions that define the probability density to find a particle in a position
 in a time
 . In the double slit diffraction experiment
 you can see that:

meaning,


Where  Corresponds to the probability that a photon, through the slit
  y
y  represents the conjugate complex. Hence this results in the second-order interference term:

Considering the case in which the interference term in eq. (6), no longer corresponds to individual photons but to a conglomerate of photons, we have that the description of probability for the position of a photon, is now associated with the intensity, since it addresses the position for n photons corresponding to diffraction pattern, light or dark areas, according to which it can be said that:

From the eq. (3), (5) and (7)can easily be deduced that:
 It means,


Thus, if one considers eq. (12) together with the illustration of Fig. 3, it can be found that complete diffraction can be reconstructed from the relationship of intensity patterns of single and double apertures [14].
Using the label sets of Fig. 3, an OAM beam is diffracted as described in eq. (1), resulting in the diffraction patterns shown in Fig. 4, 5.

Source: The Authors.
Figure 4 Diffraction patterns for m = 3, due to the contribution of each separate, disjoint and labeled slits as A, B, C.

Source: The Authors.
Figure 5 Diffraction patterns contributions due to each pair of independent slits labeled AB, BC and CA.
It is important to note that the individual slits constituting the complete triangular equilateral aperture;
 they never intercept.
 represents an increase of five times, compared to the original image, for visualization purposes. Thus, by considering the combination in eq.(12), it is possible to recover the diffraction pattern associated with an OAM beam, as seen in Fig. 6.
With this brief discussion, the validity of Born´s rule is verified numerically for an equilateral triangular aperture, providing a simple explanation of the array of bright spots that appear, which allows the determination of the magnitude and sign of the topological charge of OAM beam. Taking a lot of importance in the proposed decoder, since although changes occur in the diffraction pattern, information is preserved, only its representation is modified.
Now, a vortex is made to diffract on a straight edge of thick thickness
 , such that
 , Located on the transversal symmetry axis of the mode. The triangular aperture is used as a tool for verify the information in the OAM field distribution that is diffracted. In Fig. 7, the diffraction pattern obtained from the numerical simulation is showed.
Although the pattern of spots is not present, the information of the vortex is preserved after diffraction by the thin straight edge. For this reason, if you look closely, the pattern of lines in Fig. 7(c) ., maintains a symmetry by means of which it is possible to identify the sign and the topological charge value in the incident OAM beam, is an alternative manner.
A positive or negative slope of the edge orientation on the transversal plane to the optical axis allows patterns identical to those in Fig. 7(c) . to be obtained but rotated and in accordance with the inclination of the edge, as shown in Fig. 8.

Source: The Authors
Figure 7 Diffraction pattern of an OAM beam with m = 3, by an straight edge (a), using an equilateral triangular aperture to evaluate the topological charge (b) and, the simulation results (c).
Source: The Authors.
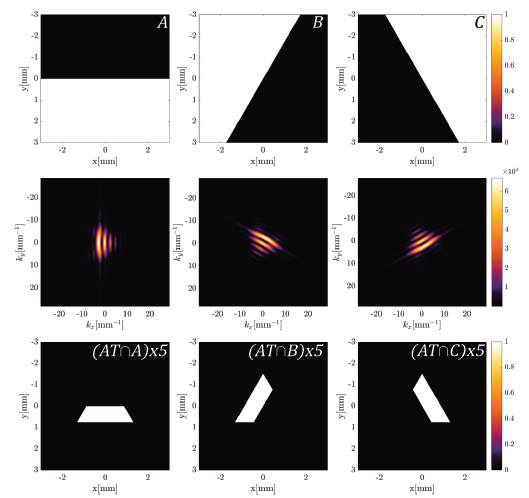
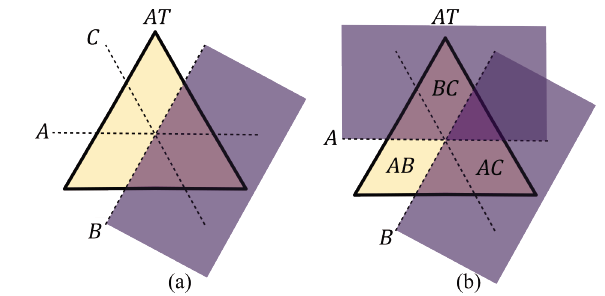
Figure 8 Diffraction patterns for an incident OAM beam with topological charge three diffracted by an edge (A, B or C) and its analysis using an equilateral triangular aperture AT.
In order to verify the conservation of the information on diffraction pattern, slits labeled as AT∩A, AT∩B, AT∩C correspond to the intersection between the triangular aperture AT and the straight edge in three different orientations (A, B and C) shown in first line. As already shown, it is possible to recover the diffraction pattern of an OAM beam by an equilateral triangular aperture, following the postulate of Born [15], from the relation between simple and mutually disjoint sets.

Source: The Authors.
Figure 9 Diffraction pattern for an incident OAM beam with topological charge three diffracted by a double straight edge (A∩B, A∩C or B∩C) and its analysis using an equilateral triangular aperture AT.
The grooves of Fig. 8., are the result of studying the straight edge so that its orientation coincides with the orientation of the sides of equilateral triangle.
Now in Fig. 9. we study the intersection between the straight edges (A∩B, A∩C and B∩C), with the triangular aperture generating the slits AT∩(A∩B), AT∩ (A∩C), AT∩ (B∩C).
From Fig. 10, the symmetry of the slits emulated by the superposition of different straight edge orientations and the triangular equilateral aperture, shows how these slits (A∩B, A∩C and B∩C) are not mutually disjoint, which implies that Born´s rule [13], is not applicable.
Although the conditions for using the Born rule are not met, it is possible to construct the resulting field by adding the diffraction figures for the three mutually rotated edges viewed through the triangular aperture as shown in Fig. 11(b) ., so that by operating these diffraction figures as described below, it is also possible to reconstruct the diffraction pattern of the propagating OAM beam.

Where
 is the intensity pattern due to edge

 viewed through the aperture

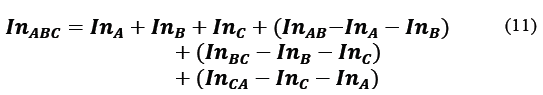
Upon careful examination of Fig. 10(b) . it is possible to identify that the generated apertures (AT∩(A∩B), AT∩ (A∩C), AT∩(B∩C)) are mutually disjoints and they’re contained in slits of Fig. 10(a) . (AT∩A, AT∩C, AT∩B). For that reason, eq. (13) contains the first three terms of the Born rule for three disjoint slits contained in the equilateral triangular aperture, where the first three terms of intensity correspond to the diffraction due to double slits [13].
If we complete the eq.(13) added with the interference terms due to the double straight edges, (A∩B, A∩C, B∩C), the following is obtained:

Where
 is the diffraction pattern due to the simple and double edges
 respectively viewed since the aperture
 . In Fig. 11(c) . is shown the addition obtained for the diffraction patterns of OAM beam.
Source: The Authors.
Figure 10 Interaction’s geometry, straight edge - triangular equilateral aperture (AB = A∩B, AC = A∩C, BC = B∩C).
As observed in Fig.11(b) . and 11.(c), The addition of diffraction figures is more than sufficient to identify the topological charge of incident OAM beam [11], although the straight edges are not mutually disjoint.

Source: The Authors.
Figure 11 Theorical diffraction pattern (a), reconstruction by the eq. (13) (b), reconstruction by the eq. (14)(c) for a OAM beam with topological charge three.
Correlating images obtained in Fig.11(b) . and images in Fig.11(c) . with Fig.11(a) ., correlation factors of approximately 0.9591 and 0.9962 are obtained (See Table 1).

To verify the validity of the approximation in eq. (13) and (14), the reconstruction of the diffraction patterns corresponding to different upper and lower orders of topological charge value is performed. The above-mentioned correlations are calculated and shown in the Table 1.
The current analysis of this technique to calculate the topological charge of an OAM beam, has been reported to make possible the identification of optical vortices with topological charge of up to m = 20. That is to say, when used in combination with a rectangular aperture, the triangular aperture allows to identify the sign of the TC and, the rectangular aperture for even modes, provides an accurate description of the phase structure of the incident OAM beam by means of the number of external light spots [16]. Focusing on the triangular aperture and its interaction with a straight edge, it would be more efficient to count lines and, with a criterion of symmetry in addition to the counting of maxima, to identify topological charges with greater value.
In Fig.12, dot pattern corresponding to m = 20 can be easily measured. Although respectively the correlation factors R1and R2 are ~0.9487 and ~0.9999, the images are difficult to interpret. For this reason, a numerical simulation of an OAM beam with m = 21 diffracted by a straight edge seen through a triangular aperture (see Fig. 13(a) .) is conducted. In this way, we can overcome what has so far been achieved with triangular apertures, in identifying high TC for an incident OAM beam [16].

Source The Authors.
Figure 12 Theorical diffraction pattern (a), reconstruction from eq. (13) (b), reconstruction from eq. (14) (c), for a beam with topological charge twenty.
Source: The Authors.
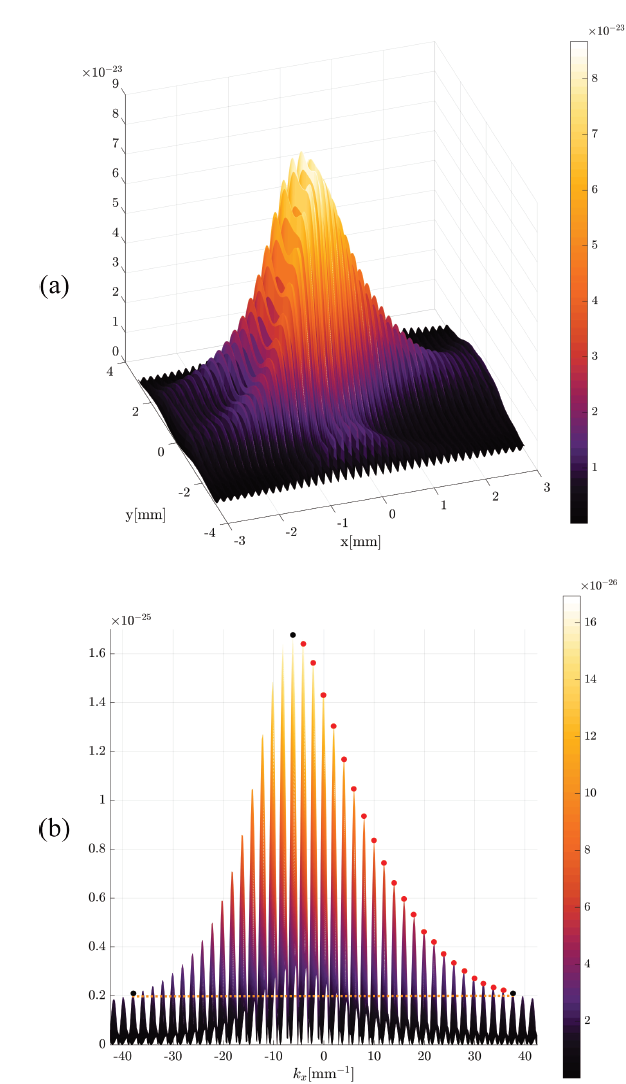
Figure 13 Diffraction figure of an incident OAM beam with topological charge twenty-one, by an edge, using an equilateral (upper) triangular aperture for its evaluation. Horizontal profile to the center of the diffraction plane (bottom).
If considered, a horizontal profile centered on the plane of diffraction pattern, gives a graph such as that of the Fig. 13. (b), which allows to identify in a simpler way, the topological charge, using the position of the global maximum and the number of maxima in the range of symmetry. This represents a simple and valuable processing at the time of its implementation. Thus, symmetry error is calculated to verify the effectiveness of the method for azimuthal phase factors greater than 20, obtaining 1.69% error among the coincident maxima.
The decoding system based on the maximum count was validated experimentally and numerically. To perform the latter, a model is proposed, which describes, through parameters of transmittance, thickness and index of refraction, the influence of the straight edge of nanometric film on a vortex with orbital angular momentum.
As shown in Fig.14., the geometry of model proposed allows to introduce a multiplicative complex term to the OAM beam after diffraction by the straight edge. The refraction index of material
 , is normally associated with a delay in the propagation time of the electromagnetic wave, is a phase term. The phase introduced by the deposited film must maintain a proportional relationship between the total phase
 in one wavelength (λ), according to its thickness
 From the transmitted intensity point of view, its transmittance
 must be considered.
The relative position of the vortex with respect to the edge of the straight film is among the important features in the development of the model, assuming the vortex centered on the optical axis of propagation. It is important to note the transition between the substrate and the border of grown film, which implies a relationship between the individual transmittance of the two halves (See Fig. 14).

Source: The Authors.
Figure 14 Geometry proposed for a straight edge obstacle of longitudinal dimension comparable to the incident wavelength of OAM beam.
The pattern of lines on the far-field, resulting from the optical vortex-straight edge interaction seen with the help of AT, is analyzed through the profile in intensity of the image acquired and viewed by computer using a CCD camera. This profile shows variable horizontal dissymmetry, depending of the relative position of the edge with regards to the optical axis. Because of this, a micrometric scanning was performed, retaining five vertical positions of the film border (see Fig.15.). From the analysis of these profiles, an identification rule based on the maximum counts, referred to the absolute maximum and between symmetrical lateral peaks is proposed.

Source: The Authors.
Figure 15 Vertical successive relative positions of the nanometric straight edge used. The rings represent the OAM incident beam relative to border position.
Numerically, diffraction in the far field of an OAM beam with m = 3 is obtained by focusing on the edge, for different vertical positions relative to the optical axis of propagation, as seen in Fig. 16.
Source: The Authors.
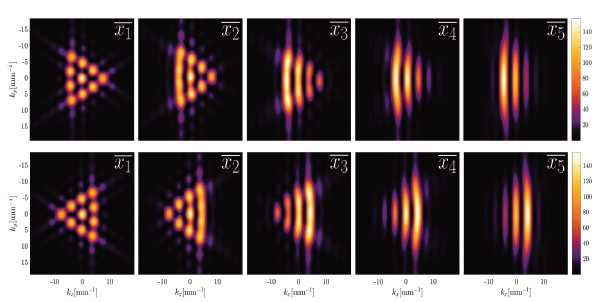
Figure 16 Diffraction figures associated with topological charges, m = ± 3 for five vertical positions relative to the optical vortex of incident OAM beam.
A profile is drawn for three different patterns as shown in Fig. 17., where the existing dissymmetry is confirmed. The symmetry error is evaluated between lateral maximums that appear to be symmetrical, for the five edge positions (tagged
 and it is shown in Table 2. With this criterion, the profiles of
 and
and
 , are contrasted, so that when viewing the position of the global maximum with respect to the center of the frame, it is possible to identify the sign of the topological charge, easily and effectively in the profile
 .
.

Source: The Authors.
Figure 17 .Intensity horizontal profiles for the diffraction patterns associated to the interaction of the OAM beam with topological charge m=+3. Diffraction is produced by a straight edge nanometric size for three different vertical positions, seen through the triangular aperture AT and to the center of each diffraction pattern.
Table 2 Quantified symmetry error between the first coincident lateral lobes, with respect to the profile center of diffraction pattern for m = +3.

Source: The Authors.
Considering the measures of the right and left relative maximum with respect to the axis of symmetry of the plotted profile, one has:
Numerical diffraction of OAM beams with TC from m = ±1 to m = ±5, are shown in Fig. 18. The experimental implementation was performed with the device outlined in Fig. 19. by obtaining the far-field diffraction patterns shown in Fig. 22.


3. Experimental results
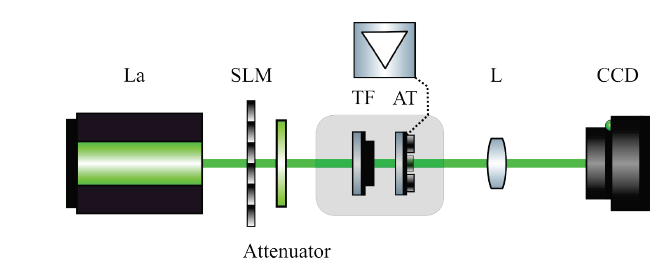
The experimental setup done is shown in the Fig.19.
Source: The Authors.
Figure 19 Experimental setup for verifying the topological charge from an OAM beam diffracted through straight edge.
Figure 19 shows: laser (La), Spatial Light Modulator (SLM), attenuator to control the energy of the OAM beam, thin film (TF), triangular equilateral aperture (AT), Fourier Lens (L) and CCD camera. In Fig. 20 (c) . the numerical results of Fig 7(c).are verified.
From the Fig. 20. when an OAM beam is diffracted by a nanoscale straight edge, centered at the optical propagation axis and seen through AT, a characteristic lines pattern is produced, which provides a good alternative for finding the magnitude and sign of the topological charge of the OAM beam at the time of its incidence. For simulation purposes, this is achieved from transparent and dark areas (See Fig. 7.). Experimentally, nanoscale films with near-zero transmittance
 and a thickness comparable to the wavelength, were grown on the middle of a substrate of
 , whose transmittance in intensity is higher than 70%.

Source: The Authors.
Figure 20 Experimental result for an OAM beam diffraction pattern (Topological charge is m = +3). Diffraction is produced by a straight edge of thickness ≈ 660 [nm] (a), Equilateral triangular aperture used to obtain the topological charge of the OAM beam (b) and, obtained pattern c).
Next, the transmittance curves for the substrate and the film are measured for eleven wavelengths between 405 [nm] and 980 [nm]. The thickness of the films here is 660 [nm].
When the horizontally centered profiles are calculated for theoretical and experimental patterns as shown in Fig. 23., the symmetry measurements easily are obtained in Tables 3. and 4. After verifying the perfect concordance between the profiles obtained by numerical simulation and those obtained experimentally, it is the calculation of dissymmetry that allow to propose a new rule of measurement of TC:


Source: The Authors
Figure 21 Experimental Transmittance curve for SrTiO3 (Blue), and TiO2 (Orange).

Source: The Authors.
Figure 22 Experimental results of the far-field of different OAM beams, m=±1→ ±5, diffracted by the edge of Ti=0,2%, film; view through AT.

Source: The Authors.
Figure 23 Intensity profiles in far-field for an OAM beam with CT m = + 1 theoretical (left), experimental (right).
Table 3 Symmetry error between the first coincident lobes around the center of profile, for the diffraction pattern of an OAM beam with topological charge m = + 1 ( + 5, obtained by simulation.

Source: The Authors.
Table 4 Symmetry error between the first coincident lobes around the center of profile, for the diffraction pattern of an OAM beam with topological charge m = + 1 ( + 5, experimentally obtained.

Source: The Authors.
Where
 represents the number of maxima, which satisfy the condition for
 , greater than the threshold
 with a tolerance
 (threshold of symmetry). The threshold is calculated, from the first coincident maximums after the global maximum, for which an estimate of the symmetry is made by measuring approximately coincident or closely coincident amplitudes. The tolerance allows that when they are not exactly coincident the symmetry parameter can be found.
From this result, is possible to appreciate the improvement introduced to techniques for detecting the topological charge of an OAM beam. Here is reduced to the diffraction of OAM beam by a straight edge and a triangular equilateral aperture analysis; due that the use of additional optics is suppressed which would be necessary for interferometric measurement and more efficient than optical vortex’s radius measurement. In addition, this proposal decreases the cost of implementation. The rule described above in eq.(15) is essential to develop the algorithm capable of measure the information on the transmission channel of a data reception system. The system allows associate eight phase states to a combination of three bits. The eight states can be easily established e.g., from TC m = ±1 to ±4. This shows the advantage in increasing the channel capacity, since the transmission at the physical layer level is not given bit by bit.
4. Conclusions
The correspondence between the Fraunhofer diffraction patterns, obtained by simulation and those obtained experimentally for an incident OAM beam, was demonstrated when diffraction is produced by a straight edge of thick film (>λ) with a transmittance close to zero.
Born´s rule was verified for classical conditions, which explains the formation of luminous bright spots net for the Fraunhofer pattern of an OAM beam diffracted by an equilateral triangular aperture. Additionally, a simple rule for the reconstruction of the diffraction pattern with slits that are not mutually disjoint is proposed. We find high correlation values when the reconstructed Fraunhofer pattern is correlated with respect to the original one.
Calculated values are more than 90%, which allow to identify in the reconstructed representations an appropriate correspondence for the measurement of the topological charge.
For incident OAM beams, which have diffracted through the straight edge of thick film and viewed through an equilateral triangular aperture it’s possible to discriminate the value of its topological charge as well as its sign using the new rule proposed here. This proposed method eliminates the use of additional energy sources and optics, so that it is possible to efficiently identify the information contained in the optical vortex being propagated, since the identification of the sign is reduced to find the position of the global maximum with respect to the optical axis of propagation, and the magnitude to count of maxima that fall within the zone of symmetry, which is of vital importance in the implementation in a compact device.
Writing fork holograms on a SLM, the optoelectronic architecture for encoding and transmission of the information was generated, using as a channel the free space. In addition, including a nanometric film and a triangular equilateral aperture, the decoding architecture, which use the profile at center on diffraction pattern to identify the magnitude and sign of TC sending by the transmitter, was generated. Subsequently it was verified that the data sent corresponded to the received data, through the measurement made from eq. (15).

