


 English (pdf)
 Article in xml format
 Article references
 Send this article by e-mail
 Cited by SciELO
  Cited by Google
  Similars in
SciELO
Similars in
SciELO  Similars in Google
 Permalink
1. Introduction
In cement manufacturing, the grinding process is affected by many factors, one of which is ball size distribution (BDS). In fact, not getting a good ball size distribution could negatively affect the product’s output as well as its quality [1]. Knowing the distribution of the ball size at the beginning of the process would help the system to reach a steady state in a shorter period of time, making the grinding more efficient and reducing the mills’ energy consumption. Several studies show that ball size distribution affects the mill’s efficiency and productivity [2-11]. Also, in industrial mills when the dust reaches some degree of fineness, using big balls in the mill can result in low productivity, high energy consumption and a non-compliance product. Therefore, a reasonable distribution of the ball size is the key to reach the crushing and grinding balance.
Nowadays, there are several mathematical models for modeling particle size distribution. One of them is the Rosin-Rammler distribution function (also known as Weilbull distribution), which is a two-parameter distribution widely used to describe or model both fine and coarse particles [12]. This distribution was originally used by Rosin and Rammler to describe the size distribution of particles generated by crushing and grinding [13]; García et al. [14] successfully applied the Rosin-Rammler [13] and the Gates-Gaudin-Schumman (GGS) distribution models [15,16] to agglomerated cork. There is another kind of distribution that was initially applied for modeling fragmented rock by blasting. This is known as the Swebrec function [17,18], which has three parameters and has been also used to model fines [19]. José A. Sanchidrián et al [20] used different data of fragmented rock of sizes from 0.002mm to 2000mm aiming to demonstrate which distribution function best describes fragmented rock, and found that, in terms of coefficient of determination R2, Rosin-Rammler is the best two-parameter function to describe rock fragments and, among the three-parameter distribution models, Swebrec is the best one, with an R2 very closed to 1. Recently Shuhua Liu et al [21] showed that the size distribution of particles of copper tails dust fits the RR and Swebrec models. On the other hand, recent studies related to the ball wear kinetics with the aim of obtaining the ball size distribution, have been addressed in the references [22-24].
Due to the importance given to these distributions in recent as well as in old studies, a comparison of the three models - Rosin-Rammler, Swebrec and Gates-Gaudin-Schumman - was carried out in order to define which one best describes an alumina ball size distribution in an industrial mill. None of these models have been used to model a BSD because of the difficulty sieving the balls to gather experimental data. For the present research, the balls sieving was possible due to the fact that the mill was stopped for maintenance.
2. Mathematical models used to determine the ball size distribution
As already mentioned, we will apply three distribution models, of two and three parameters, used for both coarses and fines, but it was difficult to find literature for their application on BSD.
The three-parameter model that we will implement for this research is the Swebrec Distribution model described below.
Considering that cumulative passing function F(x) can be expressed as:
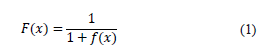
and taking into consideration that f (x max )=0 and f (x 50 )=1, the function is fixed at xmax and x50.
Finally, f(x) is:

As a consequence, the Swebrec distribution function can be described as:
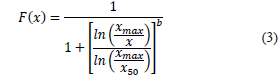
where F(x) is cumulative passing at x size; x max is maximum size; x 50 , size passing 50% weight and b the curve waving parameter.
The Gades-Gaudin-Schumman is another model to be used for this research, since it is frequently applied in crushing and grinding, defined by:
where F(x) is the sample fraction finer than size x, x is the particle diameter, K is the maximum diameter of the particles (size modulus) expressed in mm, and n (distribution modulus) is an adjustable and dimensionless parameter.
Applying a logarithm on both sides of Eq. (4) we obtain a linear model whose equation corresponds to a straight line with slope n, as follows:

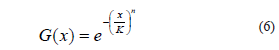
Finally, the third model to be applied is the Rosin-Rammler model, which is defined by:

where G(x) is the distribution function and x is the particle size expressed in mm, K is the size modulus (mm), and n is a measurement of the particle size variability, K and n being adjustable characteristic parameters of the distribution.
Eq. (6) can be re-written in the following way:

3. Experimental procedure and initial condition
During the mill maintenance stop of a crushing and grinding plant, the ball bed for one mill was unloaded with its 31424 tons of alumina balls.
The mill was initially uploaded with 31543 tons of balls before starting the grinding process. It was then reloaded during the process with balls of a single size (38.10 mm). The ground material used was silica sand. Figs. 1a and 1b shows an interior view of the mill employed in this study, before and after the maintenance stops, respectively.

Source: The Authors.
Figure 1: (a) picture of the mill before being unloaded; (b) picture of the mill after being unloaded.
The mill inner diameter D (usable diameter) is 242 cm and the mill inner length (usable length) is 650 cm. The balls of the mill were sieved through meshes of (38.10 mm), (31.75 mm), (25.40 mm), (19.05 mm), and (12.70 mm), and weighed before and after the maintenance stops, in order to determine the experimental ball size distribution (BSD).
4. Results and Discussion
Table 1 shows the initial percentage of the ball load before starting the grinding process, whose values are 15.79%, 25.84%, 43.96%, 11.63%, 2.78% for the ball sizes 38.10 mm, 31.75 mm, 25.40 mm, 19.05 mm and 12.70 mm, respectively. During the unloading process, it was determined that the percentage of the balls sieved by using the widest mesh was around 13.03%, while for the other mesh sizes -[31.75 mm, 38.10 mm], [25.40 mm, 31.75 mm], [19.05 mm, 25.40 mm], [12.70 mm, 19.05 mm] and [0.0 mm, 12.70 mm]- the percentages were 39.46%, 30.25%, 11.46%, 4.87% and 0.92%, respectively. From this standpoint, it can be seen that the 38.10-mm and 25.40-mm balls had a higher wearing. On the other hand, balls of 31.75 mm, 19.05 mm and 12.70 mm had a lower wearing during this process.

The adjustment equation for the Swebrec function is given by:
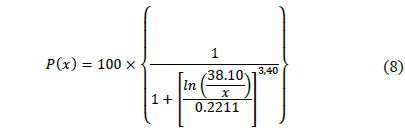
The adjustment of the experimental data for the BSD of the Swebrec distribution is presented in Figs. 2 and 3.
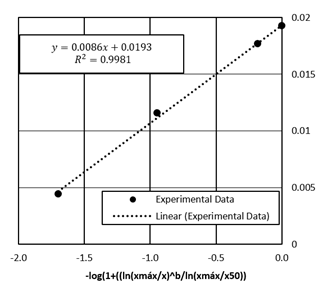
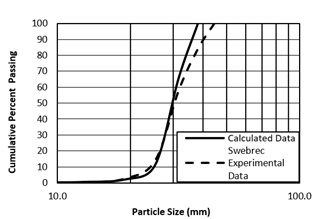
From Figs. 2 and 3, it can be seen that the Swebrec model is in high agreement with the experimental data, since the correlation coefficient obtained in the adjustment scheme is 0.9981.
In Fig. 3, parameter x50 obtains a value of 30.54 and parameter b obtains a value of 3.40. Some studies report that when b→1, the curve inflexion point tends to x=xmax; also, if parameter b decreases, the curve inflexion point tends to x = x50 [17].
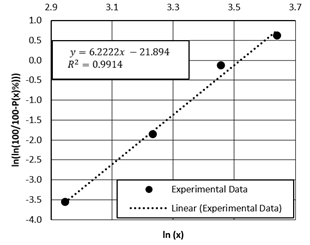
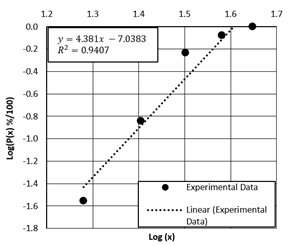
From Figs. 4, 5, 6 and 7, it can be seen that the Gates-Gaudin-Schumann and Rosin-Rammler models are in high agreement with the experimental data, since the correlation coefficients obtained in the adjustment scheme are 0.9407 and 0.9914, respectively. If we analyze the correlation coefficient R2, it can be seen that even though the linear adjustment of the GGS model is very good, the one of the Rosin-Rammler is much better, only exceeded by the Swebrec distribution model.


In this sense, it could be suggested that the Swebrec function it is a sounding alternative for modelling BSD functions in contrast to traditional functions that describe the ceramic ball wear process in white cement industrial mills.
5. Conclusions
The distribution functions that are used the most for characterizing materials are the Gates-Gaudin-Schumman and Rosin-Rammler functions, however, deciding which is the best for modeling the particle size distribution is non-trivial, since the choice of the best distribution function strongly depends on the material studied. That is the case of Gates-Gaudin-Schumman distribution function, which is mainly used in coal preparation studies for what it was originally developed. In this research, from the standpoint of the correlation coefficient in particular, we can conclude that the Rosin-Rammler model is better than the Gates-Gaudin-Schumman for modeling a BSD in the white cement industry, due to the fact that their correlation coefficients were of 0.9914 and 0.9407, respectively. Nevertheless, the proposal of implementing a more modern model was very successful, which was the case of the Swebrec distribution model. This model obtained a correlation coefficient of 0.9981, being better than the Rosin-Rammler and the Gates-Gaudin-Schumman models.
In general, we can conclude that during the grinding process for the production of white cement, the Swebrec function can be chosen as a model of ball size distribution in order to characterize the ball size and thus, to improve the mill performance.

