


 English (pdf)
 Article in xml format
 Article references
 Send this article by e-mail
 Cited by SciELO
  Cited by Google
  Similars in
SciELO
Similars in
SciELO  Similars in Google
 Permalink
Introduction
Green plantain and bananas are important for the diet of approximately 400 million people in the world (Perea, 2003), including the Colombian population. The area planted with bananas in Colombia has been maintained since 1995 (Martínez & Cayón, 2011), and given the economic and social importance of this crop, it is necessary to solve technical problems that affect its productivity, among which one of the most important is the definition and adjustment of fertilizer doses, from the knowledge of Nutrients absorption, accumulation and distribution in the plant during its different development stages. One of those elements that must be adjusted at the level of fertilization based on the requirements per stage of development, is nitrogen.
The nutrient extraction curve for the plant (Bertsch, 2009) is a useful tool to define optimal fertilization doses in crops. In the case of banana, the extraction of mineral nutrients should be studied taking into account the sources of landfill which occur throughout the crop development. Some studies carried out in banana cv. Williams in different regions, have allowed the definition of nutrient extraction curves for harvest season, suggesting fertilization doses (Soto, 2001). In Colombia, the first work on banana nutrient extraction curves for the region of Uraba, was carried out for the cv Gran Enano and Valery (Martínez & Cayón, 2011), but using a single fertilization plan, which have allowed to generate some questions, one of which is the aim of this research, what is the ideal nitrogen dose to achieve the greatest accumulation and better distribution of nutrients expressed in production and fruit quality?. Nitrogen is an essential element within the nutritional management of banana cultivation, it is assimilated by plants mainly in the form of nitrate or ammonium, under conditions of ammonium deficiency in soil, the plant increases a nitrate uptake (Sánchez & Mira, 2013; Osorio, 2014). Its requirements are considered high, greater than 200 kg.ha-1.year-1 (Sánchez & Mira, 2013), according to Marschner (2003), the N optimal content for adequate plant growth is between 2 and 3% of total dry matter.
Robinson & Galán (2012), reported an N optimal content in banana leaf dry matter ranging from 2.5 to 3%. It is important to note that a key role in the mineral nutrients absorption and their foliar expression (third leaf), is the genotype of banana plant. In Brazil, Borges et al. (2006), compared extractive levels of major elements (N, P, K, Ca, Mg and S, respectively) and microelements (B, Cl, Cu, Fe, Mn and Zn, respectively) in 24 genotypes in two production cycles, fertilized with 100 kg.ha-1.year-1 of N, 40 kg.ha-1.year-1 of P2O5 and 300 kg.ha-1.year-1 of K2O found differences among genotypes in two cycles, showing levels from high to medium in (N, P, Ca, Mg, S, and Mn, respectively) and low level for (K, Cl, B, Fe and Zn, respectively) especially in the second cycle where N varied between 21.6 and 28.5 g.kg-1 , K between 13.7 and 30.8 g.kg-1, Mn between 43 and 574 mg.kg-1 and Fe between 56 and 212 mg.kg-1, respectively.
The response of banana cultivation to N, is associated to its soil content, the dose, source and application timing of mineral fertilizers. In addition, it should be considered that roots can absorb some organic forms of nitrogen (peptides and urea) in amounts considered insignificant (Kojima et al., 2007; Rentsch et al., 2007), but may be important for banana because of its adaptation to variable soil moisture conditions (Robinson & Galán 2012). In a banana test in the region de Colima (Mexico), the banana plant responded well at doses of N between 290 and 300 kg.ha-1, provided that soil moisture conditions were maintained at or below -10 KPa, equivalent to field capacity (Orozco & Pérez, 2006).
The aim of this research was to generate (N, P, K, Mg and Ca, respectively) accumulation models during the development of the banana (Musa AAA Simmonds cv. Williams) plant under nitrogen doses.
Materials and methods
Soils and location
The research was carried out in Uraba-Antioquia, Colombia in lots 3 and 4 of the experimental and demonstrative Field of AUGURA (Carepa-Antioquia), located at 7 ° 46 '46 "north latitude and 76 ° 40'20" west longitude, with an average altitude of 20 m. a. s. l., we worked on fine Fluventic Eutrudepts soils, clay loam over clay Fluvaquentic Eutrudept soils and fine loam Vertic Endoaquept soils, classifications defined from the North American taxonomy (IGAC, 2007).
Climatic characteristics during assay
At the moment of the assay, climatic conditions were counted as follows:
• Average relative humidity of 87%, coinciding with the annual average.
• Minimum temperature of 23.2° C
• Average temperature of 26.7° C (regional average of 27° C)
• Maximum temperature of 32.3° C
• Average solar brightness of five hours per day, 1700 hours year-1.
• The average annual rainfall for the region is 2896 mm, but the one reported for the assay was as follows: the First evaluated production cycle of 844.9 mm, with annual average of 2014.2 mm, and 2088 mm for the second production cycle with annual average of 2118.4 mm (each production cycle lasted 10 months). The monthly rainfall variation is shown in Figure 1.

Plant material
A banana crop (Musa AAA Simmonds cv Williams) belonging to the AAA group, giant Cavendish subgroup, Williams clone characterized by an average height of 3.5 m, is more rustic than the cultivar Gran Enano with bunches that present more favorable quality conditions to be packaged in boxes for export, with respect to the Gran Enano cv. it is one of the two most clones sown for export in many tropical regions (Soto, 2001; Robinson & Galán, 2012). Given these concerns, a sixth productive cycle banana plantation was used.
Definition of treatments
For the establishment of the treatments, the fertilization recommended by CENIBANANO for the region and the initial soil analysis were taken into account (Sánchez y Mira, 2013). The treatments were as follows: 1) Absolute control; 2) 0 N; 3) 161 kg.N.ha-1; 4) 321.8 kg.N.ha-1 and 5) 483 kg.N.ha-1. From treatments 2 to 5 the following fertilization was applied: 87.1 kg of P2O5 ha-1; 678.8 kg of K2O.ha-1; 50.5 kg.CaO ha-1; 117.5 kg.M.ha-1, 64.2 kg.S.ha-1; 1.4 kg.B.ha-1 and 9.3 kg of Zn.ha-1, respectively. The mineral sources used were as follows: Urea (46% nitrogen), KMag (22% K2O, 18% MgO and 22% S), Fertiboro (10% boron or 32% B2O3), solutions (30% P2O5, 36% Ca % of S and 8% of Si); zinc oxide (80% Zn), potassium sulfate (50% K2O and 18% S) and KCl (60% K2O). Each treatment was repeated 4 times, it was clarified that the replicates or blocks were distributed based on the soil taxonomic unit present in the area where the assay was installed.
Assay management
In order to obtain an assay establishment, the soil spatial variability was related, which have allowed the establishment of four replicates or blocks, in which treatments were randomized, each treatment being matched with the area units called "botalones" which had 1563 m2 and 250 banana plants, there were selected 15 by height (between 1.0 and 1.50 m) that formed the experimental unit and the evaluations were performed during the research. At each plant development stage (vegetative stage: 5 to 6 to be selected son of succession, floral differentiation stage: plants from 10 to 11 weeks old, flowering plants: from 28 to 29 weeks, fructification: plants from 32 to 33 Weeks and harvested plants: from 39 to 40 weeks). Alternatively, a plant was dissected and the obtained samples per organ were dried and conducted to the soil and water laboratory of Facultad de Ciencias Agrarias, Universidad Nacional de Colombia, Bogota-Colombia, where each one was evaluated in terms of the N, K, P, Ca and Mg contents using the standardized and certified methodologies applied by the soil and water laboratory of the Facultad de Ciencias Agrarias, Universidad Nacional de Colombia campus Bogota-Colombia. In addition, content results for each nutrient and organ were subsequently added to obtain the value per plant.
The agronomic management was the same as that given to the commercial banana crop with the exception of fertilization doses, which means that the 17 fertilization cycles used per year, were maintained.
Experimental design
Statistically it was used a multivariate analysis for which it worked the differences among cycles to eliminate the effect of this factor, the design was a complete randomized blocks with five treatments and four replicates. It is important to clarify that the analysis consisted of two interpretation levels as follows: inferential, which have allowed to evaluate the interactions among treatment and developmental factors, furthermore the possible effect of spatial variability (blocks); descriptive, with figures of dotted lines and average tables, which have allowed the best response selection or responses per treatment. The best fit curves and equations were found using the EXCEL 2010 program(r).
Results and discussion
Nitrogen content
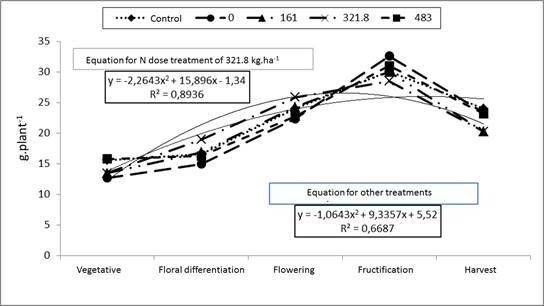
The multivariate analysis only showed significant differences among development stages (P <0.0001), while the descriptive analysis (Figure 2), showed a better behavior in N accumulation by N dose of 321.8 kg.ha-1, from vegetative stage to fructification increased in the banana plant, clarifying that in flowering its behavior was similar to N dose of 483 kg.ha-1.

At harvest timing, the best response was given by N dose of 483 kg.ha-1 followed by N doses of 321.8.ha-1, this response coincides with that reported by Nyombi et al. (2010), who worked with N doses of 400 kg of N.ha-1, achieved increases in nitrogen accumulation, which were expressed in a yield increased. Castillo et al. (2011), using N doses between 560 and 750 kg.ha-1 in Dominico banana (Musa ssp), obtained the best nitrogen contents in the plant, while Yang et al. (2013), obtained the highest N in a plant with a N dose of 385.6 kg.ha-1 working on a banana CV (Musa ABB, Pisang Awak). Alternatively, Srikul & Turner (1995), found similar responses working with the Williams banana CV, this allows to affirm and to support the raised by Soto (2001), which indicates that at higher N doses, occurs a greater nutrient accumulation, because involve an increased dry matter.
When we observe the equation for N dose of 321.8.ha-1 (Figure 2), we can see that had a better performance than the average with respect to other treatments. In this context, N dose of 483.ha-1 is the only one that presents upward behavior until harvest, which makes it another good alternative, outside the one of 321.8 kg.ha-1, as a source of N accumulation in plant.
The main reason for N content decreased from fructification to harvest stage in most treatments, with the exception of N dose of 483 kg.ha-1, is associated with the source dump process, which is increased among these two plant development stages, coupled with the natural process of leaf reduction among these two stages (Soto, 2001). Therefore, the increase that occurs in N dose of 483 kg.ha-1 in fructification stage, may be related to N accumulation not only in bunch but in other plant organs.
In order to evaluate more accurately the real effect of N doses on the accumulation of this nutrient in the banana plant, the proposed criteria by Snyder (2009), was used, who defines the applied N efficiency evaluation and correlates the accumulated nitrogen in plant aerial biomass, for this particular case, it was decided to apply it by each plant cycle. This expression is called Efficiency in Nitrogen Recovery (ENR) and is defined in Equation 1.
 Equation 1
Where:
U = Total nitrogen accumulation in aerial biomass with nitrogen application.
Uo = Total nitrogen accumulation in aerial biomass without nitrogen application.
D = Amount of applied nitrogen (as fertilizer).
In Table 1, the ENR for the first cycle, was higher in the treatment with 161 kg.ha-1 of nitrogen, for the second cycle was the N dose of 321.8 kg.ha-1, which performed the highest efficiency in recovery. Therefore, it can be stated that this response for the two cycles is directly related to changes in rainfall conditions (Soto, 2001). This information is useful and exhibits lower efficiency in the first cycle for high nitrogen doses, while for the second cycle, the N dose of 321.8 kg.ha-1, shows greater efficiency.

A relevant aspect of reported data in Table 1, is the ENR value achieved by N dose of 161 kg.ha-1 for the first cycle, can be considered inappropriate, while the N dose of 321.8 kg.ha-1 for the second cycle, can be assumed as appropriate, according to the defined criteria for this parameter exposed by Snyder (2009), who states that a typical recovery for cereals is between 0.3 and 0.5. Although banana plant is morphologically and physiologically very different but which, manifests N uptake with a dry matter increased (Soto, 2001), and it is suggested to use this parameter as valid, as long as it is not defined and adjusted for banana CV, from comparison of different research including the present.
In concordance to the above mentioned, it is possible to be affirmed that the N dose of 321.8 kg.h-1 is the one that manifests the best ENR for the current research in its second cycle, which have allowed to present the best climatic conditions and is manifested when its contents are averaged in what already analyzed in Figure 1. Therefore, N dose interaction with the climatic conditions, constitutes an important factor on nitrogen fertilization response.
Potassium content
The multivariate analysis for this nutrient, brought only statistical differences among plant development stages (P <0.0001), a verified effect in the descriptive analysis (Figure 3), where there is an evidence of N increase during plant development, but do not show any significant differences in K accumulation response in banana plant per treatment. Although, observing the behavior of N dose of 483 kg.ha-1, specifically from the harvest stage, exhibits a better behavior than the N dose of 321.8 kg.ha-1 in K accumulation, which have allowed to infer that for this element, the higher N dose may be a good alternative, behavior that is based on what was proposed by Soto (2001), in the sense that at higher N doses, occurs a greater K accumulation.

As can be observed, potassium behavior is to increase until fructification to later tend to diminish to harvest timing (Figure 3). This response is explained by source dump process, which is accentuated to harvest, reducing the content of this nutrient in other storage organs (Robinson & Galán, 2012). A relevant aspect of this nutrient is that it is the one with the highest plant accumulation followed by N (Sánchez & Mira, 2013).
Phosphorus content
Statistically, performed a similar response that the K, and like this one, its values increased until fructification (Figure 4), to later diminish into harvest. When observing the flowering stage in Figure 4, we can see the best response was with N dose of 321.8 kg.ha-1, because it outperforms the others.
For the present research, P was the third nutrient in banana plant accumulation, a result which was considered out of the ordinary because most of the reported research, indicates as the last macronutrient in levels of plant accumulation. This effect is explained by the fact that the banana plant can continue to take P after flowering, and accumulate it in the storage organs as corm and pseudostem, respectively (Soto, 2001).
Calcium and magnesium content
The result of the statistical analysis is similar to the previous nutrients, whereas the graphical interpretation (Figures 5, 6), shows for both nutrients, a similar behavior for all treatments until fructification without predominance of any N dose, but when performs an increased harvest timing, its accumulation with N dose of 483 kg.ha-1, constitutes the best dose in accumulation of Ca and Mg at the end of the banana yield cycle.


Ca, was the nutrient which showed higher accumulation levels with respect to Mg, but as above mentioned, were overcome by P, showing an unusual behavior. When contrasting the accumulation order of these two nutrients, with the reported by Castillo et al. (2011), coincidence is found, it is important to emphasize that these two nutrients were fertilized like P and K.
As mentioned, there were no significant differences in treatment responses, showing little variation among them in the accumulation processes of N, K, P, Ca and Mg, respectively. Given these concerns, as a result of the graphical interpretation, the expression of treatments with N dose of 321.8 and 483 kg.ha-1 for nutrients mentioned during the different plant development stages, especially flowering, fructification and harvest. On the other hand, in this research, the mentioned treatments achieved the highest yields, being the N dose of 483 kg.ha-1, which obtained the highest values for the two productive cycles (41 and 46 t.ha-1, respectively).

