


 English (pdf)
 Article in xml format
 Article references
 Send this article by e-mail
 Cited by SciELO
  Cited by Google
  Similars in
SciELO
Similars in
SciELO  Similars in Google
 Permalink
Introduction
Bogotá is the fourth most populated and largest capital city in South America, with an urban population of 7,8 million (as of 2021) (DANE, 2020) and a great infrastructure demand. In the last five years, the city administration prioritized two projects to improve mobility and provide a solid transport system: i) the integration of the bus rapid transit (BRT) system with public buses, and ii) the construction of the first metro line (hereinafter referred to as BML1). Despite the economic and social costs of traffic congestion and more than US$45 million spent in the last eight contracts on the analysis of an urban mass transit system, Bogotá still lacks a reliable transit service. According to a study on the future impacts of traffic jams due to time lost, Bogotá ranked first in the Top 5 of global congestion impact ranking in 2018 (Read and Kidd, 2019), which is shown in Table 1.
Table 1 Top 5 most congested cities in the global congestion impact ranking

Source: Read and Kidd (2019)
Fenalco (2014) studied the cumulative cost of traffic congestion for Colombia in the 2013-2030 period, for which they estimate gridlock costs of US$3,9 billion. They classified congestion costs into direct costs, such as the value of fuel and the time spent in traffic and not at work; and indirect costs, where higher freighting and business fees from company vehicles idling in traffic are passed on as additional costs to household bills (Cebr, 2014). In addition to these already occurring congestion costs, future congestion costs resulting from the current BRT system must be considered. The capacity of the BRT system used in Bogotá is 45 000 passengers per hour per direction (pphpd), whereas the capacity of a metro system falls in the range of 60 000-80 000. In order for the BRT system to match the efficiency of a metro system, the city would need to invest in additional BRT lanes. The problem with adding more BRT lanes is that there is not enough space in the city to accommodate them without affecting the traffic of privately-owned cars, which results in an increase in the cumulative cost of traffic congestion.
This research aims to develop a model that is able to predict ground settlements caused by shield tunneling in Bogotá for future metro lines. Major advances have been made in shield tunneling, particularly with the introduction of the pressurized face type, which allows tunnels to be built in all types of soils. This includes recent advances on EPB (earth pressure balance) and BSS (bentonite slurry shield) operation and control, particularly under difficult ground conditions. Developments related to shield tunneling technology have been reviewed by Clough (1993), Fujita (1989), and Béjui and Guilloux (1989).
The model was built based on information and data from the BML1, including a precise analysis of ground conditions (soil parameters and water presence), location, and other aspects of construction (tunnel diameter and depth). Unlike a regular analysis, where a deterministic simulation based on known inputs is first used and a probabilistic study is then applied to provide realistic estimates and confirm the validity of the outputs, this study proposes building a statistical model that aims to provide the best inferences needed as inputs for the deterministic analysis.
Overview of metro plans
Cities like London, Madrid, Shanghai, México DF, and Bogotá share a common feature: a soft soil medium beneath their ground (Sainea-Vargas et al., 2020; Melis-Maynar, 1998; Ding and Xu, 2017). Bogotá's metro has been planned for over 70 years, but political issues and funding are the main reasons why citizens are still waiting to ride the first metro line (Figure 1). Table 2 lists some features of the four main studies that have been conducted for the BML1. Although these four proposals had different alignments, the proposed average length is 23,44 km. The estimated costs differ on the length and construction method; the lowest cost was US$1,96 billion of at-grade and cut-cover stations, and the highest cost was the earliest, proposed in 1981 with a combination of elevated, at-grade, and underground stations.

The feasibility study conducted between 2013 and 2015 for an underground metro line was significantly more detailed than the former. The detail-design phase reached 80% completion, whereas the others only reached the conceptual design phase. The estimated cost was 9,42% higher than the budget approved by both local and national governments, and therefore the project was never executed.

In 2016, the city administration carried out a comparative study between the different construction alternatives in order to quantify and assess costs (Contraloría de Bogotá, 2019). The results suggested building an elevated metro line due to the decrement of initial costs compared to the underground option proposed in 2014. Although this cost estimation was based only on conceptual designs, the international bidding to design, build, operate, and maintain the future metro line 1 was awarded for a US$5,16 billion contract.
Normally, the cost ratio for elevated vs. underground systems is approximately 1/2,5 (ITA-WG13, 2004). In the case of the BML1, the cost ratio of these two alternatives differs in the number of stations and trains, the length, BRT additions, and the design stage. However, from the overall cost of the two proposals, the cost ratio for elevated vs. underground systems can be calculated as 1/2,3. As shown in Figure 2, the proposal for an elevated line included 15 stations with a total length of 24 km, compared to an underground option of 27 stations within 27 km. The estimated construction cost of all 27 underground stations was US$2,14 billion, whereas the cost of the elevated stations was US$0,41 billion (Contraloría de Bogotá, 2019). Thus, the cost ratio of elevated vs. underground stations is approximately 1/2,8.

Source: Adapted from Contraloría de Bogotá (2019)
Figure 2 Key features of the BML1: a) underground metro line and b) elevated metro line
Methodology
The computational model is briefly divided into three stages: (1) the definition of stratigraphic soil profiles along the alignment of the BML1 via a statistical analysis of geotechnical data; (2) an approach to an optimal tunnel system suitable for Bogotá; (3) the collection of computational results by means of a numerical model which can approximate the real conditions to the model parameters with the aim of estimating the ground movements induced by shield tunneling. The software RStudio was used to analyze the data obtained from geotechnical investigations of each section of the alignment.
The deterministic model was built using PLAXIS2D, a twodimensional finite element code.
Statistical analysis
Geological, geotechnical, and hydrogeological investigations are the backbone of a baseline geological report. Previous experience in metro projects has shown that having a substantial amount of geotechnical investigation and using adequate methods with scientific accuracy can reduce construction costs and lower the risks. Therefore, laboratory and field testing (CPTu, SDMT, PMT, and geophysics) were performed on the BML1's alignment from 2013 to 2015 (Figure 3). The geotechnical data were collected within 0 to 50 m in depth and uploaded to an online open-access platform (IDU, 2013). Unfortunately, there were no stratigraphic profiles developed along the alignment, and the extensive laboratory data was not organized or verified. In order to get the stratigraphic profiles needed to conduct this study, a statistical analysis was carried out. This process is shown in Figure 4.

Source: Adapted from Consorcio L1 (2015) and Alcaldía Mayor de Bogotá (2010)
Figure 3 Field geotechnical tests along the BML1's alignment

A statistical hypothesis is an assumption about a population parameter, which may or may not be true. Hypothesis testing is used to accept or reject a sample based on its consistency. There are two types of statistical hypotheses (null hypothesis Ho and alternative hypothesis H1), as well as a region of acceptance α. For example, the hypothesis formulation used to analyze the values of the friction angle is described using the expression in Equation (1). Where μ can be equal to 35°, 32,5°, 30°, 25,5°, 24,5°, 23,5°, 22,5°, 17°, 16°, 15°, or 10° depending on the soil type to be tested, within a region of acceptance of 0,5°. The statistic used is described using Equation (2).

To analyze the laboratory data obtained from each section of the alignment, a statistical model was built by means of confidence intervals and t-test hypotheses via the RStudio software. The essential soil parameters that describe the deformation characteristics, strength, initial state, plastic, and elastic behavior of soils were studied, i.e., friction angle, Poisson ratio, cohesion, modulus of deformation, and unit weight of the soil. The total length of the first metro line was divided into four sections (Table 3). This study presents the results obtained for Section I after analyzing the data obtained from 81 boring tests and 67 piezocone penetrations.
Proposed tunnel design
An optimal design for a subway tunnel satisfies the construction safety, operation, and maintenance requirements with a cost-benefit analysis. A diameter of 6,5 m was used in this study, referencing Shanghai's subway tunnels. However, the final values shall be decided by the owner of the project. The authors proposed two single parallel tubes for the Bogotá subway system. The clearance distance between them is discussed below.
Groundwater levels: The average water level value was defined from data analysis of in situ measurements, and it was also verified with values found in the literature review (Consorcio L1, 2015). The groundwater table for Section I is shown in Figure 5.


Overburden: the ideal condition is to excavate throughout the most favorable strata. According to tunnel design guidelines (ITA, 1988), the overburden of shield tunnels shall be greater than 1,5-2 times the diameter of the shield machine. Two scenarios were modeled in order to compare the feasibility of subway construction based on studies about the prediction of surface settlements and parallel tunnels interaction (Hossaini et al., 2012) (Table 4). This method can be used if i) the depth and tunnel diameter ratio is greater than 1,5, and ii) the distance between one tunnel center and the other is equal or greater to 1,3 D. The factors considered in each modeling scenario are the ratio of tunnel depth (z) and diameter (D), the clearance between parallel tunnels (center-center) d/D, and the water level.

Numerical analysis
Nowadays, almost every tunneling project requires numerical modeling in order to predict ground movement and behavior at ground surface in response to tunneling. PLAXIS 2D is one of the finite element programs that are commonly used in geotechnical applications to calculate deformations and stability. It considers both, construction and ground conditions (geometry, initial stresses, ground behavior, excavation stages, etc.). This software was available to compute the estimated ground response to tunnel excavation during this research. Both, settlement curves after excavation and the consolidation phenomenon were analyzed.
According to the conditions described below, the elastic-plastic MC model was used as a primary approach to calculate the settlements induced by tunneling for Section I. When soil parameters meet a sufficient condition, the results from the deterministic analysis are viable in terms of the inputs, which are good enough to make the outputs reliable. The excavation of two parallel shallow tunnels for the BML1 is expected from Portal de las Américas to Primera de Mayo (Section 1). It includes six stations with a total length of 6 667 m, mainly passing through stiff clay.
Lining inputs were selected according to the assumed tunnel diameter of 6,5 m. Six-plate elements of 0,35 m in thickness were connected to simulate one ring. Table 5 shows the properties of the segmental lining used for this model. The simulation in PLAXIS2D also allows for a staged construction mode by defining different calculation phases. In addition, time-dependent deformations can be calculated during consolidation. The calculation phases for this study were:
Phase 0. Initial phase
Phase 1. Excavation of the first tunnel (left side, referred to as LT) and lining installation.
Phase 2. Excavation of the second tunnel (right side, referred to as RT) and lining installation.
Phase 3. Consolidation analysis up to 365 days.

Results and discussion
Data obtained from the statistical analysis
The results obtained are of great value, not only for this research, but also for future studies on the behavior of Bogotá's soil. The values obtained to build the stratigraphic column of Section 1 (Table 6) were compared with data gathered from other projects in order to verify their reliability. These values were used as soil layer inputs of the numerical model (Figure 6).


Numerical analysis
The soil values obtained were entered in the model, and the geometry of the mesh was built. The water table remains at -3 m (being the surface at 0 m) in both scenarios for Section I of the alignment. The geometry of the mesh also remains the same; only the position of the tunnel in the x- and y-directions changes for each scenario (Figure 7).

Vertical displacements: In the first scenario, the maximum surface settlement induced by the excavation of the two parallel tunnels is 8,96 mm. The excavation of the RT is expected to start once the construction of the LT has finished. Therefore, the immediate displacements will have already occurred, and they will have no influence on the excavation of the RT. The cumulative surface settlements induced by the excavation of both tunnels for Scenario 1 is estimated to be 8,96 mm. The heave of the surface is estimated to happen with a maximum value of 0,29 mm in a range of 4050 m away from the tunnel axis in the x-direction (Figures 8 and 9).

The same procedure and assumptions were applied for Scenario 2. The maximum surface settlement estimated by the excavation of the two tunnels was 7,87 mm. The heave of the surface is a common phenomenon during tunneling, which is due to the stresses released from excavation. In this scenario, the maximum heave is greater than the one in Scenario 1, with a value of 0,53 mm. The soil moves upwards in a range of 0-40 m from side to side from the middle point of each tunnel, which, in the model, corresponds to the coordinates (x=0, y=100) (Figures 10 and 11).


Source: Authors
Figure 12 Consolidation analysis: a) deformed mesh for Scenario 1, and b) vertical displacements for Scenario 2
Consolidation analysis: A consolidation analysis was performed (Phase 3) to evaluate the development or dissipation of pore pressures as a time function. This elastoplastic consolidation analysis was made possible by the features of PLAXIS2D. The maximum vertical displacement for Scenario 1 was 3,16 mm whereas the maximum value for Scenario 2 was 172,68 mm (Figure 12b).
Discussion
Surface settlements: The results show that the excavation depth of tunnels affects the deformation of the soil (Table 7). The heterogeneity of the subsurface plays a key role in the primary and secondary consolidation, so the behaviour of soils shall be carefully studied to choose an appropriate excavation depth. For example, in Scenario 1, the immediate settlements are slightly higher than those of Scenario 2, but the estimated secondary consolidation is significantly smaller than that of Scenario 2. This could be explained by the characteristics of the crossing layers: soft soils have low hydraulic conductivity, which means that consolidation processes in sands happen much faster than in clays.

Secondary consolidation: Although the consolidation values for Scenario 1 are lower, it is important to acknowledge that consolidation in clays will continue to happen over a long period. Secondary consolidation would mainly affect the settlement of the tunnel structure. Liao et al. (2011) and Cui et al. (2015) studied the cumulative settlement of Shanghai's Metro Line 1 during the 1995-2009 period. The maximum and minimum cumulative settlements were 287,8 mm and 5,8 mm, respectively, according to in-situ monitoring data of the Metro Line 1 in Shanghai (Cui et al., 2015). It is worth mentioning that the maximum allowed settlement value for construction of underground metro lines in Shanghai is 20 mm. There, the subsoil can also be characterized as low strength soft soil with friction angles in the range of 8,516,9°. Numerical analysis showed cumulative settlements lower than 10 mm induced by the excavation of two parallel tunnels at different depths and tunnel clearance. Thus, shield tunneling in Bogotá soil is viable.
Grant and Taylor (2000), Wilson et al. (2011), and Sahoo and Bibhash (2019) numerically and experimentally studied the support pressure of circular tunnels in cohesive soils and the effect of an overlying sand layers on the stability of tunnel excavation in the lower clay layer, as it is the case of the BML1. These studies can be used to decide the thickness and stiffness of the lining required to support the surrounding soil for the BML1.
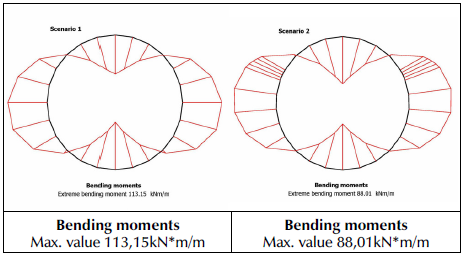
Forces acting on the lining: The performance of the lining is considered as a whole system, whose ultimate goal is to provide an overall stability of the opening. As for the tunnels excavated in soft ground by shield machines, segmental lining should maintain the structural integrity of the excavation opening as the shield moves forward and minimize the immediate movement of the surrounding ground. Larger forces are expected to act on the lining for Scenario 1 because the overburden pressure is higher. These values can be considered for reference by engineers in order to determine the future design of the segmental lining of Bogotá's metro (Figures 13, 14, and 15).


Conclusions
The application of statistical analysis to define the soil characteristics of Bogotá's subsoil gave green light for the numerical analysis to estimate settlements induced by tunneling. An extensive analysis was performed to make use of the laboratory and in situ test results obtained in 2014, which resulted in the stratigraphic profile of the BMLI's first 6,6 km. The numerical analysis showed cumulative settlements lower than 10 mm induced by the excavation of two parallel tunnels at different depths and tunnel clearance. Thus, shield tunneling in Bogotá soil is viable. As in Shanghai, the consolidation phenomenon shall be considered by the contractors of future metro tunnels in Bogotá, with sufficient long-term monitoring of settlements. Throughout the course of this research, the authors found valuable technical facts that can be used for future metro projects in Bogotá, Colombia.

