


 English (pdf)
 Article in xml format
 Article references
 Send this article by e-mail
 Cited by SciELO
  Cited by Google
  Similars in
SciELO
Similars in
SciELO  Similars in Google
 Permalink
I. Introduction
The increase of production costs in the industry, due to the loss of unused raw material has led to the concern of experts who study waste generation from industrial processes. Such concern is sustained by the law of conservation of mass discovered by Lavoisier, which states that the total mass of reacting substances is equal to the mass of products formed in the reaction 1; from this, it is derived that the mass of the matter before the reaction is equal to that of the matter after the reaction. The matter after the reaction will be composed of the final product and wastes. This confirms that minimizing the waste generation increase the production; therefore, Reverse Logistics (RL) appears in order to achieve such minimization.
In essence, RL deals with the recovery and recycling of containers, packaging of dangerous wastes, and also with the processes of return of inventory excess, customer returns, obsolete products, and season inventory 2. Several studies have been conducted in this field, such as 3 that proposed a genetic algorithm to solve the problem of decisions related to the location of treatment plants, collecting and transfer places; 4, which proposed an evolutionary algorithm to solve the NP-hard problem of a remanufacturing net; and 5, which solved the problem of programming ground international transportation with a metaheuristic algorithm. Other studies, focused on mathematical models such as Schrady's (considered the father of the RL models), can be found in the literature; examples of them are 6, which optimized the requests to the repairable item warehouse and to the main supplier; 7, which proposed a model to optimize production and refabrication, and 8, whose model analyzed the optimal expression that the return of items must have.
The problem is that the models do not reflect comparison criteria with other similar models. Even if there were any criterion of comparison, an importance user value for a given model over the rest of the models is not calculated. For a better understanding of these issues, this paper shows an example based on the model (1,R) published by 9, given that this paper revolutionized the RL. This deterministic model allows to find optimal lots of requests to the external supplier and the process of recovery 10. The reason is that when there are N suppliers requiring different conditions, N different models arise. Then, the use of comparison indicators becomes necessary, so that according to a given order of priority, it is possible to determine the proper model based on any criterion of user value (UV) assignment.
In this paper, results and discussion describe algorithms for comparing models, based either on criteria or on numerical methods of high codification complexity. The main result of this paper is a computational algorithm that easily solves the problem of comparison among models through UV assignment by positioning, taking into account that the UV assigned to each model corresponds to the priority set by the user for each indicator.
Therefore, the advantage of the algorithm is that, given a set of N indicators (I1,I2,… .In)with an established priority and a set of M models (m1,m2,... .mM), where a list of N values h corresponds to each m¡, it allows to order the models according to the priority set by the indicators, and at the same time, to calculate a UV for each model that corresponds to the given priority. For that reason, the algorithm is named "Comparison for ordering models based on indicators and UV (COMIUV)."
II. Materials and methods
In order to simplify the understanding of the algorithm, we analyzed the Schrady's model, published in 9, as a case study, for which some indicators with different values for each model have been defined. Furthermore, we simulated and visualized the proposed computational algorithm, and provided the generalized version of the algorithm.
A. Schrady's model, a case study
It is important to highlight that this model does not belong to the area of informatics, but it is reflected in an industrial engineering problem. Therefore, in order to understand the essence of the model and the relation among the indicators proposed herein 9.
Suppose we have indicators (I1,I2,I3,I4,I5,I6) by which Schrady's models (m1,m2,m3,m4,m5) must be compared, and that those indicators have been ordered by an user from greater to smaller priority, resulting in the form (I4,I1,I5,I2,I3,I6). Also, it is known that (I4,I1,I5,I2) are good for the user, which means that the greater their value, the greater the benefit for the user, and that (/3,/6) are bad for the user, that is, the greater their value, the smaller the benefit for the user. As an example, Table 1 shows the distribution of the indicators values for each model.
Table 1 Example of a distribution of values
| M1 | m2 | m3 | m4 | m5 | good | priority | |
| I1 | 22.45 | 33.12 | 09.64 | 54.23 | 45.03 | true | 2 |
| I2 | 0.43 | 0.15 | 0.75 | 0.59 | 0.22 | true | 4 |
| I3 | 77.55 | 66.88 | 90.36 | 45.77 | 54.97 | false | 5 |
| I4 | 3425 | 4526 | 3004 | 6814 | 3024 | true | 1 |
| I5 | 2351 | 964 | 1142 | 857 | 1028 | true | 3 |
| I6 | 5776 | 5490 | 4146 | 7671 | 4052 | false | 6 |
Step 0:Table 1 must be adjusted according to the priority given by the user (Table 2).
Table 2 Matrix of indicators adjusted according to priority
| m1 | m2 | m3 | m4 | m5 | good | |
| I4 | 3425 | 4526 | 3004 | 6814 | 3024 | true |
| I1 | 22.45 | 33.12 | 09.64 | 54.23 | 45.03 | true |
| I5 | 2351 | 964 | 1142 | 857 | 1028 | true |
| I2 | 0.43 | 0.15 | 0.75 | 0.59 | 0.22 | true |
| I3 | 77.55 | 66.88 | 90.36 | 45.77 | 54.97 | false |
| I6 | 5776 | 5490 | 4146 | 7671 | 4052 | false |
Step 1: Conversion of the matrix of value of indicators (MVI) into a vector matrix, where each indicator value per model is transformed by a vector of two components: < B,C > (B is the model identifier, and C is the indicator value for model B; if the indicator is bad for the user, C is assigned - C). The objective is to keep the reference of the values of the indicators for each model after ordering in step 2 (Table 3).
Table 3 Vector matrix of indicators (VMI)
| <m1,3425> | <m2,4526> | <m3,3004> | <m4,6814> | <m5,3024> |
| <m1,22.45> | <m2,33.12> | <m3,09.64> | <m4,54.23> | < m5,45.03> |
| <m1,2351> | <m2,964> | <m3,1142> | <m4,857> | < m5,1028> |
| <m1,0.43> | <m2,0.15> | <m3,0.75> | <m4,0.59> | < m5,0.22> |
| <m1,-77.55> | <m2,-66.88> | <m3,-90.36> | <m4,-45.77> | < m5,-54.97> |
| <m1,-5776> | <m2,-5490> | <m3,-4146> | <m4,-7671> | < m5,-4052> |
Step 2: To move the VMI, six orderings are performed, one for each row of the VMI, so that each row is ordered from greater to smaller, according to the C value of each vector placed in the entry [i][j] (i corresponds to the row, and j to the column, where the first row or column has a value equal to 0). Any ordering algorithm that best suits can be used (Table 4).

After step 2, we are in conditions to define the proper order of the models. Selecting according to the first row is enough, and in case of a tie, the decision will be based on the next row. In this case, the order (m4,m2,m1,m5,m3 )can be observed (Table 4). The problem is that perhaps the intentions do not lead to a simple ordering, but to an assignation of a value to each model, which corresponds to the previous ordering from greater to smaller. At the same time, this value must integrate the positioning of each vector with a value, whose meaning will be named as user value (UV), which must substitute the C value of the vector, so that the total UV (sum of each UV of the vectors corresponding with the model) comply with the desired ordering. In order to achieve the UV assignment in C for each vector, it is necessary, even in the worst circumstances of comparison, to have a proper ordering, that is, the winning model in the worst way (it wins because its indicator of greater priority is the best among all the models, but the rest of its indicators are the worst) is better than the second best model (its indicator of greater priority is the second among all the models, but the rest of its indicators win among all the models); and it is required that equation (1) holds for any entry [i] [/], according to Table 5.


Note that the used logic for this methodology of assigning value to the C component is sustained by a logic ruled provided by the method of "proof by contradiction" or by "strong reduction to an absurdity". If the questioning of a determinable statement is followed by the acceptance and questioning of a statement incompatible with its denial, then the initial statement is accepted 11. If it is possible to assign an UV in C of each vector, such that even in the worst circumstances the model with the indicator of greater priority with greater value still remains the winner, in any other circumstance where the conditions of this indicator of greater priority prevail and the conditions of values in the rest of the indicators become better, the model having this indicator with a greater value will always win.
Step 3: Conversion of the VMI into a matrix of user value (MUV) (Table 6). This step consists in moving along all the entries [i] [j] of the VMI and replacing the C component of each vector with a value that holds the previous condition. In order to achieve this, it is proposed that the C value for each vector, placed in the position [i] [j],be modified according to the following rules (where N is the number of indicators and M the number of models):


Step 4: Finding the UV of each model. After assigning value of the vectors corresponding to each model. The an UV in C for each vector, the total UV corresponding final result of the algorithm is shown in Table 7 and to each model can be calculated as the sum of the C Fig. 1.


B. Computational algorithm: Model ordering based on indicators and user value (COMIUV). Generalized version
In this section, a generalized version of the COMIUV algorithm, proposed here, is detailed, implemented, and tested in the software Ambiens v1.0 for waste management. RL and the selection of the proper model are implemented in this software, according to the priorities given by the user to the indicators for model comparison, where one of them is the Schrady's model (1,R) visualized in the previous example. It is worthy of remark that this generalized version applies to any case of applied models.
Situation: We want to compare M models, taking into account the priority order given by the user to N indicators. At the end, the user value must be set for each model, where the greater UV, the better the model.
Entry: The algorithm entry is a matrix of N rows and M+2 columns, where each entry [i][j] relates the M model to the N values of its indicators. The information about whether the increase of the indicator is good for the user is found in the next to the last column, and the priority of each indicator (row), in the last column.
Step 0: First, the matrix must be adjusted according to the priority given by the user (i.e., ordering the rows from smaller to greater by the priority number, where the smaller the number, the greater the priority), and the last column must be deleted, so that the matrix remains with a dimension of N X (M + 1), N X (M + 1), only with the data necessary for the next steps.
Step 1: Conversion of the matrix of indicators into a vector matrix, where each indicator value per model becomes a vector of two components: B and C (B is the identifier of the model, and C is the indicator value for model B; if the indicator is bad for the user, C is assigned - Q. The vectors would remain as:

Step 2: To move the MVI, N orderings will be performed, one for each row of the MVI, so that each row is ordered from greater to smaller, according to the C value of each vector placed in the entries [i] [j].
Step 3: Converting the MVI into a matrix of user value (MUV) consists in moving along all the entries [i] [j] of the VMI and replacing the C component of each vector with a value that holds condition (1). In order to achieve this, it is proposed to modify the C value for each vector placed in the position [i] [j], according to the following rules (where N is the number of indicators, and M the number of models):
Rule 1: if i = N-1 do (2), else if j = M - 1 do (3).
Rule 2: if rule 1 does not hold do (4).
Step 4: Finding the UV of each model as the sum of the C values of the vectors corresponding to each model. The final result of the algorithm would be an ordered relation, from greater to smaller, among models and their corresponding UV expressed as follows:

III. Results and discussion
There are computational algorithms for comparing models such as Markov chain Monte Carlo (MCMC), which is a general set of techniques for simulated sampling that use distributions achieved through Markov chains, in order to generate independent samples based on the distribution of interest 12; the Metropolis-Hastings algorithm is a general MCMC method for finding a conditional density g(.|θ) or an easily sampled distribution, and then, generating observations of the proposed distribution, in order to decide whether they correspond to the distribution of θ|x 13. Both algorithms depend on using complex numerical methods, which makes their implementation more complex than implementing COMIUV. However, it would be fair to compare COMIUV with other algorithms with similar features, such as entry parameters and main objective.
It is obvious that COMIUV sets a ranking among models. Due to the entry features, models may be seen as objects that can be measured by a number N of indicators. The vector space model (VSM) is a well-known method in the theory of information retrieval that seeks to rank documents, taking into account the weights of the terms found in each document 14. In this case, the similitude to give any ranking solution for this second algorithm lies in that M documents must be considered for evaluation, taking into account N indicators that set the weights of the terms. It is necessary to consider the models as vectors, whose components values are the weights of each indicator. With the values from table 1, the values in Table 8 can be considered as the entry for the VSM.

If the entry is adjusted by the criterion "good", as in COMIUV, multiplying the weights of the indicators that are not good for the user by -1, we obtain the values shown in Table 9.

MVS works with distances between the entry vectors and a desired vector in the search. The priority of the user in the indicators is not considered in the VSM's philosophy. In this sense, it is logical to consider that for the user, it would be optimal to compare with the best possible vector, which is the one with the greater weight achieved for each indicator in each component, named as "query" in the study case. Then, the definitive entry to take into account is:

The resulted VSM ranking after entering these data is shown in Table 10.

Comparing to Table 7, we observe a coincidence in the order of the models m4 and m2, which in the case of COMIUV (Annex 1) were winners in the same order. However, the results corresponding to the rest of the models are different, probably due to the fact that VSM does not take into account the priority of the indicators, because only the ideal vector (query) is of interest to compare the vectors that represent the documents (in this case the models). Table 11 summarizes the comparison between both algorithms.
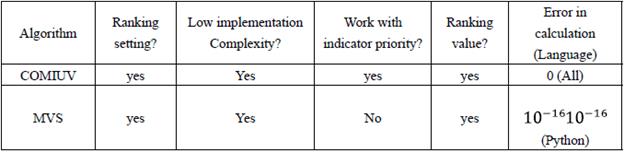
IV. Conclusions
The COMIVU algorithm proposed for model comparison is able to relate levels of priority given by a user to a set of comparison indicators, whose relation materializes in the factor "user value", taking into account the positioning of the vectors. In COMIUV, calculation errors do not occur because it only works with sums depending on the entry data. On the other hand, VSM may have a small calculation error depending on the used programming language, because VSM works with vector distances, where a division by the product of the norms of the compared vectors takes place. Therefore, if the interest is to take into account the priority of the indicators, we suggest using COMIUV, otherwise, if the interest is just to set a ranking, both algorithms are totally useful. The shown COMIUV pseudocode exemplifies its implementation, and the given example illustrate its easy development. The developed algorithm made it possible to set a number named user value (UV), considering that the greater the user value, the better the model. Finally, the proposed algorithm guarantees, as a result, that all models will be ordered with their corresponding UV.

