Introduction
During the last decades, there have been observations dedicated to analyze the morphology of the magnetic field in the solar atmosphere. In the data taken by Hinode (Kosugi et al., 2007), Solar Terrestrial Relations Observatory (STEREO; (Kaiser et al., 2008)), Sun Earth Connection Coronal and Heliospheric Investigation (SECCHI; (Howard et al., 2008)) of the extreme ultraviolet radiation and the X-rays emitted by the Sun, it was recognized the presence of magnetic regions with helicity constituted by multiple entangled threads (Raouafi, 2009). Also, the observations of the mission Time History of Events and Macroscale Interactions during Substorms (THEMIS; (Angelopoulos, 2008)) were used by (Canou et al., 2009) to study the configuration of the Sun before eruptive events, showing the existence of magnetic flux ropes in the solar atmosphere. On the other hand, with the vector magnetograms from the Helioseismic and Magnetic Imager (HMI; (Hoeksema et al., 2014)) on board the Solar Dynamics Observatory (SDO; (Pesnell, Thompson, & Chamberlin, 2012)), (R. Liu et al., 2016) concluded that, for a magnetic flux rope, the twist number, which is the winding of the magnetic field lines, increases before each flare and decreases after the flare peak. Using some images obtained by the New Vacuum Solar Telescope (NVST; (Z. Liu et al., 2014)) on board the SDO, (Bi et al., 2015) presented a partial eruptive filament, showing that the field lines related to the filament are twisted. Besides, from the Interface Region Imaging Spectrograph (IRIS (De Pontieu et al., 2014)) spectra, (Tiwari et al., 2018) found evidence of twisting motion of magnetic fields in the spire of several large penumbra jets. These observations and works establish strong associations between some solar phenomena and the twisted field lines embeded in them.
The twist has become a key ingredient for the simulation of atmospheric features, such as the production of coronal mass ejections using the emergence of a twisted flux rope into the solar corona (Chatterjee & Fan, 2013) and the evolution of twisted loops in the corona that release energy and are capable of heat it (Bareford, Hood, & Browning, 2013). Moreover, (Gordovskyy, Browning, Kontar, & Bian, 2014) found that the evolution of a kink-unstable twisted coronal loop generate fields that can effectively accelerate protons and electrons to energies up to 10 MeV and (Zaqarashvili, Voros, & Zhelyazkov, 2014) produced Kelvin-Helmholtz instabilities with twisted magnetic flux tubes at speeds smaller than the main solar wind stream speed. Also, (Ebrahimi, Karami, & Soler, 2017) investigated the effect of a twisted magnetic field on the evolution of MHD kink waves in coronal loops, showing that even a small amount of twist can have an important impact on the process of energy cascading to small scales and (Terradas, Magyar, & Van Doorsselaere, 2018) observed how the twist affects the development of shear instabilities and modifies the properties of the eigenmodes of magnetic tubes. In addition, (Knizhnik, Linton, & DeVore, 2018) showed that the photospheric manifestations of the emergence of highly twisted flux ropes closely match the observed properties of δ-spots, which are the most favorable configurations for producing energetic flaring events.
The aim of this work is to study, through several 3D ideal MHD simulations, the effect of the twist on the amplification of the magnetic field and the Poynting vector flux in the photosphere and the lower chromosphere. In particular, we compute the magnetic field amplification as a function of time, for different twist parameters that are included in the initial perturbation. Additionally, we calculate the maximum of this amplification as a function of the twist, finding an exponential behavior for each magnetic field value. With this purpose, in the first section we introduce the MHD equations with the equilibrium state, the initial and boundary conditions, and the numerical methods we used. Then in the second section we present the results, both qualitatively and quantitatively, together with a trend in the maximum field amplification in terms of the amount of twist. Finally, in the third section we present the discussion and main conclusions of this paper.
Linearized MHD Equations
In order to simulate the plasma dynamics in the solar atmosphere, we evolve the linearized ideal MHD equations, which are written as follows
where p denotes the mass density, V the velocity, P the gas pressure,
 =(0,0, -274) m s-2 the acceleration of the gravity, J0 the permeability of free space,
 the electric current (
 = ∇ x
= ∇ x
 /μo),
/μo),
 the magnetic field and ү = 5/3 the adiabatic index. The subindex 0 and 1 denote the variables in the static equilibrium state and the perturbed variables, respectively. Assuming an analytic model for the temperature at the initial state, we numerically solve the system of equations (1-5) using MAGNUS (Navarro, Lora-Clavijo, & Gonzalez, 2017), which if is derived from CAFE (Lora-Clavijo, Cruz-Osorio, & Guznran, 2015) code. Particularly, MAGNUS has been used to simulate the emergence of a plasma blob into a solar coronal hole (Navarro, Murawski, Wojcik, & Lora-Clavijo, 2019) and also to study the effects of thermal conduction on the formation of chromospheric solar tadpolelike jets (Navarro, Lora-Clavijo, Murawski, & Poedts, 2021). Additionally, a significant parameter in the study of wave propagation in a plasma is the beta plasma, which relates the fluid pressure to the magnetic pressure through the following expression
being equivalent to a relation between the volumetric density of thermal and magnetic energy. It is noteworthy that this parameter allows us to measure how magnetized is the plasma in each region of the solar atmosphere and lets us distinguish between the layers of the solar atmosphere: in the photosphere and chromosphere, thermal energy is dominant (β > 1), then β ≈ 1 in the transition zone, and for the solar corona, the magnetic energy controls the fluid (β < 1); this agrees with the results presented by (Mariska, 1986) about the transition region.
Features of the model
An equilibrium state corresponding to a quiet Sun is proposed, i.e., without taking into account any of its transient phenomena, by including an approximate temperature profile and obtaining the density and pressure profiles. Additionally, the magnetic field of the equilibrium state is uniform
 = (0,0,B
0
), where B
0
is its magnitude and for this work in particular, we use three specific values: 40 G, 50 G and 60 G. These values of the magnetic field are based on the analysis of observations obtained with the spectropolarimeter of the telescope THEMIS in quiet regions of the Sun (Bommier, Derouich, Landi Degl'Innocenti, Molodij, & Sahal-Brechot, 2005). In order to study the propagation of the torsional Alfvén waves which spread in the solar atmosphere, the initial state is perturbed by a gaussian pulse in the velocity field, which can be caused by p modes (Jain, Gascoyne, & Hindman, 2011). The p modes are a mechanism to excite MHD waves when they impacts with a thin magnetic flux tube.
Equilibrium State
A commonly analytical profile of the temperature for a quiet Sun is described by the following expression
where Tcor = 1.2 x 10⁶ K is the temperature in the solar corona and Tphot = 6 x 10³ K the temperature in the photosphere, which are separated by the chromosphere and the transition region, its thickness and position are related to the parameters z w = 0,25 Mm and z t = 2.7 Mm.
The temperature, pressure and density in the equilibrium state are related by the following expressions
being these, the equation of state for an ideal gas and the equation of hydrostatic equilibrium for a force-free field (Wiegelmann & Sakurai, 2012) respectively, where K B is the Boltzmann constant and m p the proton mass. The expressions of pressure and density can be written as
where z0 = 0 Mm is the photosphere base and P 0 = 24.8 Pa the pressure at that height.
Initial and Boundary Conditions
The initial configurations correspond to the perturbations of the equilibrium state previously described, the perturbations for the mass density, gas pressure and the components of the magnetic field are zero. Instead, for the velocity field components, we have used a perturbation that is transversal to the propagation direction (ez) which are related to the generation of torsional Alfvén waves and other waves along the direction of propagation, following (Murawski, Solov'ev, & Kraskiewicz, 2015). The model is a gaussian function in the three components of the velocity field, with width σ = 0.1 Mm and center in (0,0,0.3) Mm
where A represents the amount of twist, which takes the values displayed in Table 1, A x = A y = 100 km/s are the amplitudes of the gaussian function in x and y direction respectively, and A z = 3 km/s is the corresponding amplitude along the z direction. As A z «ti A x and A z « A y , the main effect on the system comes from the transversal components of the perturbation.
Table 1 Values of twist in each case, A is related to the amplitude of the perturbation in the xy-plane.

The boundary conditions at the top and bottom of the numerical domain, are implemented by fixing in time all plasma quantities to the equilibrium values, i.e., the variables does not evolve in those sides. On the other hand, outflow boundaries are implemented in the remaining four surfaces of the numerical domain (Murawski, Ballai, Srivastava, & Lee, 2013).
Numerical Methods
The equations are solved with a module implemented in the MHD code MAGNUS (Navarro et al., 2017), for the linear regime. In order to guarantee the condition of absence of magnetic monopoles, the Flux Constrained Transport method is implemented (Evans & Haw-ley, 1988). The numerical domain of the simulation was [-0.5,0.5] Mm x [-0.5,0.5] Mm x [0,3] Mm, with a grid of 50 x 50 x 150 points, with spatial resolution of 20 km, uniform in the three directions.
Results
Morphology
The qualitative analysis of the results was made through an intensive study of the morphology of the plasma velocity and magnetic fields. Figure 1 shows the velocity vectors for two values of Λ at two different times, where the propagation modes are displayed moving upwards and downwards, that behave like twisted lines of the velocity field. For Λ = 0.0125 at t = 80 s (top left panel) and Λ = 2 at the same time (top right panel) the upwards propagating waves reach the lower chromosphere at z ≈ 0.7 Mm and the ones moving downwards are close to the boundary, at z ≈ 0.2 Mm. For Λ = 0.0125 at t = 140 s (bottom left panel) and Λ = 2 at the same time (bottom right panel), the upward modes reach the center of the chromosphere at z ≈ 1.2 Mm and the downward ones almost disappear of the domain. The morphology is similar for different values of Λ at the same times, but it is noticeable that the magnitude of the velocity field increases when the value of the twist is bigger. These values of the speed are consistent with those observed in a torsional Alfvén wave propagating at the coronal heights (Kohutova, Verwichte, & Froment, 2020).
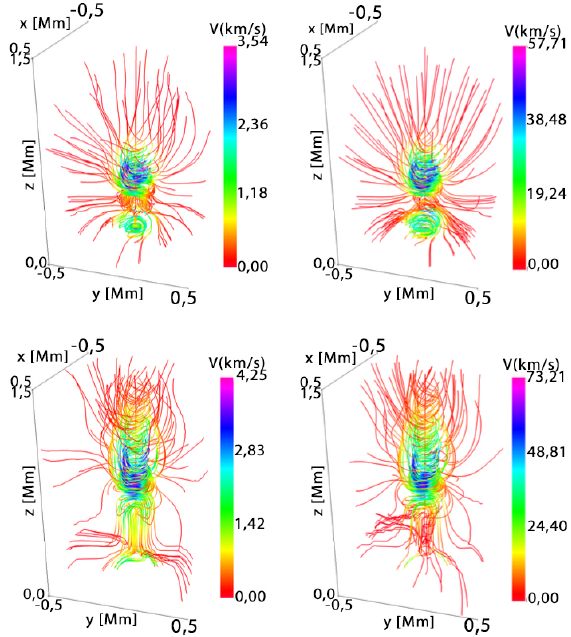
Figura 1 The left (right) column displays the velocity field lines for Λ = 0.0125 (A = 2), at t = 80 s (top) and t = 140 s (bottom) for B 0 = 40 G. The units of the axes x, y and z are in Mm.
The magnetic field lines are displayed in Figure 2, there are magnetohydrodynamic and torsional waves propagating along the +z direction and -z direction for two values of A and at two moments of time. For Λ = 0.0125 (left column) the field lines have some torsion but are not as twisted as in the case of Λ = 2 (right column), also it is noteworthy that the magnitude of the magnetic field for Λ = 2 is approximately one order of magnitude greater than for the smaller twist, in some places. For Λ = 0.0125 at t = 80s (top left panel) and Λ = 2 at the same time (top right panel), the moving upwards waves reach the lower chromosphere z ≈ 0.6 Mm and the downward ones are near the photosphere at z = 0.2 Mm. For Λ = 0. 0125 at t = 140 s (bottom left panel) and Λ = 2 at the same time (bottom right panel), the upwards modes get higher, close to the center of the chromosphere, at z ≈ 1.0 Mm, and the downward ones are in the lower photosphere, at z ≈ 0.1 Mm. A similar morphology was presented by (Murawski, Chmielewski, Zaqarashvili, & Khomenko, 2016), showing that the magnetic field twists by implementing a driver with twist in the azimuthal component of the velocity.
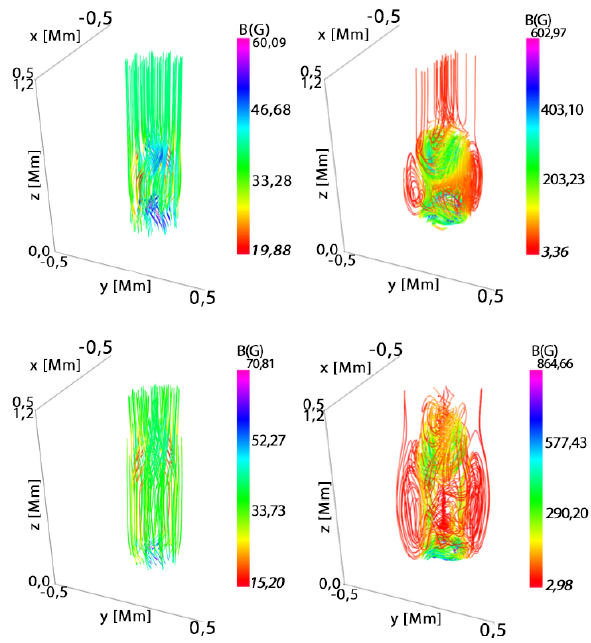
Figura 2 The left (right) column displays the magnetic field lines for Λ = 0.0125 (A = 2), at t = 80 s (top) and t = 140 s (bottom) for B 0 = 40 G. The units of the axes x, y and z are in Mm.
Analysis
To guarantee the preservation of ∇
.
 = 0 numerically, the maximum of the divergence of the magnetic field for the whole numerical domain in each step of time, until t ≈ 170 s, is shown in logarithmic scale in Figure 3 for B0 = 40 G, B0 = 50 G and B0 = 60 G, where it can be noticed that they are below 10-19 T/m in all cases.
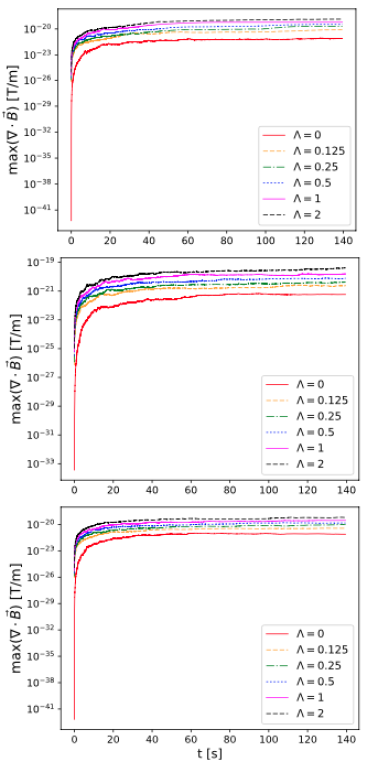
Figura 3 Maximum value of the divergence of the magnetic field for each value of Λ with B 0 = 40 G (top), B0 = 50 G (center) and B0 = 60 G (bottom) as a function of time.
Figure 4 shows the y-component of the field in the plane xz with y = 0 Mm for the particular case Λ = 2 and B 0 = 40 G, at three different times1. At t = 12 s (top row), for the velocity field (left panel) two modes are seen, they are symmetrical but one is positive and the other is negative, that allows the field lines to twist because they have opposite directions, the magnetic field (right panel) has a similar morphology but with four modes. At t = 80 s (middle row), there are two modes of the y component of the velocity propagating upwardly, which reach a height of z ≈ 0.7 Mm and another two modes propagating downwardly. Moreover, for the y component of the magnetic field, there are waves moving downward and waves moving upward, which reach an altitude of z ≈ 0.6 Mm. The bottom row shows the y component of the fields at t = 140 s where it is noticeable that the downward wave is almost gone for both fields, but the upward velocity mode is reaching z ≈ 1 Mm while the magnetic one is near z = 0.8 Mm. The morphology of the vertical planes for both fields is similar to the one obtained by (Murawski et al., 2015), where an initial pulse in the azimuthal component of velocity was launched to excite MHD waves.
The field amplification is calculated as
it shows the behavior of the magnetic field all over the volume normalized to its initial value.
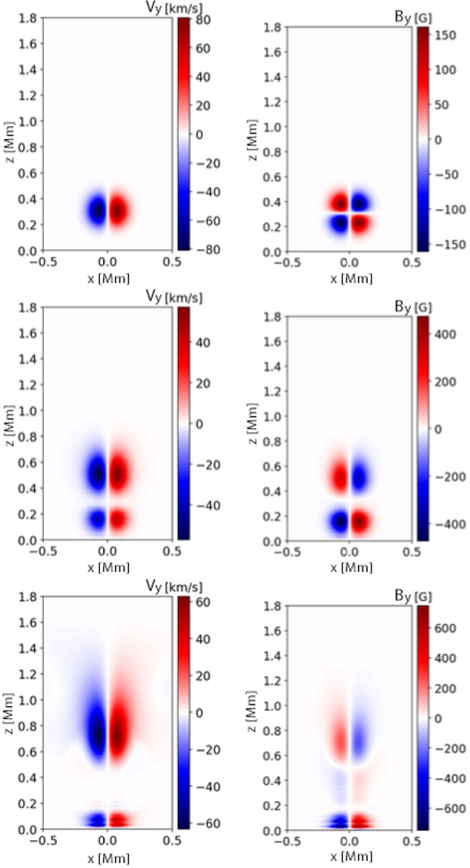
Figura 4 The left (right) column displays the y component of the velocity field (magnetic field) in the plane xz with y=0 Mm at t = 12 s (top row), t = 80 s (middle row) and t = 140 s (bottom row) for Λ = 2 and B 0 = 40 G.
Figure 5 shows that the field amplification is proportional to the twist. For B0 = 40 G (top left panel) when Λ = 2, the field increases in ~ 70% with respect to the initial value, for B0 = 50 G (top right panel) the increase for the same value of A is more than 40% and for B0 = 60 G (bottom left panel), that increase is ~ 30%. There is a noticeable trend, the smaller the equilibrium magnetic field the greater the increase of the field, this is shown in Figure 5 (bottom right panel) for the case Λ = 2. To prove if that assumption is valid for every value of Λ, we calculate the maximum of the amplification in the volume for each value of the magnitude of the equilibrium magnetic field and twist, the results are presented in the Table 2 and plotted in Figure 6.
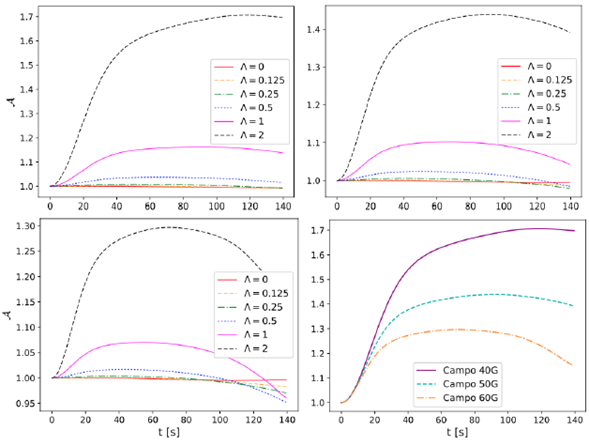
Figura 5 Amplification of magnitude of the magnetic field strength in every time step for each value of Λ for B 0 = 40 G (top left), B 0 = 50 G (top right) and B 0 = 60 G (bottom left). Field amplification in every time step for each magnetic field value with Λ = 2 (bottom right).
The maximum of the field amplification over the entire volume with respect to the twist is shown in Figure 6 (top left panel) for each value of the equilibrium magnetic field.
We made exponential interpolations for each set of data following the form max(
 (Λ)) = b + ne
uΛ
, where the values b, n and u are displayed in the Table 3. The data and the fits are shown in Figure 6 (top right panel and bottom row).
Table 3 Values of the constants involved in the interpolation of the data in the figure 6, following max( (Λ)) = b + ne
uΛ
, with each asymptotic standard error.

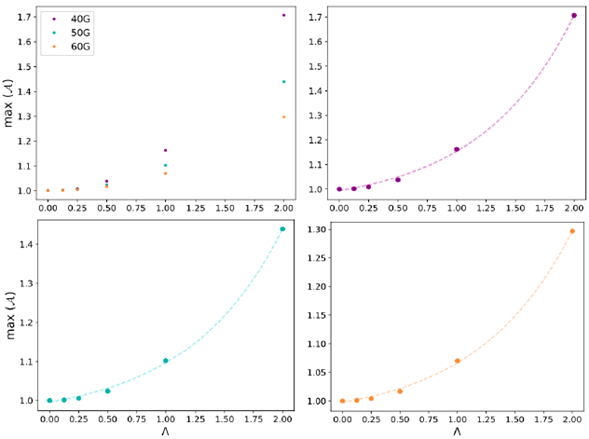
Figura 6 Maximum field amplification for each magnetic field value in terms of Λ (top left panel). Maximum field amplification in terms of A and its corresponding fit for B 0 = 40 G (top right panel), B 0 = 50 G (bottom left panel) and B 0 = 60 G (bottom right panel).
The Poynting flux is calculated as
where d
 = dx dy ê
z
and
 is the Poynting vector calculated as
Figure 7 presents the Poynting flux as a function of the time for the lower chromosphere, at z = 0.5 Mm (left column), the center of the chromosphere, at z = 1.0 Mm (middle column), and for the upper chromosphere, at z = 1.5 Mm (right column), with B0 = 40 G (top row), B0 = 50 G (center row) and B0 = 60 G (bottom row), for each value of Λ. For greater values of the initial magnetic field magnitude, the Poynting flux is larger but its propagation is slower to reach the corona and when the magnetic field is smaller, the energy propagates faster. While it travels along the z-axis, the flux is dissipated because some of that energy is taken to twist the magnetic field lines and because the wave is reaching up layers of the atmosphere with different conditions.
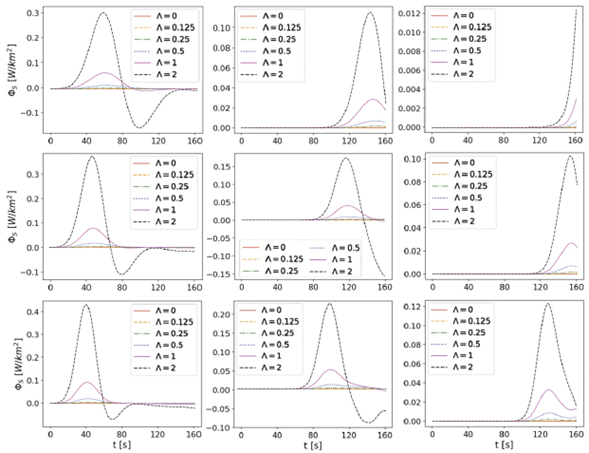
Figura 7 Poynting vector flux along z-surfaces for z=0.5 Mm (left column), z=1.0 Mm (middle column) and z=1.5 Mm (right column), with B 0 = 40 G (top row), B 0 = 50 G (center row) and B0 = 60 G (bottom row), for each value of Λ.
Observations has reveled that torsional Alfvén waves transport around 103 W/m2 to the solar corona, which makes these waves one of the possible sources to explain the coronal heating (Srivastava et al., 2017). On the other hand, the Kelvin-Helmholtz instability transforms the kinetic energy into magnetic one, amplifying the magnetic fields up to a saturation point (Pimentel & Lora-Clavijo, 2019). Then, by magnetic reconnection, the magnetic energy begins to decrease in such way that the kinetic and thermal energies increase the amount of energy that is transported by the torsional Alfvén waves to the upper layers of the solar atmosphere (Zhelyazkov, 2015). However, in this work, the system of equations is linearized and it did not allow the simulations to develop and handle instabilities, such as the Kelvin-Helmholtz instability, this limitation explains the small values of energy registered by our simulations.
Discussion and Concluding remarks
We made several simulations in order to find the influence of twisted velocity field in the evolution of a perturbation in the solar atmosphere. With that aim, we imposed an equilibrium background made of stratified temperature, gas pressure and mass density, together with an uniform magnetic field and acceleration of the gravity. This background was perturbed with gaussian functions for the velocity, along the direction of propagation and torsional in the transversal direction of propagation to excite torsional Alfvén waves. To solve this characterized problem, we evolved the ideal MHD equations in the linear regime already perturbed, with the code MAGNUS.
We studied the morphology of the velocity and magnetic fields, and evidenced the twist in their lines. Also, we computed the field amplification as a function of time, noticing an increase in magnetic field strength with the amount of twist, and a stronger field amplification for smaller values of equilibrium magnetic fields. For the specific case of B 0 = 40 G and Λ = 2, the amplification is near 70% of the initial field. We compute the maximum field amplification as a function of the twist parameter, finding that for each equilibrium magnetic field, it follows an exponential function. Moreover, we calculated the Poynting vector flux through z-surfaces, concluding that the flux was greater for larger values of twist and more intense equilibrium magnetic fields. Finally, we showed that the maximum of the divergence of the magnetic field in all the domain of the simulation, is always bellow 10-19 T/m.
It is worth mentioning that this work is limited by the linear regime of the equations. Also, the equations corresponds to the ideal magnetohydrodynamic ones, which avoid the effects of several sources, such as ohmic resistivity, heat flow, among others. In future works, we will consider more longer simulations, in such a way that the waves could propagate through all the layers of the solar atmosphere until the corona. Moreover, these simulations will be carried out with the non linear MHD equations and using different sources to evidence the effect of each one in the morphology of the velocity and magnetic fields and the propagation of the Alfvén modes through the solar atmosphere.


