


 English (pdf)
 Article in xml format
 Article references
 Send this article by e-mail
 Cited by SciELO
  Cited by Google
  Similars in
SciELO
Similars in
SciELO  Similars in Google
 Permalink
1. Introduction
The Qinling orogenic belt is located at center China, between the South China and North China blocks (Fig. 1a). It is at a key tectonic position, been considered as a composite orogenic belt, formed by the collision of the South China and North China blocks (Mattauer et al., 1985; Sengor, 1985; Zhang, 1985; Ren et al., 1986; Hsu et al., 1987; Zhang et al., 1987, 1989; Enkin et al., 1992; Kröner et al., 1993; Li et al., 1993; Okay and Sengor, 1993; Ames et al., 1996; Zhang et al., 1996a; Hacker et al., 1998; Meng and Zhang, 1999; Faure et al., 2001; Zhang et al., 2001; Ratschbacher et al., 2003, 2006; Dong et al., 2011a,b,c, 2012a,b; Bader et al., 2013a,b; Dong et al., 2013; Li et al., 2015; Dong et al., 2016). Qinling orogenic belt has preserved a lot of kinematic evolution records of long-term multiple stages subduction and collision between the South China and North China blocks, as well as tectonic records of overthrust thrusting, strike-slip regulation, extensional collapse, been a good region for studying orogenic tectonic process.

Figure 1 Schematic map of the research area. (a) The large-scale structural units sketch within China (Zhang et al., 2001). (b) The Bashan Arc thrust nappe structure (Dong, et al., 2008). (c) The regional scale structural sketch within the research area (Zhang et al., 2001).
The Dabashan thrust nappe structure is one of major characteristics of Qinling orogenic belt. It is located between Hannan and Shennongjia-Huangling terranes (Fig. 1b,c), as a part of the southern margin of South Qinling thrust nappe structure (Fig. 1a, Dong et al., 2008; Shi et al., 2013). The Dabashan thrust nappe structure is suggested as the result of the subduction collision between North China Block and Yangtze Block combined Mesozoic-Cenozoic intracontinental orogeny of Qinling orogenic belt (Fig. 1a, Zhang et al., 2001; Ratschbacher et al., 2003; Wang et al., 2003; Dong et al., 2008). It’s geological and geodynamic evolution has been one of research hotspots over the past decades, lots of study results have been reported in this area (e.g. Cai et al., 1988; He et al., 1997, 1999; Zhang et al., 2001, 2010; Wang et al., 2003; Dong et al., 2005, 2006, 2008, 2011; Li et al., 2006; Liu et al., 2006; Wang et al., 2006; Shi et al., 2007, 2012, 2013; Tan et al., 2007; Hu et al., 2009, 2012).
The Bashan Arc is one of key factors to understand the geodynamic evolution of the Dabashan thrust nappe structure. There are different evolution models about Bashan Arc. Jiang et al (1982) emphasizes the similar shape and structure between the Bashan Arc and the Himalayan Arc and believes that the intruding of Hannan and Huangling terranes together with the lateral movement are the main geodynamic condition of the Bashan Arc. Xu et al (1988) points out that the southward huge thrust and detachment shear of South Qinling is the main geodynamic condition while Hannan and Huangling terranes play roles of baffles. Zhang et al (2001) and Wang et al (2003) think that the subduction from south to north of the Yangtze Block may also play an important role within the Bashan Arc.
Dong et al (2008) suggests that Yanshanian intracontinental overthrusting from south to north developed the Bashan Arc. Zhang et al (2010) and Wang et al (2011) estimate that the pre-formed Chengkou-Fangxian fault is the key controller to Bashan Arc. He et al (1997) proposes an extrusion shear model that stresses the importance of the dextral shear in the Dabashan area. In additional, durative compression model (Cai et al., 1988), slip layer controlling model (Li et al., 2006; Liu et al 2006), bulldozer model or progressive squeeze weakened model (Luo et al., 2007), two phases model (Dong et al., 2006) are also suggested.
Despite many studies reported within this area, there are still disagreements on below issues: 1) is there dextral strike-slip around the Bashan arc fault? How it formed and effected on the evolution of Dabashan thrust nappe? 2) Did Shennongjia - Huangling and Bikou terranes play a role of “rigid anchor” in the formation of the Dabashan thrust nappe? 3) Did collision between Yangtze and North China blocks cause clockwise rotation within Dabashan area, and how that effect the formation of Dabashan thrust nappe? This paper presents a numeric modelling using Fast Lagrangian Analysis of Continua algorithm (FLAC) to analyse the geodynamic evolution of the Dabashan thrust nappe and the formation of the Bashan Arc, and mainly focuses on above issues.
2. Tectonic setting
The Dabashan thrust nappe structure is at the northeastern of the Sichuan basin and the northwestern of the central Yangtze block (Zhang et al., 2010, Shi et al., 2013), characterized as an obvious southwestward arc and distinguished with the Qinling-Dabie orogenic belt (Fig. 1b, Zhang et al., 2001; Dong et al., 2006, 2008, 2013; Shi et al., 2012, 2013). The Dabashan thrust nappe structure can be divided into Southern and Northern Dabashan tectonic units which are evidently different (Fig. 1c, Zhang et al., 2010; Shi et al., 2012, 2013), the Northern Dabashan tectonic unit shows NW-SE direction while Southern Dabashan tectonic unit spreads as arc shape and displays features of two stage overprint (Dong et al., 2008). From view of lithology, the Southern and Northern Dabashan tectonic units are also distinct (e.g. Middle Proterozoic Shennongjia Group, Sinian Nantuo-Doushantuo-Dengying formations, Cambrian sandstone-shale-carbonate for Southern Dabashan unit while Middle-Neo Proterozoic Wudang Group and Yunxi Group, Neoproterozoic Yaolinghe Group, Cambrian slate-carbonate for Northern Dabashan unit and so on), they belong to different origin sources and were overlaid by southward thrust nappe movement (Dong et al., 2008).
The Northern Dabashan unit consists of a few thrust nappes with multiple levels and different scales that stacked southward and mainly characterized by series of NW-SE faults and folds. The main structural trend is about 290°~300º paralleling to that of Qinling. The southern front of the Northern Dabashan, close to Bashan Arc fault, featured by folds with southdipping axial planes, is evidently different with dominant north-dipping axial planes in both North and South Dabashan units, indicating that the Northern Dabashan underwent at least two stages of thrust movements (Zhang et al., 2001; Dong et al., 2008; Zhang et al., 2010). These folds with south-dipping axial planes should be formed at the early stage of collision and overprinted by following southward thrust nappes. The total shortening in the Northern Dabashan may reach 31%~48% (Dong et al., 2008).
The Southern Dabashan unit is located at the northeastern margin of Sichuan basin, with two rigid basements (Hannan-Micangshan and Huangling-Shennongjia massifs) in its east and west sides (Fig. 1b,c, Zhang et al.,2001; Dong et al., 2006, 2008, 2011; Shi et al., 2012, 2013). The unit displayed as a typical double arc-shape structure in the west flank of the Huangling-Shennongjia massif (Yue et al., 1996; Huang 2000; Wu et al., 2009; Shi et al., 2012, 2013). The Southern Dabashan is characterized by developed fold-thrust structures, can be further divided into northern foreland fold-thrust belt and southern overthrusting extended belt (Fig. 1b). The former displays overprinting of two stage folds where different hinge trends indicate earlier dextral shear and later thrust superposition. The latter mainly consist of thin-skinned folds, characterized by upright and wide folds with few faults. It seems that the structural deformation in the Southern Dabashan is gradually weakened from northeast to southwest and the average shortening is about 36%~53% (Dong et al., 2008).
The Bashan Arc fault constitutes a boundary between the Southern and Northern Dabashan tectonic units (Zhang et al., 2001; Dong et al., 2008; Zhang et al., 2010). In fact, it is a thrust nappe belt consisting of a series of NE-SW or N-S thrusts. The major nappe fault was suggested to be associated within the Chengkou fault that formed and been active during Middle-Late Jurassic (Xu et al., 2005). The general movement of the Bashan Arc fault is towards southwest (240º). The vanguard portion, e.g. Chengkou section, is nearly parallel with the structural trend of the North Dabashan (about 290°~300º) while west and east sides cut the structural line of the North Dabashan with high angles (Dong et al., 2008).
Hannan-Micangshan terrane, Foping dome, Shennongjia-Huangling terrane, as well as Wudang dome, located at the southwest, northwest, southeast, and northeast of the Bashan arc fault belt respectively (Fig. 2), were supposed as the “anchor” during the formation of the Dabashan thrust nappe structure because of their relative rigid basements (Dong et al., 2008; Zhang et al., 2010; Wang et al., 2011). Along with the activity of the Bashan arc fault, they might work together to play an important role to construct the current structural styles of the Dabashan thrust nappe. Bikou terrane, surrounded by Qingchuan-Yangpingguan fault and Mianlue suture belt, located at the northwest of the Dabashan thrust nappe, was supposed intruded into the South Qinling and also contributed to the formation of the Dabashan thrust nappe.

Figure 2 Simplified geometry map of the research area. The map in upper-right corner indicates the location of the research area within China (Dong et al., 2011b).
Bikou terrane, surrounded by Qingchuan-Yangpingguan fault and Mianlue suture belt, located at the northwest of the Dabashan thrust nappe, was supposed intruded into the South Qinling and also contributed to the formation of the Dabashan thrust nappe.
3. Numerical method
3.1 Model description
A two-dimensional (2D) plan-view model (Fig. 2, 3) was designed to simulate the formation of the Bashan Arc, and mainly focused on the condition that leads to the Bashan fault bending. According to previous studies (e.g. Jiang et al., 1982; Xu et al., 1986; He et al., 1997, 1999; Zhang et al., 2001; Wang et al., 2003; Dong et al., 2006; Li et al., 2006; Liu et al., 2006; Luo et al., 2007; Dong et al., 2008; Zhang et al., 2010; Dong et al., 2011b; Wang et al., 2011, 2013), we assume that the bending conditions might include: 1) the North Qinling moves towards south; 2) the Yangtze Block moves towards north; 3) the irregular margin of blocks produces dextral shearing and lateral extrusions in Dabashan area; 4) Hannan-Micangshan terrane, Foping dome, Shennongjia-Huangling anticline, as well as Wudang dome act as baffles to hold down the thrust nappe (Fig. 2). Although.
Bikou terrane is a little far from Bashan Arc Fault, it is at the north of the northeast margin of Sichuan basin, and very close to possible model boundary, we included it as one of experiment steps. The geometry in the 2D plan-view model is based on the reconstruction of above tectonic units, Bashan Arc fault, as the focus of the model, is designed as a straight line at the initial stage, while the North Qinling and the Sichuan Basin, playing roles of parts of the boundary conditions, are moved to outside of the model boundaries (Fig. 3) except for stresses or velocities applied on their south margin and northeast margin, respectively.

Detailed model parameters, such as rock properties, boundary and initial conditions are the key factors for numeric models and should be adjusted during model solving, they will be discussed in the numerical result session.
3.2 Numerical algorithm
The commonly used numerical algorithm for geology modelling can be divided into 3 groups which are: 1) continuum methods that include Finite Difference Method (FDM) and Finite Element Method (FEM), as well as Boundary Element Method (BEM); 2) discontinuum methods that include Discrete Element Method (DEM) and Discrete Fracture Network (DFN); 3) hybrid methods that combined continuum and/or discontinuum methods (Jing, 2003).
FLAC is one of FDM algorithm with the mixed-discretization technique (Cundall and Board, 1988; Itasca, 2005). It has been widely used to simulate rock deformation (Xia et al., 2006) and solve structural geology problems (Hobbs et al., 1990; Ord, 1991; Zhang et al., 1996b; Zhang et al., 1996c; Zhang et al., 2000; Strayer et al., 2001). For example, Ord (1991) simulated the uniaxial compression deformation of Gosford sandstone and demonstrated that the stress-strain relationships from the FLAC numerical models for several different confining pressures are consistent with those reported from an experimental work (Edmond and Paterson, 1972).
Similar to most mesh-based numerical modelling methods, materials (geology blocks, rocks and so on) in FLAC are represented by elements, or zones, which form a grid. Each grid is assigned material properties, such as density and elastic moduli, and behaves according to a prescribed linear or nonlinear stress/strain law in response to the applied forces or boundary restraints (Itasca, 2005; Xia et al., 2006). The material can yield and flow, and the grid can deform in large-strain mode and move with the material that is represented.
Using the explicit and Lagrangian calculation scheme, together with the adapted mixed-discretization technique, FLAC ensures that material failure and large deformation are modeled accurately. The explicit method and dynamic relaxation scheme make it possible to carry out large calculations with relatively less memory requirements because of no global stiffness matrix formed during computation. However, the time-step must be small enough to ensure convergence and numerical stability (Cundall and Board, 1988).
FLAC contains a powerful built-in programming language FISH (short for FLACish, Itasca, 2005) that can be used to extend FLAC’s functionality, e.g. generate very complicated geology bodies, apply any kind of initial and boundary conditions, or implement special constitutive models for any materials.
In this study, we select FLAC as the major numerical modelling platform and use FISH to implement most of numerical algorithm and functionalities.
3.3 Theoretical basis
The elastic-viscous constitutive law (known as the Maxwell substance, Itasca, 2005) can be used to simulate the time-dependent behavior of materials that exhibit creep, for example, the irrecoverable deformation of rocks under small stresses and over a long period. An elastic-viscous rheology material exhibits both viscous and elastic behaviors (Itasca, 2005). It is equivalent to a combination of an elastic element and a Newtonian viscous element in series (Turcotte and Schubert, 1982; Ranalli, 1987), in which the instantaneous elastic response and the viscous deformation are coupled (Xia et al., 2006). The total strain  is the sum of the elastic strain (
 ) and viscous strain (
 ),
),

The elastic strain relates to stress ( ) according to Hookes law

where G, K and  re shear, Hand the Kronecker delta, respectively,
and the viscous strain rate ( ) relates line y to stress according to the
Newtonian flow law

Where η is viscosity. Strain rate is defined as a function of velocity gradients.
The elastic-plastic constitutive law (Mohr-Coulomb model, Itasca, 2005) is the conventional model used to represent shear failure in soils and rocks. Vermeer and DeBorst (1984) report laboratory test results for sand and concrete that match well with the Mohr-Coulomb criterion. A Mohr-Coulomb elastic-plastic material undergoing deformation behaves initially elastically until the stress reaches a critical value known as the yield stress, at which point it begins to deform plastically, and irreversibly, to high strain (Xia et al., 2006). The yield of such material may be expressed as a yield function ƒ given by

Where τm is the maximum shear stress, σm is the mean stress, Ø is the friction angle and  is the cohesion. The material is in an elastic state if ƒ < 0 (the stress state is not touching the yield surface), and is in a plastic state if ƒ = 0 (the stress state is touching the yield surface) (Xia et al., 2006). Detailed information on using the Mohr-Coulomb elastic-plastic materials to simulate deformation in thrust wedge can be found in Strayer et al (2001). The interface is characterized by Coulomb sliding and/or tensile separation. It is designed in FLAC to model the geomechanics in which sliding or separation between planes is desirable, for example, joint, fault or bedding planes in a geologic medium. An interface has the properties of friction, cohesion, dilation, normal stiffness and shear stiffness, and tensile strength. The contact logic for either side of the interface is similar to that employed in the distinct element method (e.g., Cundall and Hart, 1992).
In this study, the elastic-viscous rheology constitutive law (Maxwell model) is used to simulate the tectonic transport patterns (material movement) of North and South Dabashan, and the interfaces are involved to simulate the strike-slip of the Bashan Arc fault. The elastic-plastic constitutive law (Mohr-Coulomb model) is also employed for pre-calculation. As for rigid tectonic units such as Bikou, Hannan, Foping, Wudang and Shennongjia, a set of rigid material properties are applied to make sure that they are hardly moved or deformed during the solving progress.
4. Model and results
4.1 Model design and grid generation
The Dabashan nappe thrusts are supposed to have suffered at least two stages of tectonic movements that are subduction collisional orogeny and subsequent intracontinental orogeny since Mesozoic-Cenozoic (Dong et al., 2006, 2008; Zhang et al., 2010). The subduction collisional orogeny results from the collisions between the North China Block, Qinling Micro-Plate and Yangtze Block along Shangdan and Mianlue sutures respectively (Cai et al., 1988; He et al., 1997; Zhang et al., 2001; Ratschbache et al., 2003; Wang et al., 2003; Dong et al., 2008), suggests that the model boundaries should be put to the north of Mianlue suture and to the south of the north margin of Yangtze Block (partly adapted according to the northeast margin of the Sichuan Basin). The intracontinental orogeny, as results of rock deformation under long term stress and temperature, is reflected by deformation and movement of finite difference grids inside the model and controlled by the constitutive model and material properties.
The east and west boundaries of the model are put to the east of Shennongjia terrane and to the west of Bikou terrane to make sure that all relevant tectonic units are involved in the model.
The Bashan Arc fault separates the North Dabashan and South Dabashan Belts into two different tectonic units (Dong et al., 2008). The tectonic orientation of the North Dabashan unit is NWW and almost parallel to that of the South Qinling Belt (about 290º- 300º, Dong et al., 2008). The tectonic orientation of the South Dabashan unit is more complex that may due to overprint by later tectonic actions (Dong et al., 2008). In this model, we design a NWW fault to represent the initial shape of the Bashan Arc fault.
Thus, the designed model skeleton consists of 8 sub-grids (Fig 4), in which the null grids (spaces that divided sub-grids) 1, 2, and 3 will be replaced by interfaces to represent the dividing line between North and South Dabashan, and the others (null grids) will be removed by merge and attach the related sub-grids together.

Figure 4 Skeleton of the plan-view model, maps the study area ranging N30.5º-33.5ºand E104º-112º. It extends about 900 km in W-E direction and 350 km in N-S direction, the average length of each finite difference grid equals to about 10 km in real study area. The model is initially built as sub-grids, null grids (marked as 1, 2, 3) represent boundaries of South and North Dabashan.
The other tectonic units such as Bikou Terrane, Hannan-micangshan Terrane, Foping Dome, Huangling-shennongjia Terrane, as well as Wudang Dome, playing role of rigid baffles, are added to the model during the experiment process. The completed plan-view model is shown in Fig. 3.
4.2 Boundary and initial conditions
The shape of the boundaries in the plan-view model is mainly based on a reconstructed and simplified map of the Dabashan and adjacent areas (Fig. 2), also consulted from a skeleton map published by He et al (1997). The north and southeast boundaries are designed as straight lines just for simplification. We tried applying declining boundaries along NEE and SE directions for north and southeast respectively as employed by Wu et al (2009), which did not make obvious difference to the modelling results.
Roll boundary conditions are applied to eastern and western boundaries along which the W-E movements are limited while the N-S movements are allowed. Free boundary conditions are added to the north and most of the south boundaries. To avoid unbalance failure leading by strong clockwise rotation, the corner segments of western and eastern of the south boundary are fixed.
A crustal shortening rate of 1.28 mm/year (He et al., 1997) is applied to both the north and south boundaries. This rate is approximately converted to a boundary stress of 1.1×10⁷ to 1.5×10⁷ Pa via pre-calculation with the plan-view model, which is also consistent with the boundary stress adopted in Wu et al (2009).
As a 2D plan-view model, the horizontal extrusion and plane displacement are mainly concerned while the initial gravity and stress applied inside finite difference mesh are set to default value of zero.
4.3 Constitutive model and material properties
Previous field and laboratory studies (He et al., 1997; Zhang et al., 2001; Dong et al., 2008; Wu et al., 2009; Wang et al., 2011, 2013) indicate that the Dabashan experienced long-term flexible deformation, therefore, large strain and viscous rheology constitutive law should be introduced for the simulation in this area (Wu et al., 2009). In this study, the classical viscoelasticity model (e.g. Maxwell substance) is adapted in the 2D planview model. The classical viscoelasticity model is widely used to simulate the time-dependent rock deformation, for example, intracontinental orogeny after collision. By carefully control the material properties, the classical viscoelasticity model can show behavior as either linear or nonlinear viscous rheology. As a simple time-dependent constitutive model, it has been used in lots of previous numerical simulation studies in the fields of structural geology and tectonics (Dieterich and Carter, 1969; Treagus, 1973; Williams et al., 1978; Lin et al., 2004; Xia et al., 2006).
The material properties required for the classical viscoelasticity model are density, shear and bulk moduli (for the elastic behavior) and the viscosity (for the viscous behavior), which promise that the material flows continuously under an applied shear stress but behaves elastically under an applied isotropic stress (Itasca, 2005). In this study, we use a set of homogeneous material models for different tectonic units so that the effects of material difference can be tested and compared. The basic material model is consistent with the parameters for general average crust-lithosphere materials (e.g. Turcotte and Schubert, 1982) that include density of 2800 kg/m3, bulk modulus of 4×10¹⁰ Pa and shear modulus of 2.4×10¹⁰ Pa (Table. 1, Xia et al., 2006). As for the value of viscosity, a set of experiments is carried out to test the affect of material rheological properties which will be discussed in section of model results.

4.4 Model results
The 2D plan-view model is calculated under larger strain and in two stages. The first stage simulates the situation of “hard” collision in which the rock deformation behaviors are mainly elasticity by set the creep time-step to zero. When the first stage finished, we checked the maximum unbalance force in the system to make sure that the model system reached a mechanics balance state. The second stage simulates the situation of “inside” deformation in which the rock deformation behaviors are mainly viscous rheology that controlled by rock creep over a long period. For creep analysis, the time-step has realistic meaning other than a virtual calculating factor employed in other static analysis (Itasca, 2005). The creep time-step reflects the realistic period of rock deformation that should be determined by parameters of viscosity and shear moduli. In this study, we use an adjustable creep time-step that will be decreased whenever the maximum unbalanced force exceeds some threshold, and increased whenever it goes below some other level. By this way, we want to make sure that the model system is always under a mechanics balance state.
4.4.1 The pattern of materials movement in the Dabashan area
The first stage (instantaneous movement of materials under a “hard” collision) ended after 1774 static time-steps and reached a mechanics balance state. The contours plot of the displacement shows that the materials principally move towards south (Fig. 5a) and the displacement in the north Dabashan is larger than that in the south Dabashan.

Figure 5 Displacement contours of the plan-view model at the end of “hard” collision. (a) Contours of the y-component of displacement (the maximum y-displacement is about 0.05 km). Positive values indicate northward movement and negative values indicate southward movements (b) Contours of the x-component of displacements (the maximum x-displacement is about 0.01 km). Positive values indicate eastward movement and negative values indicate westward extrusion.
There is small quantity of westward extrusion in the south Dabashan (Fig. 5b) and the maximum displacement in westward direction is about 20% compare to that in southward direction.
The second stage (creep of materials) falls into deformation failure due to some elements within the mesh become too strongly deformed and modelling cannot be continued. Fig. 6a shows the displacement pattern after 25 million years of collision. It can be clearly observed that the tectonic transport patterns (material movement) are characterized by strong NE-SW overthrust and the Bashan Arc fault (initialized as a straight line) shows an obvious arc shape extruded toward SW (240º) which is consistent with the present-day geomorphy in Dabashan area (Dong et al., 2008).

Figure 6 Results of the plan-view model. (a) Distribution of displacement vectors (the maximum displacement is about 76 km). (b) Contours of the y-component of displacement. Positive values indicate northward movement and negative values indicate southward movements. (c) Contours of the x-component of displacements. Positive values indicate eastward movement and negative values indicate westward extrusion.
The NE-SW material movement can be more clearly analysed by plotting out the contours of the displacement component in the E-W and N-S directions, respectively. Fig. 6b shows the contours plot of the displacement component in the N-S direction (e.g. y-component) in which positive values indicate northward movements and negative values indicate southward movements. The maximum southward displacement of 30 km (negative contours) that distributes through the middle and the eastern part of Bashan Arc fault may reflect the overthrust nappe movement from north to south in tongue shape (e.g. the strong push in the middle and the weak push in the sides) that implies why the Bashan fault appears as an arc shape. The displacement toward the south in the South Dabashan unit is gradually smaller that may reflect that the deformation in the South Dabashan is gradually weakened from north to south (Dong et al., 2008).
We also notice that the areas surrounding Bikou-Hannan in the west and Wudang-Shennongjia in the east suffer minimum N-S displacement (the y-component is nearly zero) which implies an “anchor” effect of the Bikou-Hannan and Wudang-Shennongjia terranes.
Fig. 6c shows the contours plot of the displacement component in the E-W direction (e.g. x-component) in which positive values indicate eastward movements and negative values indicate westward movements. The trend of westward movements (negative contours) runs through the Dabashan area from north to south and the maximum westward displacement is at the South Dabashan unit.
The maximum displacement after 25 million years of collision is about 76 km (Fig. 6a). To compare with the published average crustal shortening distance of 40 km in the North Dabashan (Dong et al., 2008) and 64 km in the South Dabashan (He et al., 1997), a mark line AB is put into the model to track and calculate the average displacement in the North and South Dabashan units (Fig. 7), and the results are average displacement of 37 km and 41 km, maximum displacement of 39 km and 61 km for the North and South Dabashan (along AB path in Fig. 7), respectively. The potential underestimation of the values may be due to: 1) the 2D plan-view model could not include the slip and detachment layers beneath the Dabashan area that should be also contribute to the displacement; 2) the model only calculated 25 million years of the intracontinental orogeny that should be shorter than the actual situation. The larger deviation for the South Dabashan may also imply complex tectonic overprint in this area (Dong et al., 2008).

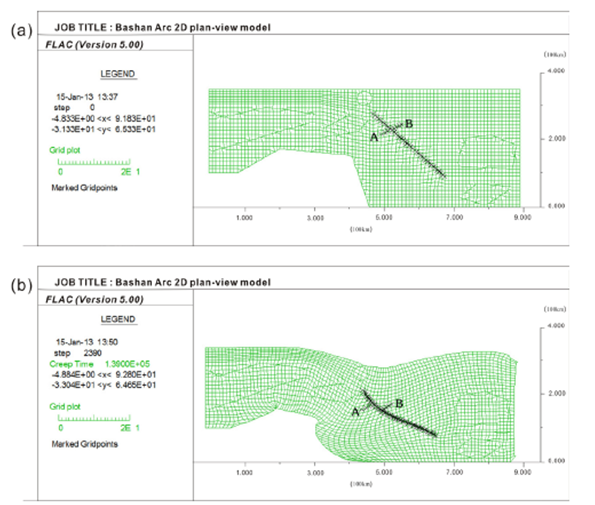
4.4.2 Dextral shear along the Bashan Arc fault
To evaluate whether the tectonic movement leading strike-slip along Bashan Arc fault, interfaces are introduced into the model to replace the initial marker lines for Bashan Arc fault (Fig. 4). The interfaces of 1 and 3 (in Fig. 4) represent the dividing line between north and south Dabashan and are limited neither to slip nor open, while the interface 2, representative of Bashan Arc fault, is allowed to slip or open by set relative small value to normal stiffness (kn) and shear stiffness (ks) parameters. The parameters for interface 1 are normal stiffness of 1×10¹⁰ Pa/m, shear stiffness of 1×10¹⁰ Pa/m and friction angle of 30º. These values are commonly used by Itasca (2005) and within the data range published by Kulhawy (1975), Rosso (1976) and Bandis et al (1983).
The fault slip experiment shows an obvious right-lateral shearing along Bashan Arc fault (Fig. 8b) compare with the initial finite difference grid (Fig. 8a) where the mark line AB is put on both side of the fault to track fault offset. As the parameter values for the interface are not derived from physical tests on real joints, the value of the fault offset can not reflect the realistic fault offset. What we concerned is the direction of the fault slip, yes, right-lateral shearing slip, which may imply that the right-lateral shearing produced by incongruous margin of block may play an important role on the formation of Bashan Arc (He et al., 1997).
4.4.3 The effects of rigid “anchor”
Bikou, Hannan, Foping, Wudang, Shennongjia terranes are then removed from the initial model to estimate their contribution to bending of Bashan Arc, and the other conditions and parameters in the model keep consistent with that in the initial model. Fig. 9a and b show the contours plot of the displacement component in the N-S and E-W directions, respectively. A strong northward extrusion appears on the y-displacement contours plot (Fig. 9a) and maximum northward displacements take place in the area between Bikou and Hannan terranes. Taking into account of the strong southward extrusion in Dabashan area, the model may involve into clockwise whirl and out of balance. The x-displacement contours plot (Fig. 9b) indicates that westward extrusion seems nearly zero in North Dabashan unit that may be adverse to the formation of Bashan Arc. Therefore, “anchor” effects contributed by these rigid tectonic units should exist.

Figure 9 The “anchor” effects of Bikou, Hannan, Foping, Wudang, and Shennongjia. (a) Contours of the y-component of displacement. Positive values indicate northward movement and negative values indicate southward movements. (b) Contours of the x-component of displacements. Negative values indicate westward extrusion.
4.4.4. The rheological properties of rocks in the Dabashan area
The viscosity values for general average crust-lithosphere materials is about 5×10²¹ Pa s (Turcotte and Schubert, 1982; Xia et al., 2006) which is converted to 1.6×10¹⁴ Pa y because we use year as the unit for creep time. This value is used for both North and South Dabashan tectonic units in the 2D plan-view model, while Bikou, Hannan, Foping, Wudang, as well as Shennongjia terranes, a large value (more than 100 times of that for Dabashan) are employed to make sure that they are rigid compare to surrounding materials during creep analysis.
To estimate the relationship between viscosity values and deformation in Dabashan tectonic units, we tried a set of viscosity values for experiment. The results show that: 1) if the same viscosity value is set for the North and South Dabashan, the smaller the viscosity is, the larger the displacement obtained (Fig. 10a); 2) if the different viscosity values are set to the North and South Dabashan, enlarging the difference does not help to enlarge the displacement (Fig. 10b).

Figure 10 Sensibility analysis of the material viscosities. (a) The same viscosity value is set to both North and South Dabashan. The creep time is 10 million years after collision. (b) The different viscosity values are set to North and South Dabashan. The creep time is 10 million years after collision. The broken line of “North Dabashan” means an invariant viscosity (10 MPa year) for the South Dabashan and gradually enlarged viscosity for the North Dabashan; Accordingly, the broken line of “South Dabashan” means gradually enlarged viscosity for the South Dabashan while the North Dabashan keeping invariant
4.5 Model limitations
This paper mainly focuses on 2D models for studying the geological and geodynamic condition of the Dabashan thrust structure using FLAC (2D) as main modeling tool. As general limitations of using 2D models for 3D orogenic deformation simulation, the model in this paper has below limitations:
Vertical topographical variation (Li et al., 2013) is not included in the model.
Viscosity of crustal and lithospheric rocks that depends on stress and temperature should be strongly vary with depth, is simplified as a few constant variables for different areas in this paper,
The Mianlue suture that affects the formation of the Dabashan thrust nappe, is not included in the model. These limitations will be solved in our ongoing research with cross-view and 3D models.
5. Discussion
The formation of the Dabashan thrust nappe structure is acknowledged as results of multiple stage evolutions (He et al., 1999) that includes tectonic extension (Paleozoic), tectonic inversion (Middle Triassic) and thrust tectonics (Middle Triassic to Early Jurassic, Shi et al., 2012; Dong et al., 2006; Hu et al., 2009). After inter-continental collision orogeny (Late Triassic to Early Jurassic), Dabashan orocline continue reshaping during Late Jurassic to Early Cretaceous, proved by the sediment sequence and strata unconformity (Dong et al., 2005, 2006, 2008; Meng et al., 2005; Shi et al., 2007, 2012; Li et al., 2007; Qu et al., 2009; Zhang et al., 2010; Hu et al., 2012), isotopy dating (Cheng and Yang, 2009; Hu et al., 2009; Liu et al., 2011; Li et al., 2010, 2011, 2012, 2013), and apatite fission-track (Shen et al., 2009; Xu et al., 2010; Li et al., 2010, Shi et al., 2012; Hu et al., 2012).
Regarding to the key factors that affect and control the formation of the Dabashan thrust nappe, there are mainly four opinions: 1) the uplift at both ends of the Bashan Arc fault is main mechanism (Jiang et al., 1982; Guo et al., 1996; Wang et al., 2003; Zhang et al., 2004; Dong et al., 2010; Xu et al., 2010; Shi et al., 2012); 2) tectonic extension at the margin of paleo-contiental and irregular boundary are the decisive factors (Zhang et al., 2010), the dextral shear induced by the inconsistent morphology of the continental margins also plays a key role (He et al., 1997); 3) the arc-shaped fault that has been formed in the early stage of tectonic extension controls the thrust nappe developed toward southwest (Wang et al., 2011, 2013); 4) the detachment layers under Dabashan unit is the main formation condition (Wang et al., 2011, 2013).
From our study in this paper, it seems that the margin shapes generated by early tectonic extension (He et al., 1997, 1999) and the compression stress derived by subsequent tectonic inversion are important conditions to control the Meso- Cenozoic intracontinental orogeny, while pattern of materials movement in stage of thrust tectonics determines the formation of the Dabashan thrust nappe structure.
The results of the 2D plan-view models support that the shape of the north margin of Yangtze Block (e.g. the northeast margin of Sichuan basin extrusion northeastward against Qinling orogenic belt), together with the rigid Bikou-Hannan terrane on the northwest and Wudang-Shennongjia terrane on the southeast, are the main conditions of producing large-scale clockwise rotation in Dabashan area. During the movement of South Qinling towards south, the Bikou-Hannan terrane firstly obstructs locally the southward movements and compels the movement turn to eastward. The materials of eastward movement then conflict with the materials of southward movement at the north and west of the North Dabashan area, and change the direction to southward. The converged southward movements are then baffled by Wudang-Shennongjia terrane and turn to westward. Lastly, the materials of westward movement are blocked by the northward extrusion along the northeast margin of Sichuan basin, some of materials turn to north (thus the clockwise whirl is shaped) and the others turn to south along the east margin of Sichuan basin, as shown in Fig. 5a-b and 6a-c. The existence of the clockwise whirl is confirmed by right-lateral shearing along the Bashan Arc fault (shown in Fig. 8b).
The modelling results also reveal that the predominant pattern of materials movement through the Dabashan area is along an arc curve and pushes forward in a tongue-shaped in the front edge. The arc curveersects with the Bashan Arc fault belt at the middle portion of the fault belt that leads to the southwestward displacement in the middle portion is larger than that in the eastern and western portions of the fault belt thus the fault belt displays as a southwestward extrusion arc-shape (Fig. 6a).
As limitation of 2D plan-view model, the slip and detachment layers beneath the Dabashan area can not be simulated which may affect the estimation of the average displacement of the thrust nappe. However, the 2D plan-view model confirms that the N-S compression, dextral shearing, plus rock rheology can control the formation of the Dabashan thrust nappe structure.
6. Conclusion
According to the modelling results and discussion above, we propose following conclusions:
The compressive stress produced by the plate collision along north and south boundaries of the Dabashan tectonic unit is the main driving force;
The dextral shearing derived from the inconsistent shape on the block margins is the main controller;
Rigid tectonic units such as Bikou and Hanan-Micangshan terranes, Foping and Wudang dome, as well as Shennongjia-Huangling anticline contribute as “anchor” effects;
The rheology properties of rock material in the Dabashan area affect the shape of the arc. However, the difference of the rheology in the North and South Dabashan may not help to enlarge the deformation.

