English (pdf)
 Article in xml format
 Article references
 Send this article by e-mail
 Cited by SciELO
  Cited by Google
  Similars in
SciELO
Similars in
SciELO  Similars in Google
 Permalink
Introduction
The stability of the openings in underground mines is a major factor affecting mining safety and sustainability. As such, safety and economic restrictions are the main design parameters considered in underground excavations. The geometry of an underground opening (shape and size), toe between openings and length of openings are functions of safety and cost. Decisions regarding these mining parameters are generally empirically based and at times unexpected failures occur.
The distance between the footwall drift and the stope is an important factor that affects the stability of the footwall drift. The strength of the rockmass and the mining depth significantly influence the distance required between the footwall drift and stope. In deep mines, the rockmass is highly stressed and stability problems occur around underground openings.
Although several studies have addressed the interaction between underground tunnels (Ghaboussi & Ranken, 1977, Jamshid & Randall, 1977; Yamaguchi et al. 1998; Addenbrooke & Potts, 2001; Gercek, 2005; Karakus et al. 2007; Wang et al., 2007; Wang & li, 2008; Chakeri et al. 2011; Wang et al., 2017), few have addressed the influence of the stope on the footwall drift in underground mines. Abdellaha et al. (2011) examined the interaction between the haulage drift and mine stope in a sublevel-stoping mine. The authors considered six excavation sequences in one stope and evaluated the support required for the haulage drift after each excavation. Purwanto et al. (2013) studied the influence of stope design on the stability of the hanging wall decline in cut-and-fill mines. The authors numerically analysed the stability of the hanging wall decline for various stope geometries. Kabwe & Bowa (2016) investigated the effect of the mining method on the stability of the footwall drift for the same orebody by numerically modelling the stress distribution over the stope and footwall drift for three different mining methods. On the other hand, none of the studies mentioned above have effort on determination of non-influenced zone distance between stope and footwall drift in longhole stoping mines.
The main scope of this paper is to estimate the distance between the footwall drift and stope that is necessary to ensure the existence of a noninteraction zone in longhole stoping mines. We also consider the effect of geotechnical conditions. In our study, we examined the footwall drift of the Bakibaba underground copper mine, which has experienced stability problems, and we used numerical analyses to determine the displacements over the footwall drift for various geological strength index (GSI) values..
Mining Method
The Bakibaba underground copper mine is located in Kure province in north-western Turkey, near the city of Kastamonu and the Black Sea. In this mine, a longhole-stoping and post-backfill method is used and the mine has an annual production capacity of 1,000,000 tonnes. The orebody lies in a north-easterly direction, is 100-300 m in length and averages 40 m in width. The ore deposit is 500 m in depth and the dip of the ore is 70°. The orebody is accessed via a 15% declining ramp. A footwall drift running parallel to the orebody is 5-m wide by 5-m high. Crosscuts are driven from the footwall across the orebody to the vein. The footwall drifts are positioned 40-50 m from where the footwall makes contact with the orebody. From the boundary of the ore deposit, 7-m wide by 5-m high sill drifts are driven until contact is made with the hanging wall. The upper and lower sill drifts are connected at 15-m intervals by a slot raise, and then widen to a 7-m drift width. Parallel blast holes 76 mm in diameter are drilled downward between two sill drifts. After blasting, a remote-controlled load-haul-dump (LHD) vehicle is used to muck the ore from the lower sill drift and transport it to the ore pass. After the entire stope is mined, the open stope is backfilled from the upper sill. In the Bakibaba underground mine, primary stopes are paste-filled or cemented-rock-filled and secondary stopes are rock-filled. Figure 1 shows schematic illustrations of the stope production cycle.
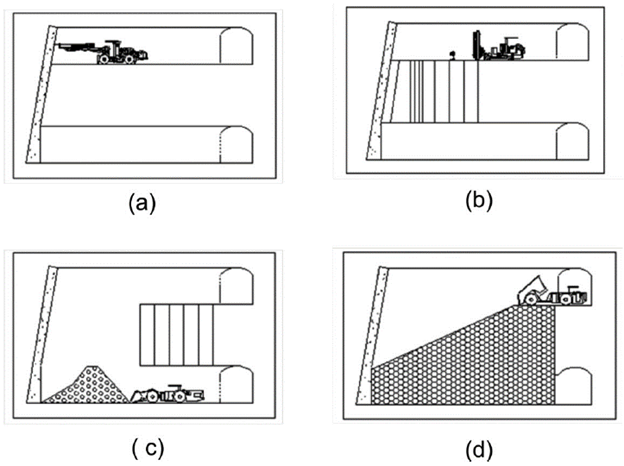
Figure 1 Stope production cycle (a: stope development, b: production drilling, c: ore mucking, d: backfilling
Numerical Model
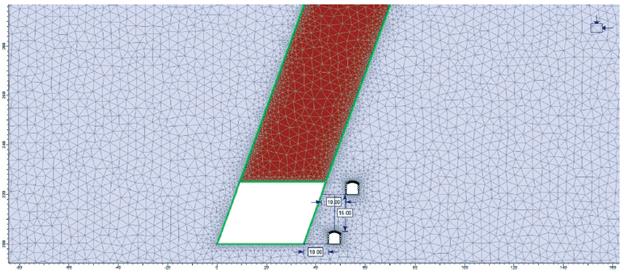
In the mining industry, the numerical finite element method (FEM) is widely used to solve geotechnical problems. FEM can accommodate material heterogeneity, non-linear deformability, complex boundary conditions, in-situ stresses and gravity (Jing & Hudson, 2002; Sharma, 2009). The utilization of FEM-based software is one of the most preferred methods, particularly in underground design analyses (Ozdogan et al. 2017). In this study, Phase2 two-dimensional (2D) FEM software program developed by Rocscience (2007) was used to determine the influence of the distance between the stope and the footwall drift.
Figure 2 shows the model used in our analysis, in which we used 10-m-interval distances between the footwall drift and stope up to the stabilisation of the displacement over the drift.
Laboratory tests in accordance with ISRM standards were performed to determine the geomechanical properties of the rock unit, including the uniaxial compressive strength, unit weight, Young's modulus, Poisson's ratio, cohesion and internal friction angle of the rock unit (Table 1). To determine the rock-mass input parameters for the FEM analyses, we performed both laboratory and field studies and used Hoek and Brown criteria.
Table 1 Test results for rock units
| Parameter, symbol, unit | Basalt (hanging wall & footwall) | Ore Zone |
|---|---|---|
| Unit weight, 5, kN/m3 | 28.04 | 28.80 |
| Uniaxial compressive strength, o, MPa | 50.48 | 60.28 |
| Brazilian tensile strength, ot, MPa | 4.88 | 5.25 |
| Young's modulus, Ei, GPa | 12520 | 14280 |
| Poisson's ratio, v | 0.25 | 0.24 |
| Cohesion, c, MPa | 9.82 | 10.16 |
| Internal friction angle, O, ° | 44.5 | 43.25 |
Hoek and Brown criteria developed by Hoek et al. 2002, is an empirical method to determine the strength of rock masses in terms of major and minor principal stresses and widely used criterion in geotechnical projects. Hoek and Brown criteria estimates the strength envelopes determined from laboratory triaxial tests of intact rock by using, uniaxial compressive strength of intact rock (sigci), the intact rock parameter (mi), the geological strength index (GSI) and the disturbance factor (D). The Hoek and Brown criteria is expressed as;
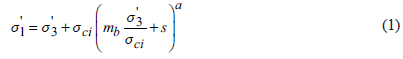
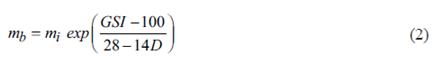
Where, σ ci is the uniaxial compressive strength and mb is the reduced value of material constant mi. which is calculated as;
s and a are constants for rock mass given by;


In order to determine rock mass parameters from laboratory test results RocData software was used. Table 2 shows the strength parameters of the rock mass derived from our laboratory and field studies. Also using a chart derived by Sheorey (1994), we calculated a total stress ratio of 1.25 for the Bakibaba Copper Mine, based on the elasticity modulus and depth.

Results and discussion
FEM analyses were performed to investigate the effect of the distance between the extracted stope and the footwall drift on drift stability, and examined various distances between them.
Two evaluation criteria, including the yield zone, i.e. failure area, and the displacement over the footwall drift were considered. The analyses were stopped when the displacements over the drift had not changed in two consecutive analyses.
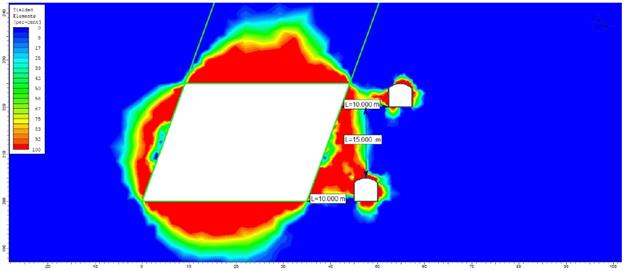
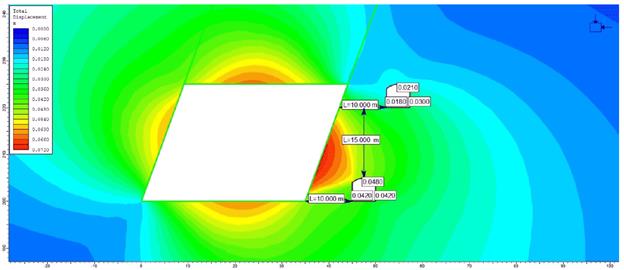
The red zones in Figure 3 indicate the 100% yield zone around underground spaces due to mining extraction when the distance from the stope to the footwall drift is 10 m. In Figure 4, the numbers on left-side wall (LW), right-side wall (RW) and roof (RF) of the drift indicate the displacement that occurred over the drift for a 10-m distance between the stope and footwall drift.
Similarly, Figures 5-7 show the changes in the yield zone and displacements for greater distances between the stope and footwall drift.

Figure 5 Yield zones and displacements for various stope-footwall-drift distances (a: yield zone for 20-m distance, b: displacements over drifts for 20-m distance, c: yield zone for 30-m distance, d: displacements over drifts for 30-m distance, e: yield zone for 40-m distance, f: displacements over drifts for 40-m distance)

Figure 6 Model 3, a) assembly configuration, this picture has a gelatin bed with anisotropies which are highlighted with red lines. b) Initial phase, this picture shows the previous gelatin bed below of the sand bed. c) Final phase, this picture shows two generated fractures which are marked with black arrows, these fractures stop to grow when connecting with the anisotropy planes. Further, the migrated fluid is indicated with blue arrows. d) Digital model scaled to nature, shows the generated fractures with green and the anisotropy planes with red. In addition, the orientation of fluid migration is indicated with black arrows.
Figure 7 Model 4, in images a), b) and c) are showing the initial phase, final phase and the digital model respectively. Further, in pictures d), e) and f) it can be seen the scape of the fluid. d) The picture shows the fracture when coming into contact with the clay bed. e) In the picture can be seen the lateral growth of the fracture and fluid´s flow between the two beds considering that the fracture cannot grow vertically. f) This picture is a top view where can be seen the fluid mixed with the sand bed after ascending through the space between the tank and the clay bed.
As expected, as the distance between the stope and footwall drift increases, the yield zone and displacements over drift decrease. When the distance is 10 m or less, the yield zone of the stope and footwall drift overlap and unstable drifts occur.
The model results show that when the distance between the stope and footwall drift is 10 m, the displacement on the roof of the upper drift is 0.021 m and that of the bottom drift is 0.048 m. The displacement on the roof decreases to 0.015 m for the upper drift and 0.033 m for the bottom drift for a distance of 20 m. Table 3 shows the change in the displacements over the footwall drift, in which we can see that when the distance between stope and the footwall drift is 70 m, the footwall drift is totally removed from the influence zone. Figure 8 shows the relation between distance between the stope and footwall drift and the displacements over the footwall drift.
Table 3 Change in displacements over the footwall drift
| Distance between Stope and Footwall Drift (m) | Upper Drift (m) | Bottom Drift (m) | ||||
|---|---|---|---|---|---|---|
| Left Wall | Right Wall | Roof | Left Wall | Right Wall | Roof | |
| 10 | 0.018 | 0.030 | 0.021 | 0.042 | 0.042 | 0.048 |
| 20 | 0.012 | 0.024 | 0.015 | 0.030 | 0.033 | 0.033 |
| 30 | 0.009 | 0.021 | 0.015 | 0.021 | 0.030 | 0.024 |
| 40 | 0.006 | 0.021 | 0.012 | 0.012 | 0.024 | 0.018 |
| 50 | 0.003 | 0.018 | 0.012 | 0.009 | 0.021 | 0.015 |
| 60 | 0.003 | 0.018 | 0.012 | 0.006 | 0.021 | 0.012 |
| 70 | 0.003 | 0.018 | 0.012 | 0.003 | 0.018 | 0.012 |
| 80 | 0.003 | 0.018 | 0.012 | 0.003 | 0.018 | 0.012 |

Figure 8 Model 5, a) initial phase, shows the anisotropies in the gelatin beds indicated with red arrows below one clay bed and one sand bed. b) Final phase, shows the growth of two small fractures in the central zone and mainly the fluid migration through the created anisotropies which is marked with black arrows. c) Digital model scaled to nature, evidences clearly the generated fractures with green color and the initial anisotropies with red color besides highlighting the migration of fluid with black arrows.
Our numerical analyses indicate that, for the given geotechnical circumstances, the displacements over the drift become stable when there is a distance of 70 m from the stope. We conducted further numerical analyses for various GSI values to determine the effect of the GSI value on the critical distance between the stope and footwall drift. Table 4 shows the displacements around the footwall drifts for various GSI values and various stope distances. As expected, the interaction between the stope and footwall drift decreases with increases in the GSI value. However, a GSI value of 55 is the limit value regarding interaction between the stope and footwall. Higher GSI values have no influence on the non-interaction zone distance. At distances of 70 m and more between the stope and footwall drift, we observed no interaction for GSI values higher than 55. Variation of non-influenced zone distance based on GSI were shown in Figure 9.
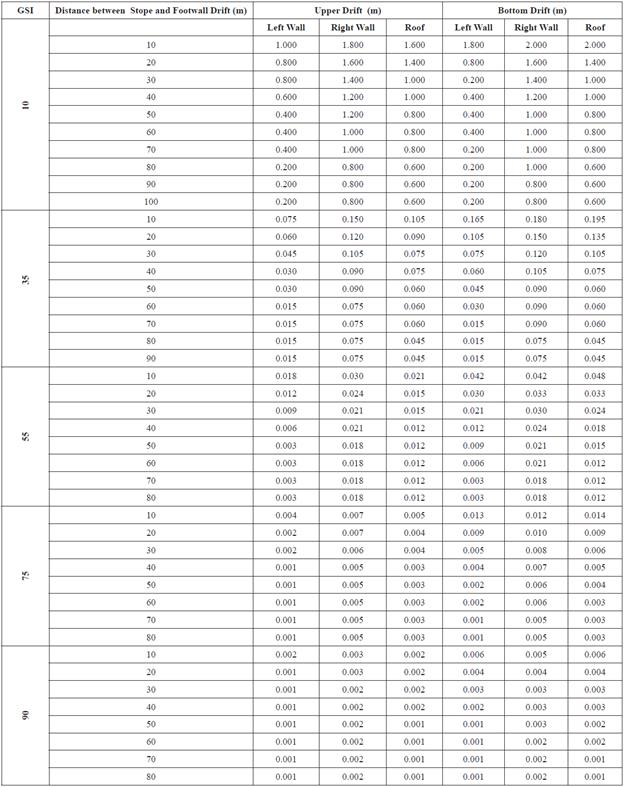

Figure 9 Model 6, a) initial phase, shows the gelatin bed with small bubbles and one anisotropy which is indicated with a red arrow below a sand bed. b) Final phase, shows two generated fractures and the growth of the initial anisotropy, further on one of the fractures generated is made a cut to show the irregular shape. c) Digital model scaled to nature, shows the generated fractures with green color
Conclusions
In this study, 3D finite element method was used to investigate the interaction between the stopes and footwall drifts of the Bakibaba underground copper mine. We determined the range of influence between the stope and footwall drift for the currently existing circumstances. Then, the GSI value was systematically increased while keeping all the other parameters constant to determine the effect of the GSI value on this range of influence. Our series of numerical simulations revealed that a distance of 70 m is necessary to ensure the existence of a non-interaction zone between the stope and footwall drift at the Bakibaba Copper Mine. Our analyses also show that the GSI value of the rock mass has a significant effect on this non-interaction zone distance up to a GSI value of 55, after which higher GSI values do not increase the required non-interaction-zone distance.