


 Inglés (pdf)
 Articulo en XML
 Referencias del artículo
 Enviar articulo por email
 Citado por SciELO
  Citado por Google
  Similares en
SciELO
Similares en
SciELO  Similares en Google
 Permalink
The rainfall has a direct influence on the agricultural productivity, being indispensable the knowledge of its spatiotemporal behavior in order to establish trends that will assist in the management of water resources, agricultural planning, hydrological monitoring and prevention of natural disasters (Baú et al., 2013).
According to Blain (2010), climate trends are characterized by a significant change in the average climate element during the historical series in question. The precipitation regime over the different regions of South America are related to distinct factors from local to large scales (Reboita et al. 2010). The rainfall distribution and amount are also affected by the presence of the phenomena El Niño and La Niña (Berlato and Fontana, 2003).
To obtain the precipitation measurements, rain gauges or pluviographs are used, however, in large territorial extensions such as Brazil, the distribution of rain gauge stations does not cover the whole territory; in addition, isolated rainfall occurring in areas of a watershed may not be counted in the nearest rain gauge station (Franchito et al., 2009).
According to the World Meteorological Organization (WMO), rain gauge stations have a representative observation of 100 km2 coverage radius, however, in small-scale studies or local applications related to agriculture, the rain gauge station coverage range is 10 km2 (WMO, 2008).
The state of Goiás, in turn, has a conventional and automated monitoring network of 104 rain gauge stations of the National Water Agency (ANA, for its Portuguese acronym) and 48 stations of the National Meteorological Institute (INMET, for its Portuguese acronym) to an area of 340,111,376 km2 land area (IBGE, 2016). With the low density of weather stations, one of the possibilities to supply this information is through the use of satellite precipitation estimates datasets.
Although the satellite data are estimation and also subject to a variable magnitude of errors depending on the used sensor, region under investigation and other factors, the estimates can be used since they have two advantages compared to rain gauge stations: (i) higher achievement rate and ease of availability of information, mainly targeting the use in alert systems and flood control; (ii) production of information in the form of a spatial field of precipitation covering large areas (Paz and Collischonn, 2011).
In 1997, through a partnership between National Aeronautics e Space Administration (NASA) and the Japan Aerospace Exploration Agency (JAXA), the Tropical Rainfall Measuring Mission (TRMM) satellite was built and launched, which was able to get rainfall data in the tropical regions of the planet, especially through the use of passive and active microwaves (Kummerow et al., 1998). Among the main advantages of using precipitation data obtained by the TRMM satellite are its spatial and temporal resolutions, for instance the 3B42 algorithm with 0.25° by 0.25° for each 3 hours, covering 50°N to 50°S for 1998-present and freely available to the public (for more details access: http://trmm.gsfc.nasa.gov/).
Several studies, with the objective of evaluating the performance of TRMM satellite precipitation estimates, compared to in-situ observations, were performed over different regions of the globe such as Adler et al. (2001), Fisher (2004), Layberry et al. (2006), Sapiano and Arkin (2009) and Salio et al. (2014). In general, studies indicate that such performance varies according to the region and its rainfall regimes. Certain studies point to an overestimation of the precipitation coming from the TRMM satellite, specifically the algorithm 3B42, compared to the observed rain gauges measurements, such as Li et. al. (2014) in the Poyang Lake basin which is located in the middle of the Yangtze River in China; Almazroui (2011) in Saudi Arabia and Behrangi et al. (2011) in the Siloam River basin south of Siloam Springs, Arkansas. Others report an underestimate, such as Chen et al. (2013) over Taiwan Island; Dinku et al. (2007) over Ethiopia in the Horn Africa and part of Colombia in South America.
Notwithstanding, further studies are needed to assess the quality and the limitation of precipitation data from satellites, aiming to distinguish and quantify their uncertainties for proper application of these products to each study area (Kummerow et al., 2000; Kurtzman et al., 2009; Karaseva et al., 2011).
Taking into account that the precipitation is a climatic element of high variability and that in Santo Antônio de Goiás, the performance of several research is focused on the rural development through the EMBRAPA - Rice and Beans unit, this study aimed to evaluate the climatic rainfall seasonality as well as the accuracy of TRMM satellite precipitation estimates in relation to the gauge-based rainfall measurements for the Santo Antônio de Goiás-GO county.
MATERIALS AND METHODS
The study was conducted in Santo Antônio de Goiás - GO. According to Köppen, the climate is Aw, tropical of savanna, megathermal. The rain regime is well defined in the rainy (October to April) and dry (May to September) seasons, with an annual average of 1498 mm (Silva et al., 2014). Daily rainfall data were obtained from the pluviometric station of the Brazilian Agricultural Research Corporation - (EMBRAPA - Rice and Beans) located in Santo Antônio de Goiás - GO, with latitude of 16°28'00'' (S), longitude of 49°17'00" (W) and altitude of 823 m.
For the seasonal distribution precipitation analysis at the Santo Antônio de Goiás city, a historical series of precipitation was used from 01/01/1983 to 12/31/2015, where the confidence intervals were calculated with 95% probability.
The TRMM satellite rainfall estimates were obtained through the Interactive Online Visualization and analysis Interface (Giovanni, https://giovanni.sci.gsfc.nasa.gov/giovanni) platform. Daily data from the 3B42 Version 7 (V7) and Real Time (RT) were acquired. The data from the 3B42 V7 algorithm are available since January, 1998, and from the 3B42 RT, since March, 2000. Thus, two distinct periods of evaluations were adopted: i) from January, 1998 to October, 2015 for the algorithm 3B42 V7, and ii) from March, 2000 to October, 2015 for the algorithm 3B42 RT.
The comparison of punctual gauge-based precipitation measurements (Po: observations) with the TRMM satellite precipitation estimates (Pe: estimated), at daily temporal resolutions were transformed into total decennial, monthly, and annual, in order to intercompare the distinct products (Pe vs. Po) in quantifying the precipitation under those accumulated temporal scales.
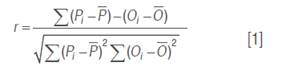
In order to verify the performance of the satellites estimates, the Pearson coefficient, r (Equation 1) is calculated. The r measures the degree of correlation and ranges between -1 and 1, which 1 means a perfect positive correlation between the two variables and when -1, means a perfect negative correlation between the two variables, that is, if one increases the other always decreases and when 0 means that the two variables do not depend linearly on each other.
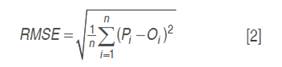
To quantify the magnitude of the uncertainties in the satellite estimates compared to the observed, the Root Mean Square Error (RMSE) represented by equation 2 was used.
The accuracy is related to the distancing of the estimated values in relation to the observed and was given statistically by the concordance index "d" proposed by Willmott et al. (1985). Their values range from zero (no agreement), to 1 (for perfect agreement). The “d” index is given by equation 3:
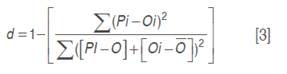
Where: Pi is the TRMM satellite rainfall estimation (mm) at time interval i; Oi = observed precipitation (mm) over a given time interval i; N = number of data analyzed; = TRMM satellite precipitation estimation average (mm); and  is the gauge-based precipitation average (mm).
According to Camargo and Sentelhas (1997), the following statistical indicators to correlate the estimated values with those measured were considered: accuracy - Willmott "d" index and confidence or performance.
The "c" index is computed according to equation 4:
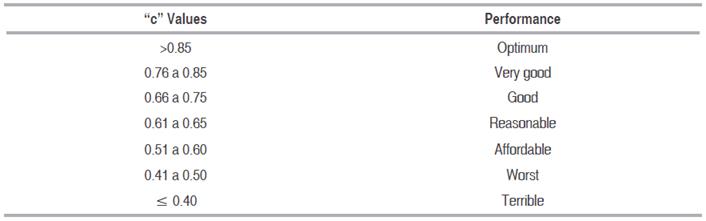
According to the value found in equation 4, they are classified according to Table 1.
Table 1 Performance classification of the estimation of agricultural productivity methods by the “c” index. Source: Camargo and Sentelhas (1997).
RESULTS AND DISCUSSION
Figure 1 shows the variation in the annual rainfall in the region of Santo Antônio de Goiás from 1983 to 2015. Analyzing the time series occurred between 1983 and 2015 with the estimated annual average rainfall of 1498 mm, it is clear that only in seven years there were rainfall indices approaching the climatological normal. Precipitation was below the average for 15 years and above the average for 10 years. These oscillations occurring in the annual precipitation in the region may be associated with the El Niño-Southern Oscillation (ENSO), an atmospheric-oceanic phenomenon of large scale, characterized by anomalies in the surface temperature (SST) in the equatorial Pacific Ocean. During the negative phase (La Niña), the rainfall pattern are generally below the climatological normal, and in the positive phase (El Niño), they are usually higher than the normal (Grimm et al., 1998). The year with the highest accumulated rainfall was 2009 (1978 mm) and the driest year was 2007, with 1018 mm. However, the higher annual total precipitation variability was observed between 2002 and 2015.
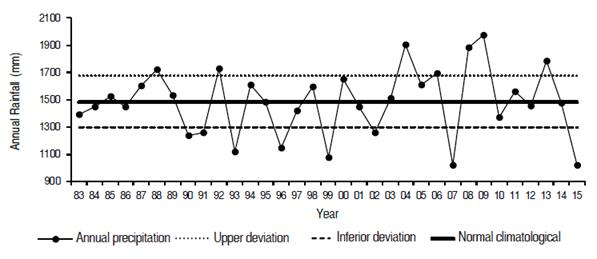
Figure 1 Annual rainfall Variability and its minimum and maximum confidence intervals at Santo Antônio de Goiás count, during the period from 1983 to 2015.
Figure 2 shows the annual cycle of precipitation between 1998 and 2015 recorded in the rain gauge, estimated by the 3B42 V7 and RT algorithms for the period from 1998-2015 and 2000-2015, respectively, as well as the annual cycle of precipitation for the period from 1983 to 2015. The satellite precipitation estimates (3B42 V7 and RT) presented a similar behavior compared to the gauged precipitation, clearly identifying the rainy and dry periods at the study location. The annual cycle of precipitation from 1998 to 2015 was 4.1% above the climatological normal. The 3B42 V7 (3B42 RT) precipitation estimates presented higher (lower) monthly totals at about 5.3% (0.5%) compared to the climatological normal.
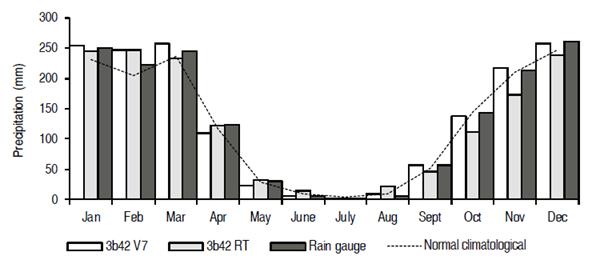
Figure 2 Annual comparison of rainfall for the period between 1998 and 2015, observed in the pluviometric station, estimated by satellite and the climatological normal.
Seasonally, the 3B42 V7 algorithm overestimated at around 1.5% during the rainy season and underestimated at around 3.7% during the dry compared to the monthly mean observed precipitation. On the other hand, the 3B42 RT algorithm underestimated 6% in the rainy season and overestimated 12.64% in the dry period.
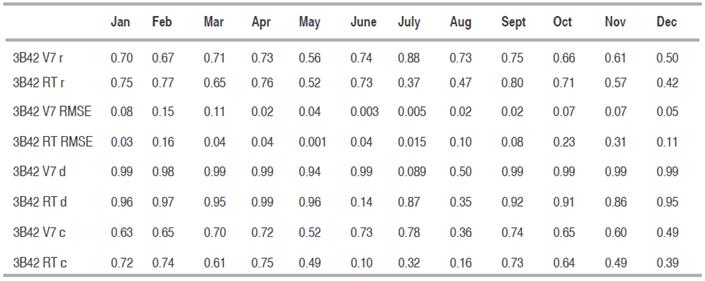
The months of June, September and October presented an index c with performance classified by Camargo and Sentelhas (1997), as very good. The months of January, February, April, May, July and December were classified as good and March as median. The performance during November and August were classified as Affordable and Terrible, respectively. Table 2 shows the results also showed that the 3B42 RT algorithm and the gauged precipitation obtained a high and significant correlation coefficient (at around 0.88) with the indexes of performance classified as very good, good and medium from January to June and for September, October and December. Only in the months of July, August and November the precipitation estimates were lower, with values around 0.15, 0.28 and 0.14, respectively.
Table 2 Statistical analysis of the monthly annual precipitation observed in the rain gauge station against the precipitation estimates from the 3B42 V7 and RT algorithms for the period from January 1998 to December 2015 and from January 2000 to December 2015, respectively.
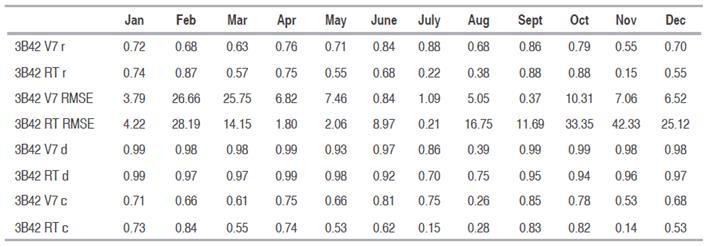
Figure 3 shows the monthly histograms of the observed rainfall in contrast with the estimated by the 3B42 V7 algorithm for the period from January 1998 to December 2015. During the rainy season from October to April, the 3B42 V7 algorithm overestimates at around 3.5% the observed precipitation. In this period, the correlation coefficient recorded an average value of 0.55 to 0.76, RMSE of 6.52 to 26.66 mm and concordance index of 0.98 to 0.99. In the dry season, during the months from May to September, the 3B42 V7 algorithm underestimates the precipitation at around 2.84% compared to the rain gauge. The correlation coefficient in this period had an average value of 0.68 and 0.88. The RMSE ranged from 0.84 to 7.46 mm and concordance index presented satisfactory values along the year, except for August, which showed a concordance index of 0.55.
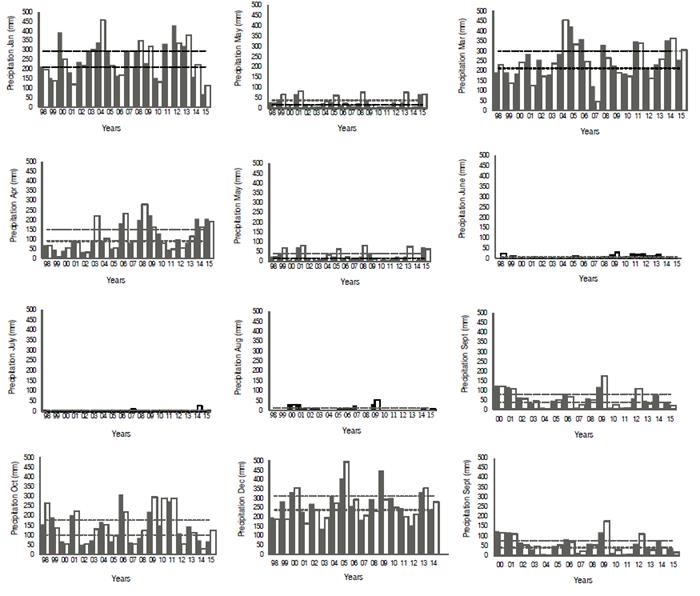
Figure 3 Comparison between the monthly rainfall estimated by the 3B42 V7 algorithm versus the recorded in the rain gauge, during the period from January, 1998 to December, 2015. Dashed lines indicate the maximum and minimum limits of precipitation.
These results according with Collischonn et al. (2007), who evaluated the 3B42 algorithm over the Paraguay River basin and found correlation coefficient ranging from 0.25 to 0.64, considered acceptable by the authors. The study also showed that there is a tendency for the satellite to overestimate precipitation by around 8%. Pereira et al. (2013) showed values 9% higher than the TRMM satellite estimates in the central region of Brazil.
Figure 4 shows the rainfall histograms obtained by the algorithm 3B42 RT compared with the rain gauge station. The algorithm Real Time presented precipitation estimates 3.9% lower in the rainy season, with RMSE of 21.31 mm, 0.64 correlation and concordance index of 0.98. In the dry season, precipitation estimates overestimated by 14.47%. On the other hand, during the dry season, the precipitation estimation indicated lower values of performance between the months of July and August (Table 3).
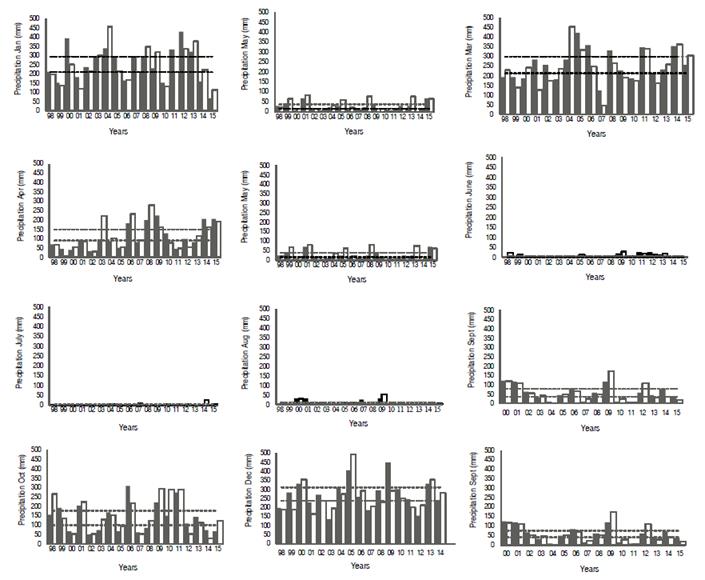
Figure 4 Same as Figure 3, but for the 3B42 RT algorithm and for the period from January, 2000 to December, 2015.
Table 3 Statistical analysis of the monthly time precipitation observed in the rain gauge station against the precipitation estimates from the 3B42 V7 and RT algorithms for the period from January 1998 to December 2015 and from January 2000 to December 2015, respectively.
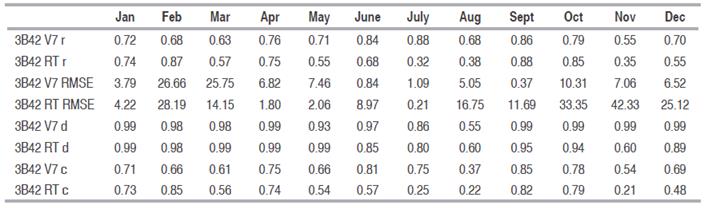
Figure 5 shows the scatter plot of the ten-day precipitation with confidence intervals at 95%. In the rainy season, only the month of February presented data within the confidence interval; in the months of October, November, December, January, March and April, the precipitation estimated by the algorithm 3B42 V7 overestimated the values by 4%. The correlation coefficient presented results between 0.50 and 0.71 and median performance classification except in the month of December, which presented values of 0.49.
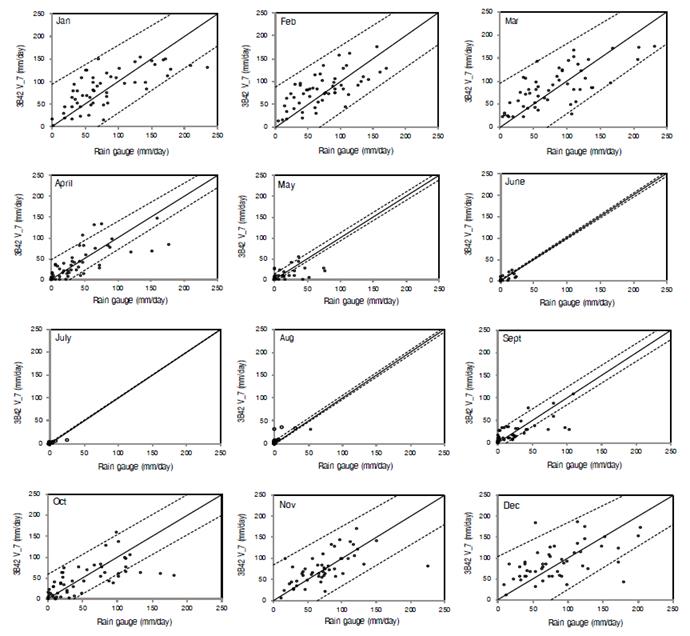
Figure 5 Scatter plot between the ten-day observed precipitation against the 3B42 V7 precipitation estimates by, from January 1998 to December 2015.
The average correlation of the ten-day precipitation in the rainy season was 0.65, RMSE of 0.07 mm and concordance index of 0.98. In the dry season, the satellite underestimated the precipitation by 8.69%, the average correlation was of around 0.73, RMSE of 0.01 mm and 0.68 concordance index. However, according to Nobrega, et al. (2008) and Woldemeskel, et al. (2013), indicate that correlation indexes between 0.5 and 0.8 could be classified as good results.
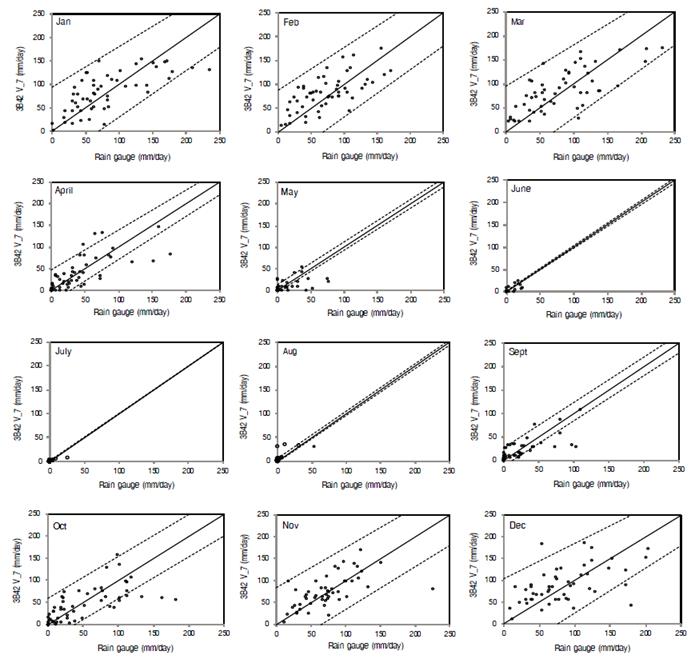
Figure 6 Scatter plot between the ten-day observed precipitation against the 3B42 RT precipitation estimates by, from January 1998 to December 2015.
In the rainy season, the satellite precipitation estimates underestimated in 5.54% in relation to the precipitation registered in the rainy season. The correlation index ranged from 0.42 to 0.76, RMSE 0.03 to 0.23. In this period the agreement index of the precipitation estimate ranged from 0.86 to 0.99. However, during the months of November and December, the performance was relatively week, with values around 0.49 and 0.39. In the dry season, the rainfall was overestimated by 9.31%, with a correlation of around 0.37 to 0.80, RMSE of 0.001 to 0.10 mm and concordance index of 0.14 to 0.96. Lastly, in the dry period, the precipitation was overestimated by 9.31%. Satisfactory statistical results were found in April and September months, with values around 0.76 and 0.80. During the months of May to August the algorithm 3B42 RT did not show favorable results, for instance r presented values of 0.52 and 0.47, respectively (Table 4). The RMSE values found in this study were very similar to those of Dinku et al. (2007) in Ethiopia, where the relative RMSE was around 25%.
CONCLUSIONS
This work evaluated the performance of TRMM satellite precipitation estimates, from 3B42 V7 and RT algorithms against the gauge-based precipitation as a reference located a Santo Antônio de Goiás, GO. Initially, a general investigation of the interannual precipitation regime from 1983-2015 was performed. Secondly, the period from 1998-2015 (2000-2015) was taken for the 3B42 V7 (3B42 RT) performance evaluations.
The performance of 3B42 V7 and RT algorithms against to the measured rainfall showed that the algorithm 3B42 V7 presented higher reliability statistical skills than the 3B42 RT algorithm.
On an annual, monthly and decennial time scales, an overestimation of the satellite precipitation estimates from 3B42 V7 algorithm were observed during the rainy season, where the precipitation estimates showed a greater proximity indexes on annual scale. In the dry period, the precipitation estimates obtained by 3B42 V7 were below than observed at the rain gauge. The monthly scale presented the lowest value of underestimations. Although the satellite precipitation showed both overestimate and underestimate trends, a good agreement in represent the precipitation regime at different time scales were observed. In addition, the satellite data showed to be a good complementary data source for agricultural applications with a lack of surface precipitation measurements over the region.

