


 Inglés (pdf)
 Articulo en XML
 Referencias del artículo
 Enviar articulo por email
 Citado por SciELO
  Citado por Google
  Similares en
SciELO
Similares en
SciELO  Similares en Google
 Permalink
INTRODUCTION
During the last decade, the harvested area of avocado cv. Hass in Colombia increased by 263%, from 21,592 ha (2010) to 63,534 ha (2020); in this same period, production varied from 205,443 t to 876,754 t (326 % increase) (FAO, 2022). However, this yield is less than the potential avocado yield (32.5 t ha-1), which has a global average yield of 9.98 t ha-1 (Gazit and Degani, 2007; FAO, 2022).
At the commercial level, grafting is the most widely used multiplication technique in avocado cultivation to obtain new plants and propagate existing varieties (Téliz and Mora, 2015; Bernal and Díaz, 2020). It is an ancient horticultural practice for asexual plant propagation, defined as the natural or deliberate fusion of plant parts that join the rootstock (root segment) of one plant to the scion (shoot segment) of another; the resulting composite organism functions as a single plant (Yassin and Hussen, 2015; Habibi et al., 2022). Grafting offers advantages, including modification of the canopy architecture, increased production, reduced juvenile stage, adaptation of cultivars to unfavorable environmental conditions, and development of resistance traits to pests and diseases (Habibi et al., 2022). The following aspects should be considered during grafting: incompatibility, plant species and type of graft, environmental conditions during and following grafting, growth activity of rootstock and grafting skills (Davies et al., 2018; Reyes-Herrera et al., 2020). Graft compatibility/incompatibility is defined as the ability of two plants to join and develop as a compound plant (Chen et al., 2016) successfully or unsuccessfully. The difference between compatible and incompatible grafting is not well-defined because it includes not only species that are closely related and join easily but also totally incompatible species (Belmonte-Ureña et al., 2020). Graft incompatibility is differentiated from graft failure, which often results from environmental factors or a lack of skills in the grafter. When grafting conditions are ensured, graft incompatibility can be attributed to other factors, such as failure of the rootstock and scion to join, failure of the grafted plant to grow, or premature death of either the rootstock or scion after grafting (Andrews and Serrano, 1993).
There are many reasons why rootstock affects scion fruit quality. The most obvious is rootstock/scion incompatibility, which induces undergrowth and/or overgrowth of the scion, leading to decreased water and nutrient flow through the grafted union, ultimately causing wilting (Davis et al., 2008a). Scion-rootstock incompatibility limits grafting. It can be caused by many factors, including insufficient genetic proximity, physiological or biochemical factors, lignification at the graft union, poor graft architecture, insufficient cell recognition between the union tissues, and metabolic differences in the stem and rootstock (Habibi et al., 2022). Nevertheless, rootstock/scion combinations should be carefully selected for specific climatic and geographic conditions to get positive effects on quality (Davis et al., 2008b).
According to Davies et al. (2018), the evidence of compatibility between rootstock and scion is defined, among other things, by excessive callus development and the difference between the diameters of the rootstock and scion. This difference is caused by the physiological incompatibility between the scion and rootstock (Herrera-Gonzálezet al., 2013; Albacete et al., 2015). Rootstocks have an important effect on the nutrition and behavior of the grafted aerial part (Salazar-García et al., 2011). The results of the rootstock can go further, influencing some scion properties, such as sensory and nutritional quality in fruits, including texture, sugar content, acidity, pH, flavor, fruit color (Giorgi et al., 2005; Gullo et al., 2014; Balducci et al., 2019), tolerance to cold and pests, and resistance to pathogens (Rubio et al., 2008; Goldschmidt, 2014).
Clearly, the scion variety affects the final size, yield, and quality of fruits in grafted plants, but rootstock effects can drastically alter these characteristics (Davis et al., 2008a). Information on graft compatibility/incompatibility is essential for grafted fruit trees when establishing commercial orchards. There are many conflicting reports on changes in fruit quality resulting from grafting. The differences in reported results may be attributable in part to different production environments, type of rootstock/scion combination used, and harvest date (Davis et al., 2008b). The present study aimed to determine the effect of compatibility/incompatibility between the rootstock and crown on tree architecture, nutritional quality of fruits, and nutrient content in leaves in avocado cultivar Hass in Colombia.
MATERIALS AND METHODS
Location
This research was conducted in three commercial orchards with avocado (Persea americana) cv. Hass grafted over rootstock with an Antillean origin. The first orchard was in the municipality of Rionegro (Antioquia), with an average elevation of 2,200 m a.s.l.; the second orchard was in the municipality of El Peñol (Antioquia), with an average elevation of 2,100 m a.s.l., and the third orchard was in the municipality of Anserma (Caldas) at 2,000 m a.s.l. The climatic variables were recorded with a portable weather station, WatchdogTM 2000 (PCE Ibérica S.L., Albacete, Spain) and are shown in figures 1A and 1B.
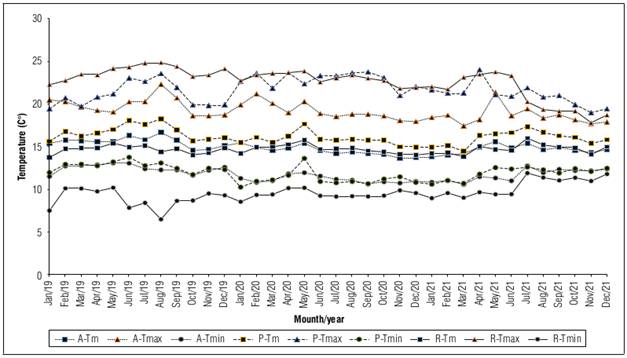
Figure 1A. Monthly maximum (Tmax), minimum (Tmin) and mean (Tm) temperatures in Anserma (A), Peñol (P) and Rionegro (R) 01/01/2019 to 31/12/2021.

Experiment design
An experiment design with subdivided plots and five replicates was used. The blocking factor was made up of the harvest seasons, called 2019P, 2020T, 2020P, 2021T, and 2021P, where P corresponded to the main harvest, and T was the secondary or Traviesa harvest. The main plot was made up of the location (Anserma, El Peñol, and Rionegro), and the subplot was the compatibility treatment between the rootstock and the scion (compatible and incompatible). The experiment unit consisted of 15 ‘Hass’ avocado trees, established at 7×7 m (204 plants/ha) in 2013. Avocado trees were propagated with tip grafting (approximately 30 cm from the root neck), with a scion bud of cv. Hass and a minimum of five growth points (standard procedure). The scion origin was unknown but was assumed to be a commercial clone with uniform characteristics. The compatible treatment was defined as those trees, nine years old, where the rootstock and scion diameter recorded at 5 cm from the graft scar showed a difference equal to or close to one. On the other hand, the incompatible treatment was defined as those trees where the rootstock and scion diameter recorded at 5 cm from the graft scar showed a difference of less than or greater than one.
Soil analysis
The soil nutrient availability was carried out after each harvest (2019P, 2020T, 2020P, 2021T, 2021P). Subsamples below the tree canopy and at a depth of 0-30 cm were taken for chemical analysis. The results of the soil analysis are presented in table 1.
Table 1. Chemical soil characteristics in Anserma, Peñol, and Rionegro.
| Treatment | pH | EC (dS m-1) | OM (%) | P | S | CEC | Ca | Mg | K | Fe | Cu | Mn | Zn | B |
|---|---|---|---|---|---|---|---|---|---|---|---|---|---|---|
| (mg kg-1) | (cmol kg-1) | (mg kg-1) | ||||||||||||
| Location | ||||||||||||||
| Anserma | 5.9 | 0.8 | 8.1 | 88.2 | 35.2 | 14.9 | 10.5 | 3.7 | 0.7 | 111.5 | 6.5 | 18.4 | 58.9 | 1.6 |
| Peñol | 6.0 | 0.7 | 6.7 | 108.8 | 49.6 | 12.8 | 10.4 | 1.6 | 0.8 | 123.0 | 4.4 | 12.9 | 42.7 | 20.2 |
| Rionegro | 5.5 | 1.3 | 14.2 | 106.4 | 84.3 | 14.3 | 10.1 | 2.8 | 0.9 | 168.0 | 10.3 | 13.8 | 88.5 | 2.2 |
| Harvest | ||||||||||||||
| 2019P* | 5.8 | 0.8 | 11.3 | 131.5 | 54.9 | 15.1 | 11.1 | 2.8 | 1.0 | 185.4 | 8.2 | 11.4 | 78.2 | 7.0 |
| 2020P | 5.8 | 0.9 | 5.2 | 82.1 | 51.8 | 13.7 | 10.6 | 2.3 | 0.6 | 103.6 | 6.8 | 16.2 | 57.4 | 1.5 |
| 2020T** | 5.8 | 1.0 | 9.4 | 59.9 | 48.9 | 13.6 | 10.1 | 2.3 | 0.9 | 111.8 | 5.5 | 19.2 | 38.1 | 1.6 |
| 2021T | 5.8 | 1.1 | 12.7 | 131.1 | 69.8 | 13.7 | 9.5 | 3.4 | 0.6 | 135.8 | 7.8 | 13.5 | 79.9 | 21.8 |
| Mean | 5.8 | 0.9 | 9.7 | 101.1 | 56.4 | 14.0 | 10.3 | 2.7 | 0.8 | 134.2 | 7.1 | 15.1 | 63.4 | 8.0 |
*P - Main harvest (November-January). **T - Secondary harvest or Traviesa (September - October). EC: electric conductivity. OM: soil organic matter. CEC: cation exchange capacity.
Tree growth
Annually (2019, 2020, and 2021) and in each of the 15 trees per treatment and per location, the variables tree height (TH), rootstock height (RH), rootstock diameter (RD), scion stem diameter (SSD), rootstock diameter/scion stem diameter relation (RD/SSD), rootstock/scion scare diameter (RS), scion height (SH), canopy diameter (CD), and canopy volume (TCV) were recorded according to Cardona and Fernández (2005).
Mineral fruit composition
For the evaluation of the concentration of nutrients, 25 fruits were randomly taken per treatment (compatible and incompatible) at each location (Anserma, Peñol, Rionegro) and each harvest (2019P, 2020T, 2020P, 2021T, 2021P) with approximately 24% of dry material. Subsequently, the fruit structures were individualized, removing the peel, pulp, seed coat, and seed. All the fruit components were dried until a constant weight was reached in forced air ovens at 60ºC. After drying, all fruit components were milled to determine N (EPA method 351.3) (Waltz, 1996), P, K, Ca, Mg, Cl, S, Fe, Cu, Mn, Zn (inductively coupled plasma atomic emission spectrometer iCAP 7000 Plus (Thermo Scientific, Waltham, MA)), and B according to modified NTC 5404 (ICONTEC, 2011), by treatment and harvest in each location.
Mineral leaf composition
Four leaves per tree were selected for the analysis of leaf tissue, one at each cardinal point. The fifth leaf of the last growth flow was collected after each harvest (P2019, T2020, P2020, T2021, P2021). The leaf was mature but not senescent, without fruiting, healthy (without physical or chemical damage or affected by pests or diseases), and older than three months, according to the methodology proposed by Maldonado (2002). The leaves were washed with distilled water and dried at 60°C for 48 h in an oven with forced air circulation, Memmert UL 80 (Memmert GmbH + Co. KG, Büchenbach, Germany), or until a constant weight was reached. Next, they were milled, placed in paper bags, and sent for analysis to determine the total contents of N (EPA method 351.3) (Waltz, 1996), P, K, Ca, Mg, Cl, S, Fe, Cu, Mn, Zn (inductively coupled plasma atomic emission spectrometer iCAP 7000 Plus (Thermo Scientific, Waltham, MA)), and B according to modified NTC 5404 (ICONTEC, 2011).
Nutrient balance index
To determine the nutritional levels according to the nutrient balance index (NBI), the methodology developed by Keenworthy in 1973 and applied by Salazar-García and Lazcano-Ferrat (2003) in ‘Hass’ avocado was used. For this, the nutrient leaf analysis results were used to determine the balance index (B) for each mineral element, according to equations (1) and (2).
Equation 1. If the value reported in the laboratory (X) was less than the standard value:
Equation 2. If the value reported in the laboratory (X) was greater than the standard value:
where, S = standard value, I = influence of the variation, P = percentage of the standard, CV = coefficient of variation and B = balance index. Standard values (S) and coefficients of variation (CV) were used according to Palacios in 1986 and Embleton and Jones in 1966, compiled by Salazar-García and Lazcano-Ferrat (2003).
Statistical analysis
The statistical analyses were carried out with the “agricolae” package in the R project statistical environment software (R Core Team, 2021). The data were analyzed with two-way analysis of variance in subdivided plots (4×2) for the treatments, with a blocking factor per harvest (5). The differences between the means were evaluated with analysis of variance, followed by Tukey's HSD mean comparison test, with a probability greater than 95%. In addition, R Core Team statistical software, ade4 and car procedures, and a principal component analysis (PCA) were used to identify the relationship between location, harvest season, and soil fertility.
RESULTS
Soil description
According to table 1, the Rionegro soil in both situations (with and without affinity/compatibility) presented strongly acid soils, as compared to the El Peñol soil, which was less acid. The organic matter content was high in Rionegro and medium to high in El Peñol (Jaramillo, 1995). The calcium contents in all samples were between high and very high. The magnesium concentrations were similar in all the evaluated sites, with medium to low ranges, optimal for avocado cultivation for between 2 and 3 units. The potassium contents were high in all locations. For minor elements, very high contents of iron, medium to high for manganese and zinc, and medium to low for copper and boron were recorded.
Soil principal component analysis (ACP)
Figure 2 presents the principal component analysis for the chemical variables of the soils where the tests were established in the three locations (Fig. 2A) for the lots where compatible and incompatible trees were identified (Fig. 2B). According to ACP confidence ellipses for both locations and treatment, there were no differences in the chemical composition between the locations (Anserma, Rionegro, and Peñol), as well as for compatible and incompatible treatments. The soils presented similar conditions in their chemical attributes during the 3 years of the evaluation (2019-2021). The three locations had Andisol soils although one of the locations (Anserma) was in a different department. The contents of the interchangeable bases and minor elements were very similar in the three locations in general terms.

Tree growth
Table 2 shows the mean values for the compatible and incompatible tree growth variables in the three locations (Anserma, Peñol, and Rionegro). Statistical differences between the locations were seen for all tree growth variables: TH (P=0.0408), RH (P=0.295), RD (P=0.0103), SSD (P=0.00493), RD/SSD (P=0.00103), RS (P=0.00203), SH (P=0.0475), CD (P=0.276) and TCV (P=0.0491). Statistical differences were found between the compatibility treatments for the variables RH (P=0.00481), RD (P=1.23E-08), SSD (P=0.00187), RD/SSD (P=0.366), CD (P=0.00207) and CVT (P=0.0274). It is noteworthy that the locality (L) × compatibility (C) interaction did not present significant differences (P>0.05) for any of the variables of this group.
For RD/SSD, the compatible trees, on average, presented a value of 1.012, which indicated similarity between the diameter of the rootstock and the diameter of the scion stem. In contrast, the incompatible trees presented a value of 0.907, indicating that SSD was greater than RD, which confirmed the excellent selection of experimental individuals based on the definition of compatible and incompatible.
Table 2. Effect of rootstock/scion compatibility on the growth variables in varieties ‘Hass’ assessment for three locations in Colombia. Values are averages of 3 years (2019-2021).
| Treatment | TH (m) | RH (cm) | RD (cm) | SSD (cm) | RD/SSD | RS (cm) | SH (m) | CD (m) | TCV (m3) |
|---|---|---|---|---|---|---|---|---|---|
| Location | |||||||||
| Anserma | 4.36 b | 19.0 a | 22.7 b | 26.2 a | 0.95 b | 27.5 b | 4.17 b | 5.48 a | 12.0 b |
| Peñol | 5.33 a | 20.3 a | 21.5 a | 21.2 b | 1.00 a | 26.3 b | 5.13 a | 5.99 a | 16.4 a |
| Rionegro | 4.93 ab | 19.9 a | 26.1 a | 26.2 a | 1.03 a | 32.4 a | 4.73 ab | 6.00 a | 14.5 ab |
| Rootstock/scion relationship | |||||||||
| Compatible | 5.08 a | 0.210 a | 25.2 a | 25.0 a | 1.01 a | 29.1 a | 4.87 a | 6.09 a | 15.7 a |
| Incompatible | 4.93 a | 0.188 b | 22.0 b | 24.3 b | 0.91 b | 28.9 a | 4.74 a | 5.73 b | 14.4 b |
TH: tree height. RH: rootstock height. RD: rootstock diameter. SSD: scion stem diameter. RD/SSD: rootstock diameter/ scion stem diameter relation. RS rootstock/scion scare. SH: scion height. CD: canopy diameter. TCV: tree canopy volume. Values with similar letters for each variable within location or rootstock/scion relation are significantly different (HSD, P<0.05).
The compatibility treatment did not affect the trees' total height nor the scion (graft) height, which reached 5 m and 4.8 m, respectively. However, the compatibility treatment affected the canopy diameter and the canopy volume. The compatible trees presented 6% more in the DD and TCV than the incompatible trees; the latter had fewer voluminous canopies (Tab. 2). Rionegro and Peñol had the best tree development, with a greater RD, SSD, TCV, and TH than Anserma.
Mineral fruit composition
Tables 3, 4, 5, and 6 show the nutritional content of each tissue in the avocado fruits. For the seed (Tab. 3), seed coat (Tab. 4), pulp (Tab. 5), and shell (Tab. 6), most of the determined mineral elements only had statistical differences for locality. While, for the compatible and incompatible treatment, no differences were observed in all tissue nutrient contents, except for the concentration of Zn in pulp and Cu in the seed. In general, the compatibility/incompatibility between the rootstock and the scion did not affect the nutritional content in these tissues. For seed coat, in addition to the differences between locations, differences were observed for N, Mg, Na, Cu, and Zn for the treatments. In all elements, the compatible trees presented the highest values for each mineral element (Tab. 4). For the locality × treatment interaction, no differences existed for any of the nutrients.
Table 3. Effect of rootstock/scion compatibility on the ‘Hass’avocado seed mineral composition assessment for three locations in Colombia. Values are averages of 3 years (2019-2021).
| Treatment | N | P | K | Ca | Mg | S | Fe | Cu | Mn | Zn | B |
|---|---|---|---|---|---|---|---|---|---|---|---|
| % | (mg kg-1) | ||||||||||
| Location | |||||||||||
| Anserma | 0.94 a | 0.14 a | 1.2 a | 0.08 a | 0.12 a | 0.08 a | 21.4 a | 6.3 a | 24.5 a | 17.7 a | 68.3 a |
| Peñol | 0.88 a | 0.12 a | 0.96 b | 0.08 a | 0.09 ab | 0.07 ab | 19.1 a | 4.3 ab | 17.3 a | 15.6 a | 35.8 b |
| Rionegro | 0.63 a | 0.07 b | 1.1 ab | 0.08 a | 0.07 b | 0.05 b | 19.1 a | 3.5 b | 12.3 a | 12.3 a | 26.7 b |
| Rootstock/scion relationship | |||||||||||
| Compatible | 0.80 a | 0.10 a | 1.04 a | 0.07 a | 0.08 a | 0.06 a | 17.8 a | 4.08 b | 16.15 a | 16.71 a | 40.64 a |
| Incompatible | 0.82 a | 0.11 a | 1.06 a | 0.09 a | 0.10 a | 0.06 a | 21.9 a | 5.36 a | 19.91 a | 13.68 a | 46.59 a |
Values with similar letters for each nutrient within location or rootstock/scion relationship are significantly different (HSD, P<0.05).
Table 4. Effect of rootstock/scion compatibility on ‘Hass’ avocado seed coat mineral composition assessment for three locations in Colombia. Values are averages of 3 years (2019-2021).
| Treatment | N | P | K | Ca | Mg | S | Fe | Cu | Mn | Zn | B |
|---|---|---|---|---|---|---|---|---|---|---|---|
| % | (mg kg-1) | ||||||||||
| Location | |||||||||||
| Anserma | 1.07 a | 0.13 a | 1.28 a | 0.12 b | 0.14 a | 0.09 a | 30.30 a | 7.56 a | 27.91 a | 30.70 a | 61.3 a |
| Peñol | 0.85 a | 0.09 ab | 1.38 a | 0.19 ab | 0.17 a | 0.09 a | 41.33 a | 8.28 a | 34.32 a | 32.48 a | 58.6 a |
| Rionegro | 0.74 a | 0.06 b | 1.21 a | 0.26 a | 0.14 a | 0.07 a | 34.54 a | 4.97 b | 26.54 a | 25.00 a | 44.9 a |
| Rootstock/scion relationship | |||||||||||
| Compatible | 0.93 a | 0.1 a | 1.29 a | 0.20 a | 0.16 a | 0.09 a | 37.05 a | 7.57 a | 31.41 a | 32.57 a | 62.7 a |
| Incompatible | 0.84 b | 0.09 a | 1.3 a | 0.20 a | 0.14 b | 0.08 a | 33.73 a | 6.3 b | 27.77 a | 26.22 b | 47.2 a |
Values with similar letters for each nutrient within location or rootstock/scion relationship are significantly different (HSD, P< 0.05).
Table 5. Effect of rootstock/scion compatibility on ‘Hass’ avocado pulp mineral composition assessment for three locations in Colombia. Values are averages of 3 years (2019-2021).
| Treatment | N | P | K | Ca | Mg | S | Fe | Cu | Mn | Zn | B |
|---|---|---|---|---|---|---|---|---|---|---|---|
| % | (mg kg-1) | ||||||||||
| Location | |||||||||||
| Anserma | 0.96 a | 0.16 a | 1.74 a | 0.05 a | 0.10 a | 0.11 a | 26.15 a | 6.20 a | 5.89 a | 17.93 a | 65.8 a |
| Peñol | 0.99 a | 0.13 ab | 1.60 ab | 0.09 a | 0.11 a | 0.10 ab | 25.55 a | 5.85 a | 7.82 a | 16.47 a | 44.7 b |
| Rionegro | 0.71 b | 0.09 b | 1.50 b | 0.09 a | 0.10 a | 0.07 a | 22.03 a | 3.61 b | 5.64 a | 13.08 a | 27.6c |
| Rootstock/scion relationship | |||||||||||
| Compatible | 0.90 a | 0.13 a | 1.61 a | 0.07 a | 0.10 a | 0.09 a | 23.49 a | 5.23 a | 5.86 a | 16.71 a | 46.6 a |
| Incompatible | 0.87 a | 0.13 a | 1.62 a | 0.08 a | 0.10 a | 0.09 a | 25.66 a | 5.22 a | 7.04 a | 14.95 b | 45.5 a |
Values with similar letters for each nutrient within location or rootstock/scion relationship are significantly different (HSD, P<0.05).
Table 6. Effect of rootstock/scion compatibility on ‘Hass’ avocado peel mineral composition assessment for three locations in Colombia. Values are averages of 3 years (2019-2021).
| Treatment | N | P | K | Ca | Mg | S | Fe | Cu | Mn | Zn | B |
|---|---|---|---|---|---|---|---|---|---|---|---|
| % | (mg kg−1) | ||||||||||
| Location | |||||||||||
| Anserma | 0.95 a | 0.11 a | 1.20 a | 0.07 b | 0.09 a | 0.061 a | 45.88 a | 6.41 a | 8.61 a | 19.50 a | 73.70 a |
| Peñol | 0.92 a | 0.10 a | 1.19 a | 0.12 a | 0.09 a | 0.061 a | 45.88 a | 6.41 a | 8.61 a | 19.50 a | 73.70 a |
| Rionegro | 0.75 b | 0.07 a | 1.17 a | 0.15 a | 0.09 a | 0.048 a | 27.99 a | 5.78 a | 8.60 a | 19.18 a | 38.15 c |
| Rootstock/scion relationship | |||||||||||
| Compatible | 0.85 a | 0.09 a | 1.19 a | 0.11 a | 0.09 a | 0.059 a | 38.07 a | 6.50 a | 8.57 a | 20.54 a | 55.08 a |
| Incompatible | 0.89 a | 0.09 a | 1.18 a | 0.12 a | 0.09 a | 0.057 a | 35.95 a | 6.54 a | 8.76 a | 20.08 a | 55.06 a |
Values with similar letters for each nutrient within location or rootstock/scion relationship are significantly different (HSD, P< 0.05).
For the fruit nutritional composition according to compatibility treatment, table 7 shows the mean values of the mineral nutrient content in the fruits and each tissue. For N and B, the contents were similar for the peel, pulp, seed coat, and seed. The seed coat had the highest values for the rest of the nutrients. Generally, the peel and pulp did not differ in the nutrients. On the other hand, except for Zn, compatibility did not affect the nutritional content of the peel, pulp, seed coat, and seed, which presented similar values regardless of whether the trees were compatible or incompatible.
Table 7. Effect of rootstock/scion compatibility on ‘Hass’avocado fruit mineral composition assessment for three locations in Colombia. Values are averages of 3 years (2019-2021).
| Treatment | N | P | K | Ca | Mg | S | Fe | Cu | Mn | Zn | B |
|---|---|---|---|---|---|---|---|---|---|---|---|
| % | (mg kg-1) | ||||||||||
| Fruit tissue | |||||||||||
| Peel | 0.87 a | 0.09 b | 1.19 bc | 0.11 b | 0.09 b | 0.06 b | 36.6 a | 6.5 ab | 8.6 bc | 20.1 b | 54.4 a |
| Pulp | 0.89 a | 0.13 a | 1.62 a | 0.08 b | 0.10 b | 0.09 a | 24.6 b | 5.2 bc | 6.45 c | 15.8 b | 46.0 a |
| Seed coat | 0.89 a | 0.09 b | 1.29 b | 0.19 a | 0.15 a | 0.08 a | 35.4 a | 6.9 a | 29.6 a | 29.4 a | 55.0 a |
| Seed | 0.82 a | 0.11 ab | 1.05 c | 0.08 b | 0.09 | 0.07 b | 19.8 b | 4.7 c | 18.0 b | 15.2 b | 43.6 a |
| Rootstock/scion relationship | |||||||||||
| Compatible | 0.87 a | 0.10 a | 1.29 a | 0.11 a | 0.10 a | 0.07 a | 29.15 a | 5.8 a | 15.48 a | 21.70 a | 51.83 a |
| Incompatible | 0.85 a | 0.10 a | 1.28 a | 0.11 a | 0.10 a | 0.07 a | 29.06 a | 5.9 a | 15.85 a | 18.57 b | 47.68 a |
Values with similar letters for each nutrient within location or rootstock/scion relationship are significantly different (HSD, P<0.05).
Leaf nutrient content
For the nutritional composition of the avocado tree leaves, there were no differences for location, compatibility, or L × C interaction, except for Mn, where the interaction L × C was significant (Tab. 8). In general, the compatibility did not affect the content of mineral elements in the leaves.
Table 8. Effect of rootstock/scion compatibility on ‘Hass’ foliar mineral content assessment for three locations in Colombia. Values are averages of 3 years (2019-2021).
| Treatment | N | P | K | Ca | Mg | S | Fe | Mn | Zn | B |
|---|---|---|---|---|---|---|---|---|---|---|
| % | (mg kg-1) | |||||||||
| Location | ||||||||||
| Anserma | 2.39 a | 0.14 a | 0.98 a | 1.59 a | 0.40 a | 0.22 a | 88.27 a | 87.01 a | 22.49 a | 38.92 a |
| Peñol | 2.17 a | 0.13 a | 0.89 a | 1.68 a | 0.37 a | 0.21 a | 135.75 a | 119.07 a | 28.79 a | 37.00 a |
| Rionegro | 2.00 a | 0.11 a | 0.91 a | 1.48 a | 0.37 a | 0.18 a | 84.96 a | 98.29 a | 25.03 a | 29.21 a |
| Rootstock/scion relationship | ||||||||||
| Compatible | 2.18 a | 0.13 a | 0.93 a | 1.58 a | 0.38 a | 0.20 a | 97.47 a | 100.54 a | 25.73 a | 34.06 a |
| Incompatible | 2.20 a | 0.13 a | 0.92 a | 1.58 a | 0.38 a | 0.20 a | 108.51 a | 102.38 a | 25.15 a | 36.02 a |
Values with similar letters for each nutrient within location or rootstock/scion relationship are significantly different (HSD, P<0.05).
On the other hand, the tissue analysis added the interpretation of the leaf tissue analysis to the nutrient balance index (NBI) approach, elucidating the condition of each element in the plant to balance the nutrients in the soil without excesses or deficiencies while maximizing crop yield. The compatibility/incompatibility did not affect the nutrient balances for each element at the foliar level (Tab. 9).
Table 9. Effect of rootstock/scion compatibility on ‘Hass’foliar nutritional balance (B) assessment for three locations in Colombia. Values are averages of 3 years (2019-2021).
| Treatment | BN | BP | BK | BCa | BMg | BS | BFe | BMn | BZn | BB |
|---|---|---|---|---|---|---|---|---|---|---|
| % | (mg kg-1) | |||||||||
| Location | ||||||||||
| Anserma | 102 a | 101 a | 76 a | 88 a | 74 a | 59 a | 105 a | 61 a | 89 a | 76 a |
| Peñol | 93 a | 98 a | 70 a | 91 a | 69 a | 59 a | 106 a | 69 a | 115 a | 74 a |
| Rionegro | 87 a | 82 a | 72 a | 83 a | 69 a | 51 a | 171 a | 64 a | 99 a | 69 a |
| Rootstock/scion relationship | ||||||||||
| Compatible | 94 a | 95 a | 73 a | 88 a | 71 a | 56 a | 119 a | 65 a | 101 a | 72 a |
| Incompatible | 95 a | 92 a | 72 a | 88 a | 71 a | 56 a | 137 a | 65 a | 101 a | 74 a |
Values with similar letters for each nutrient balance within location or rootstock/scion relationship are significantly different (HSD, P<0.05).
DISCUSSION
Soil description
The results found in this study agreed with Tamayo and Osorio (2014), who confirmed that the avocado ‘Hass’ producing areas in Antioquia and Caldas have soils with a high capacity for phosphate fixation, low fertility, and pH between strongly acidic and moderate (4.6-5.5). These soils have high contents of organic matter on the surface horizon, in addition to good moisture retention and good root system development as a result of porosity with frank textures, as found in this study. For the calcium contents (high to very high), these results did not agree with Jaramillo (1995) and Muñoz (1998), who indicated that the calcium and magnesium contents tend to be low in these soils because of high leaching. This situation was explained by frequent applications of amendments (rich in calcium and magnesium) to increase the soil pH and neutralize aluminum, a practice widely used in export crops of avocado ‘Hass’. The potassium contents recorded in this study were high in all locations, coinciding with Jaramillo (1995) and Muñoz (1998), where potassium can have medium and high values since the parent material (volcanic ash and potassium feldspars, among others) still contributes this element. A similar situation occurred with the contents of the minor nutrients (Fe, Mn, Cu, and Zn), which were consistent with the report by the same authors. In addition, high P and medium Mg contents were recorded before and during the three years of the evaluation, which showed that these lots have been fertilized in the past.
Soil principal components analysis
In the three locations, the natural fertility of the soil was similar, and its behavior was comparable to that of the Andisols order, with medium fertility, in contrast to the report by Tamayo and Osorio (2014), who stated that these areas have soils with a high capacity for phosphate fixation, low fertility because of low nutrient contents, and, in general, nutritional imbalances because producers frequently use chemical fertilizers to increase the soil's nutritional content and maintain adequate tree nutrition.
Tree growth
The compatible trees presented higher percentages in some allometric parameters, such as canopy diameter and tree volume, than the non-compatible trees in all locations because of the effect exerted by the rootstock on the scion; whereas in the grafted trees, the control of the size of the plant was exercised mainly through the rootstock although the mechanism that regulates scion vigor has not been identified (Basile et al., 2003). In the case of avocado, Mickelbart et al. (2007) found that tree height was similar regardless of the rootstock, except for individuals grafted on cv. Borchard, which was more significant than all other rootstock trees. Differences in canopy volume were observed in this study, which may be related to rootstock-induced differences, not only in vigor but also in shoot architecture. Therefore, rootstocks generally affect the water relations of trees because trees grafted on vigorous rootstocks have consistently higher stem water potentials than trees grafted on less vigorous rootstocks (Rosati et al., 1997). Furthermore, weaker rootstocks can control tree growth (Djuric and Keserovic, 1999), probably through a reduced water potential and other physiological processes (Shackel et al., 1997).
There is an environmental effect on the development of trees, with better responses in environments with lower rainfall, as in the case of Rionegro (1,850 mm year-1) and El Peñol (1,540 mm year-1), as compared to Anserma (2,800 mm year-1). They are directly related to solar brightness, where El Peñol has 5.92 h d-1 (2,154 h year-1), followed by Rionegro with 5.52 h d-1 (2,015 h year-1), and finally Anserma with 3.98 h d-1(1,454 light year-1) (Ramírez et al., 2012). The first two locations met the requirements of Gaillard and Godefroy (1995). They pointed out that avocados have good results in areas with more than 2,000 h of direct sunlight per year, which explains the lower development of trees in Anserma. Avocado-producing areas in Colombia present significant variations in altitude, solar radiation, relative humidity, temperature, and precipitation, among other factors. This results in highly variable cultivar responses in terms of agronomic performance, productivity, yield, and fruit quality (Bernal, 2016).
Fruit mineral content
Tables 3, 4, 5, and 6 present the fruit tissue nutritional content (seed, seed coat, pulp, and peel). In all locations, the nutrient contents of the different parts of the fruit had statistical differences, similar to the report by Yetisir et al. (2013), who stated that the mineral composition of fruits (peel, pulp, seed, and seed coat) was significantly affected by the rootstock and the scion in grafted watermelon crops. This behavior also reported Acevedo-Chávez and Sánchez-Cháves (2017) in pepper crops. In the present study, the copper content in the seeds was significantly higher than the other elements in the compatible rootstocks, as compared to the incompatible ones, similar to the report by Yetisir et al. (2013). They found that grafting on watermelon significantly increased the Cu content in seeds.
The seed coat had the highest concentration of nutrients for all locations. The contents of minor elements also presented significant differences between the fruit tissues. As in the case of the major ones, the seed coat had the highest amount of nutrients and concentrations (mg kg-1) (Tab. 4). It should be noted that elements such as N, Mg, Na, and Zn had higher contents in this tissue in the compatible trees, demonstrating the positive relationship of the rootstock union on the nutritional content in some fruit parts. The seed coat provides an interface between the embryo and the external environment during embryogenesis, dormancy, and germination and has a role in determining seed size (Haughn and Chaudhury, 2005). The fact that this tissue varies in its nutritional content may explain altered germination processes in fruits, possibly generating viviparous, which is unwanted in this crop.
The effects of rootstock on plant nutrient uptake, translocation, and utilization were reported in previous studies (Yetisir, 2001; Colla et al., 2010). However, no published data is available on the effects of rootstocks on plant nutrient concentration on different avocado organs. Despite this, Davis et al. (2008b) indicated that scion variety affects grafted plant’s final size, yield, and fruit quality, but rootstock effects can drastically alter these characteristics.
The nutrient with the highest concentration in the four tissues was K, followed by N. The Zn content was higher in the pulp; while in the shell, there was no difference in the content of the elements. These results are similar to those found in Andisol soils in Michoacan for the ‘Méndez’ avocado by Salazar et al. (2021). The shell presented high Fe, Cu, Mn, and Zn levels. The order in the concentration in the tissues was: K> N> Mg> P> Ca> S> Fe> B> Zn> Mn. These results agreed with those reported for Andisol soils by Tamayo et al. (2018), Salazar et al. (2021) and Salazar-García et al. (2011).
Leaf mineral content
The compatibility did not show significant differences between the leaf mineral content, nor did it affect the nutrient balances for each element at the foliar level. Chaplin and Westwood (1980) did not find a significant influence from rootstocks on the mineral content of leaves in grafted fruit trees. Lazare et al. (2020) determined that the rootstock had a significant effect on the levels of Cl, Mg, Mn, and Ca in leaves for the cultivars Hass and Ettinger. However, these authors stated that, although rootstocks significantly affect the mineral composition of the leaf, this organ belongs to the stem, and the cultivar influences it. Maldonado-Torres et al. (2007) set the nutritional standards for the ‘Hass’ avocado for a yield greater than 20 t ha-1. Therefore, according to the results, the nutritional concentrations of N, K, Ca, Fe, Mn, and Zn were at optimal levels, while P was at low levels, and Mg and B were at low concentrations. Nevertheless, the ranges in terms of percentage of the nutritional status of avocado leaves classified the leaves according to the nutrient balance index proposed by Kenworthy (1973) as scarce (15-49%), below normal (>49-83%), normal (>83-117%), above normal (>117-151%), and excess (>151-185%). According to the balances in the present study, N, P, Ca, Fe, and Zn had normal balances, while K, Mg, S, Mn, and B were below normal, indicating possible nutritional deficiency without symptoms being observed. The advantage of this system is that the elements can be ordered according to their requirement order (the higher the value of the balance index, the lower the requirement for this nutrient) and indirectly considers the nutritional balance of the tree (high yield reflects an adequate balance between nutrients). Leaf tissue analysis is used to diagnose the nutritional status of a tree or orchard and its future requirements. It also shows that all components (rootstock, intragraft, and graft) can affect mineral nutrients (Hartmann et al., 1990). In addition, it is used to determine the ability of different rootstocks to absorb and translocate nutrients to the leaf (West and Young, 1988; Rom, 1991).
Grafting can affect various aspects of fruit quality, so rootstock/scion combinations must be carefully selected for specific climatic and geographic conditions (Davis et al., 2008b). In Colombia, there are no critical levels of nutritional elements in the leaves for this crop. The observations are based on results obtained in other countries, such as Mexico, which has Andisol soils, where avocado is grown. According to the soil analyses shown in table 1, the N, P, Ca, and K contents should meet the requirements of the crop. However, it is necessary to provide Mg, K, and microelements, such as B and Zn, to avoid deficiency problems with the soil's Ca, Mg, and K ratios.
CONCLUSION
The rootstock-scion affinity/compatibility did not influence the fruit and leaf nutrient concentration in the three locations. The seed coat had the highest concentration of nutrients. The nutrient with the highest concentration in the four tissues was potassium, followed by nitrogen. The concentration order in the tissues was: K> N> Mg> P> Ca> S> Fe> B> Zn>Mn.

