


 Inglés (pdf)
 Articulo en XML
 Referencias del artículo
 Enviar articulo por email
 Citado por SciELO
  Citado por Google
  Similares en
SciELO
Similares en
SciELO  Similares en Google
 Permalink
INTRODUCTION
The "Chocolate spot" disease caused by the fungus Botrytis fabae Sard. is a significant constraint in the worldwide production of broad bean (Vicia faba L.), leading to yield losses of up to 100% due to the formation of reddish-brown leaf spots that gradually turn into necrotic lesions and reduce photosynthetic activity (ICARDA, 2005; Olle & Sooväli, 2020). However, identifying the early symptoms and assessing disease severity is challenging for farmers, requiring time-consuming and specialized visual exercises that can be subject to cognitive bias (Ateş et al., 2017; Arnal, 2019; Hammad et al., 2019).In this context, it is difficult to implement efficient prevention and control strategies that allow to maintain low levels of disease infestation, plan the application of fungicides, reduce costs, and minimize negative effects on the environment (Ateş et al., 2017; ICARDA, 2005).
To face this challenge, artificial intelligence techniques together with different neural network architectures are reasonable approaches that can be used to automatically identify diseases in plants (Hammad et al., 2019; Paymode & Malode, 2022; Yang et al., 2018).Specifically, the convolutional neural network (CNN) type has been shown to flexibly adapt to the complex data configuration from plant health experiments, obtaining promising results with valuable application potential (Arnal, 2019; Hammad et al., 2019; Liu & Wang, 2021).
Convolutional neural networks, however, must be particularly trained to the traits of each plant species and the symptoms generated by the specific pathogen of interest. This implies exhaustive data pre-processing that must be carried out first to later identify the models with the best performance for the assigned task. Therefore, this study was conducted aiming to build and train CNNs to evaluate and predict the symptoms caused by B. fabae on V. faba crops, providing decision-making tools for both crop production and plant pathology.
MATERIAL AND METHODS
Plant material. An experimental crop field was established in Catambuco, at the municipality of Pasto (Colombia), at coordinates 01°10'20" N Latitude and 77°16'53" W Longitude. Elevation is 2,473 meters above sea level, average temperature is 13°C, rainfall is 803mm/year and average relative humidity 82%.
The regional bean varieties "Blanca común," "Roja," and "Alpargata" were grown on an area of 900m2 in observation plots with 15 furrows of 10m long separated at 1.2 m and one seed per hole was planted at 0.5m. These materials were included in the study due to their variability in leaf morphology and allow a heterogeneous response after affectation of B. fabae.
Capture of photographs. Healthy and disease-affected leaflets were photographed using a 13-megapixel digital camera on a white acrylic background. The photos were taken at a vertical angle at an approximate focal length of 20cm. In all photos, the leaves occupied more than 30% of the photograph area.
Trial design. The construction of the working sets corresponded to a multiclass assignment with four degrees of severity of chocolate spot disease grades 0, 1, 2 and 3 (Figure 1), using the scale of the International Center for Agricultural Research of Dry Areas (ICARDA, 2005). With the help of an expert in phytopathology, the photographic records were classified and labeled, obtaining a total of 1200 records.

The first trial was made up of a group of photos of healthy leaflets (grade 0) and a random sample of leaves with any grade of manifestation of the disease (grades 1, 2 or 3) represented in Figure 1, both with 300 images.
The second trial corresponded to a multiclass assignment with 300 grade 0 records (healthy leaves), 300 grade 1 records (1 - 15% severity), 300 grade 2 records (15 - 30% severity) and 300 grade 3 records (> 45% severity), represented in Figure 1.
Programming environment. The Python programming language was used in the Google Colaboratory environment, which allowed the preprocessing and learning to be developed on a virtual computer with 12.72 GB of RAM and GPU. The libraries used were cv2, TensorFlow, Matplotlib, Numpy, and Keras.
Preprocessing of digital images. The size of the original images was standardized to a dimension of 224 x 224 pixels and three-color channels (RGB). For each of the trials, the records were randomly assigned as train (70%), validation (15%), and testing sets (15%).
In addition, to avoid overfitting, the number of records was artificially increased by performing random rotations (20°, horizontal-vertical reflection), random displacement and a 20% change in the approach range on the photographs (Paymode & Malode, 2022).
Evaluation of CNNs. For both trials, there were six CNN models available in the Keras open-source library: a) InceptionV3 with 23.85 million parameters and a depth of 159 layers (Szegedy et al., 2016b); b) InceptionResNet with 55.87 million parameters and a depth of 572 layers (Szegedy et al., 2016a); c) MobileNet with 4.25 million parameters and a depth of 88 layers (Howard et al., 2017); d) ResNet101 with 44.70 million parameters and a depth of 101 layers (He et al., 2016); e) VGG16 with 138.35 million parameters and a depth of 23 layers (Simonyan & Zisserman, 2015); f) Xception with 22.91 million parameters and a depth of 126 layers (Chollet, 2017).
In each case, the transfer learning technique was applied, adapting the networks previously trained with the ImageNet dataset and finally, fine tuning was applied by unfreezing the last block of decisional layers (Arnal, 2019; Liu & Wang, 2021; Paymode & Malode, 2022).
A dense layer of 256 parameters and a dropout of 0.6 was added to each model. The process was completed with an output layer with Softmax activation. The learning rate (α) for both trials started at 2x10⁻⁴ with a stochastic gradient descent (SGD) optimizer, a cross-entropy loss function, a batch size (β) of 32, and a fixed value of 30 epochs.
Evaluation metrics. The performance of the CNNs was based on the number of true positives (TP), true negatives (TN), false positives (FP), and false negatives (FN). From these, the following metrics were calculated:
Accuracy: Indicated the fraction of predictions correctly classified. This metric related to the estimation bias, Equation 1.

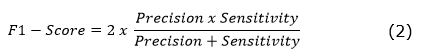
F1-Value: Harmonic mean of the accuracy metric and the model sensitivity, Equatio 2.
Where:
Precision= TP (TP+FP) 𝑆𝑒𝑛𝑠𝑖𝑡𝑖𝑣𝑖𝑡𝑦= 𝑇𝑃 𝑇𝑃+𝐹𝑁
Confusion matrix. The precision and accuracy of CNNs and the correct and incorrect predictions made by the CNNs in the classification were estimated. The results are stored in a table that summarizes the count values broken down by each class; in the columns, the actual values are presented, and in the rows, the predicted values.
Heat map. For those CNNs with the highest performance, the classification inference was evaluated using the Gradient-weighted Class Activation Mapping algorithm Grad-CAM (Selvaraju et al., 2020) by generating a location map that highlights the regions within the image used for predicting, in this study, the presence and severity of chocolate spot symptoms.
The Grad-CAM input corresponded to an image of the test set and the convolutional layer of the CNN from which the activation was calculated; areas of greatest importance for classification were identified with a heat map (Selvaraju et al., 2020).
RESULTS AND DISCUSION
First trial. The results indicate that the problem of binary classification of disease absence or presence in broad bean leaflets was solved. Therefore, this research established an automated recognition of the symptoms caused by B. fabae using the six CNN models.
In this sense, it was determined that the success of image assignment is due to the particularities associated with the deep layers of processing, clustering and classification that characterize each CNN, which allowed identifying the presence of the pathogen according to the learned weights and which was reflected in the performance metrics, summarized in Table 1.
ResNet101, InceptionResNet, MobilNet and InceptionV3 were selected based on the accuracy and F1 values in validation. These CNNs showed a high proportion of correct classifications, sometimes with values up to or close to 100% and 1, respectively. Among these, ResNEt101 stood out for incorporating skip connections, where the incoming signal in a layer is added to the outcome of one or various layers, generating residual learning that prevents loss of information throughout the recognition of the disease (Chollet, 2018; Géron, 2019; Türkoğlu & Hanbay, 2019).
Chollet (2018) and Türkoğlu & Hanbay (2019) explain that for related CNNs such as InceptionV3 and InceptionResNet, the learning develops based on symmetric and asymmetric layers that include stages of convolution and grouping of parallel blocks.
Furthermore, InceptionResNet integrates residual learning, which has demonstrated more stable trainings and higher accuracy in predictions (Szegedy et al, 2016a; Chollet, 2018). This offers an explanation for the differences found between both CNNs (Table 1).
Table 1 Performance of CNNs to identify the absence or presence of disease, first trial.
| CNN | Validation loss | Accuracy | Training loss | Training accuracy | F1 Value | Time (min) |
| InceptionV3 | 6.4e-3 | 97.2% | 0.081 | 100% | 0.97 | 10.75 |
| InceptionResNet | 6.7e-3 | 100% | 0.017 | 100% | 1.00 | 10.82 |
| MobilNet | 0.020 | 98.0% | 0.206 | 93.3% | 0.97 | 7.42 |
| ResNet101 | 0.010 | 100% | 0.034 | 98.8% | 1.00 | 10.67 |
| VGG16 | 0.116 | 90.2% | 0.109 | 91.7% | 0.92 | 11.87 |
| Xception | 0.415 | 87.6% | 0.023 | 99.5% | 0.95 | 14.77 |
MobilNet offered a lighter architecture by employing only 3% and 19% of the parameters used by other CNNs. This is compensated by using separable convolutions in depth, designed to offer an adequate performance under computational limitations (Hammad et al., 2019). Table 1 shows the lower weight of this CNN and the computation time gained, with accuracies between 30 and 36.2%.
Research by Maeda et al. (2018), Türkoğlu & Hanbay (2019), Hammad et al. (2019), and Ouhami et al. (2020) on different horticultural and forest diseases support the results obtained here using the four selected CNNs. They report accuracy metrics for validation between 85% and 98.1% when discriminating between healthy and diseased leaves.
However, the difficulty of making rigorous comparisons between studies is evident due to the particularities of the plant pathogens, the characteristics of the plant species and the hyperparameters used in the CNNs.We found no evidence of overfitting or underfitting for ResNet101, InceptionResNet, MobilNet and InceptionV3, showing that their learning derives in correct generalizations of the data.
It is shown in Figure 2 and Table 1 that similar performance metrics were obtained for train and validation groups with a relatively small variance in the successive learning iterations.
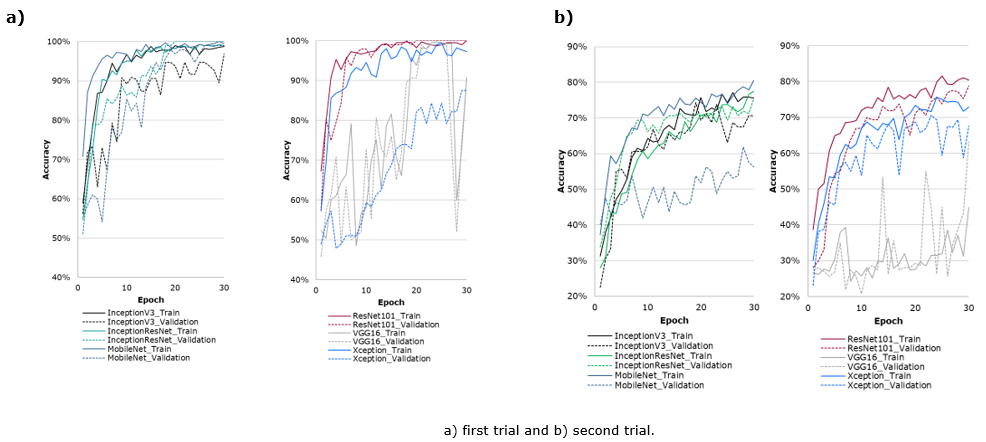
Conversely, Xception and VGG16 architectures were discarded from this essay for having a decrease in validation performance between 9% and 12% compared to other CNNs and high fluctuations throughout training (Table 1 and Figure 2). This behavior indicates the instability of these CNNs to adapt and model the disease in the leaves (Lozada et al., 2021; Maeda et al., 2018). Using these models would increase the rate of false positives or false negatives, implying direct consequences for decision-making around disease management. This is especially critical because of the development rates of B. fabae under favorable environmental conditions.
It has been shown that a temperature between 15 and 22°C and a relative humidity above 80% can promote the transition from isolated spots to full necrosis in leaflets (Olle & Sooväli, 2020). Under this condition, inaccurate classifications would not allow fixed control actions in crops, making CNNs an unfeasible strategy.
It is demonstrated that a CNN cannot be systematized for all training since the metrics obtained for one task could not be reflected in other tasks (Ghosal et al., 2018; Liu & Wang, 2021). Due to the rigurosity pursued in plant pathology, an infallible correspondence between classifications by experts and CNNs is needed to facilitate future applications of this technique for crop production and evaluation.
The results of the second trial showed a significant reduction in the performance of CNNs when compared to the first trial. This is because it was more difficult to establish a learning for the classification of disease symptoms when increasing the number of classes. Because of this, only InceptionResNet and ResNet101 (validation accuracy of 78.2 and 80.3% and F1 values of 0.54 and 0.86, respectively) showed a reasonable performance to be selected (Table 2). This behavior ratified the advantages of using CNNs that integrate residual learning for binary and multiclass classification tasks, as suggested by Chollet (2018), Hammad et al. (2019) and Ouhami et al. (2020).
Table 2 Performance of CNNs to identify severity scales of the disease, second trial.
| Model | Validation loss | Validation accuracy | Training loss | Training accuracy | F1 value | Time (min) |
|---|---|---|---|---|---|---|
| InceptionV3 | 0.560 | 74.0% | 0.697 | 70.0% | 0.63 | 16.76 |
| InceptionResNet | 0.621 | 78.2% | 0.649 | 71.7% | 0.84 | 18.00 |
| MobilNet | 0.500 | 76.2% | 0.986 | 56.5% | 0.57 | 16.41 |
| ResNet101 | 0.467 | 80.3% | 0.648 | 78.8% | 0.86 | 18.76 |
| VGG16 | 1.270 | 40.0% | 1.197 | 49.2% | 0.40 | 18.13 |
| Xception | 0.584 | 70.6% | 0.685 | 68.9% | 0.56 | 21.98 |
Regarding MobileNet and VGG16, which previously showed a promising behavior in classifying diseased and healthy leaflets, they showed divergence between train and validation sets for this new task, pointing out their incapacity to extract the characteristic of interest (Table 2 and Figure 2). This result is possibly related to a lower depth of convolutional layers and a higher general stiffness of these architectures, which increased errors during prediction.
When employing the confusion matrix, which is considered as a rigorous metric for evaluation of multi-class tasks (Lozada et al., 2021), we corroborated the accuracy of results from validation and F1 values, which pointed out the evidence about false negatives and positives (Figure 3). Most of the CNNs classified leaves correctly in extreme degrees of severity (grades 0 and 3) but failed for degrees 1 and 2.
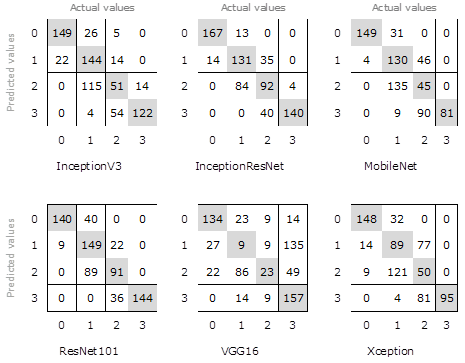
This behavior has been reported by other researchers, who conclude that the assignation of the infection degree of a disease is directly related to the prominence of symptoms in the image. This generates confusion in CNNs when the injuries over the leaves are not different enough to perform discriminations (Arnal, 2019; Liu & Wang, 2021).
This phenomenon probably worsened because of the small dataset (1.200 registries). For example, Ghosal et al. (2018) used 25.000 images to classify soy leaves; Maeda et al. (2018) used 3.717, 3.852 and 4.062 images to classify categories of apple, corn, and grape crops, respectively; and Ouhami et al. (2020) used 660 images per class to classify tomato categories.
Additionally, it was evidenced that, despite using a standardized image capture with white background and stable light conditions, those images showing shadows, blur, and damages other than the target disease caused increased difficulties for CNNs to detect the characteristic of interest.
All these results highlight the large potential of high-performance CNN architectures and show that when based on different resources, it is possible to fine tune their training. This is especially true when increasing the number of images, modifying the quantity and shape of hidden layers in the architecture, changing the dimension of input images and types of convolutions, and modifying hyperparameters, among others. All these factors could increase the stability of CNNs and hence, the confidence in the classification results (Chollet, 2018; Géron, 2019; Maeda et al., 2018; Paymode & Malode, 2022).
Artificial intelligence offers several advantages over traditional classification methods, once the learning process is established its application is scalable, it overrides the bias of the researcher and produces diagnostics with enough speed (Ghosal et al., 2018; Liu & Wang, 2021). Additionally, this includes the possibility of translating the learning process to virtual platforms, smartphones, and unmanned vehicles (Géron, 2019; Ghosal et al., 2018).
The results of the research could support the implementation of automated process of integrated disease management that, for the agronomical sciences, is based on affectation thresholds of the pathogen to establish the application of fungicides. This could lead to a reduction in the use of contaminant substances and an increase of crop yield due to efficient protection of leaf area. Similarly, this kind of training could be used by researchers to gather information on the health response of a crop in real time and over large experimental areas.
It is recommended to continue this study under controlled conditions but also to expand it to uncontrolled conditions in crop fields to cope with changes in light, type of camera, focal distance, lens movement, as well as isolation and overlap of leaflets. These points need to be considered to facilitate the transition from an experimental prototype to a system of artificial intelligence.
Heat maps. The Grad-CAM algorithm successfully extracted of the map of characteristics of the pathogen symptoms over the test registries, showing the areas used by CNNs to stablish the classification decision. In other words, it was possible to look at the “black box” that represents the intermediate stage between the input of images and the analysis of results in the output. This somehow fills the gap of the explanation across how artificial vision works (Ghosal et al., 2018; Liu & Wang, 2021; Selvaraju et al., 2020).
Figure 4 shows heat maps of CNNs with higher performance InceptionResNet and ResNet101 extracted from layers 467 and 101, respectively. Based on those, we noted that CNN identified consistent patterns to detect B. fabae disease, bringing interpretation to training, which builds confidence in intelligent systems and helps advance their applicability (Selvaraju et al., 2020).
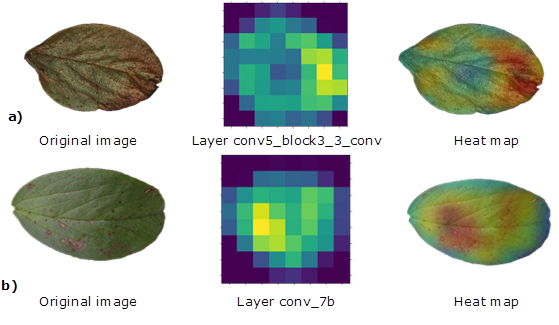
Typically, changes in hue and texture or repeated shapes within the image are the characteristics adopted by the CNN to recognize damage caused by a pathogen (Maeda et al., 2018; Paymode & Malode, 2022; Yang et al., 2018). This seems to be repeated in this study, especially because of the characteristic red color of B. fabae. They include changes in color, texture or repeated shapes across injuries, which are usually reported by literature (Maeda et al., 2018; Paymode & Malode, 2022; Yang et al., 2018).
These architectures discarded the white background as an argument over the learning process, showing it in blue. The importance of this finding relies on the fact that some CNNs use elements of the background or other traits outside the leaf as the main characteristic, promoting incorrect learning that increases the classification error (Selvaraju et al., 2020). These CNNs were capable of recognizing healthy leaves and borders in the image and representing them with green colors. Red or yellow colors in between healthy areas were identified as B. fabae symptoms (Figure 4). Heat maps also helped to find out that the smallest and most dispersed injuries were in some cases ignored, ratifying the hypothesis of assignation confusion during the second trial.
As shown over this article, the results demonstrated the potential of CNNs to support research on plant pathology by identifying injuries and classifying registries into degrees of severity. This is not only important for scientific research but also for applications in decision making around crop production and evaluation.
CONCLUSIONS
The results highlight the potential use of InceptionV3, InceptionResNet, MobileNet, and ResNet101 CNNs for the classification of V. faba leaves infected with B. fabae under controlled conditions, we obtained a successful match of these CNN results with the visual diagnosis of an expert. For the classification of the degree of severity, the architectures with the best behavior were InceptionResNet and ResNet101, both candidates to be optimized to scale this technique to field conditions. The Grad-CAM algorithm allowed to establish the inference of classification, evidencing the correspondence between the presence of B. fabae in leaves and the regions employed by CNNs to generate the learning.

