


 Inglés (pdf)
 Articulo en XML
 Referencias del artículo
 Enviar articulo por email
 Citado por SciELO
  Citado por Google
  Similares en
SciELO
Similares en
SciELO  Similares en Google
 Permalink
Introduction
The inter-Andean valley is characterized by soils of volcanic origin in the upper part, representing less than 1% of surface area, presenting high moisture retention capacity, low bulk density and high phosphate retention capacity (Gaitán & López, 2007). All this is mainly due to high organic carbon (CO) content, the main property of these soils. The organic matter (OM) of Andean Green Evergreen Soils from the Andean fringe, is characterized by the presence of carbonic substances, including microbial biomass, plant remains and decomposing animals and colloidal amorphous mixtures of complex organic substances of high molecular weight as follows: fulvic, humic and humic acids (Eyherabide, Saínz Rozas, Barbieri, & Echeverría, 2014). In addition, it forms soluble and insoluble complexes in water, interacts with clay minerals, forms aggregates, sorbs or releases organic compounds and nutrients from plants, retains water in the environment, among other characteristics (Martínez & Acevedo, 2008).
The edaphic OM is a key component of any terrestrial ecosystem (Batjes, 1996). Its determination is important to characterize a site, being considered as an indicator of soil quality (La Manna et al., 2007), influencing the soil microstructure (Vásquez-Polo, Macías-Vázquez, & Menjivar-Flores, 2014), due to its presence or absence, influences the reactions and chemical products found in the soil or sediment, determining its quality, sustainability and productive capacity (Martínez, et al., 2008).
The present study compares two methods of total organic carbon (TOC) determination in the soil: Ignition Loss (Loss on Ignition - LOI) and DUMAS combustion. The LOI method, is widely used to estimate the total carbon content of soils. The OM, is completely oxidized to carbon dioxide at 430° C in a muffle furnace for 24 h (La Manna et al., 2007). Weight loss during the reactions is easily measured by weighing the samples before and after heating, this value is closely correlated with the OM and the carbonate content of the sediment (Heiri et al., 2001). The DUMAS or dry combustion method is carried out at 950°C for an approximate time of 12 to 15 minutes and allows to determine the COT with more precision, but this method is more expensive since it requires the use of automated equipment and qualified personnel (Eyherabide et al., 2014).
The methods used in this research differ in both, the complexity and the time required for preparation and soil samples, which can be analyzed in a given time, analyzes cost, and others. The comparison made in this research will help to select the most efficient method to perform the analysis of COT present in the soil.
Materials and methods
Study Area
The research was carried out in the upper part of the native forest in the Guangra sector, located in the Achupallas parish, Alausí, province of Chimborazo, at an altitude of 3000 - 3400 m.a.s.l. (Figure 1).

Its biological classification corresponds to Evergreen Andean Forest of Andean fringe (Cueva et al., 2012). The data taken from the meteorological station (EMJ_Jubal_2013) Located at coordinates 9734269 N and 756205 E, at an altitude of 3462 m.a.s.l., it has an annual mean temperature in the sector of 8.3° C, with daily ranges ranging from 0 to 17° C and relative humidity of 83, 6%.
Soil sampling
A double-stratified sampling design was applied, consisting of two phases. During the first phase, a relatively large sample was systematically selected throughout the location. This sample was used to estimate the size or weight of the strata in relation to the population and sample. In the second phase, a smaller sample corresponding to the evergreen Andean forest of the Andean fringe, in which a conglomerate was selected (C) of 5 plots (P) in the shape of an "L" was established, with a dimension of 20 x 20 m. A distance among plots of 250 m (Figure 2).

Five plots were collected in each plot to collect 4 soil samples at different depths: 0-10; 10-20; 20-30 and> 30 cm, respectively.
Laboratory phase
For determination of the Total CO (TOC) by two evaluated methods, the collected samples were analyzed in the Laboratory of Environmental Services of the Universidad Nacional de Chimborazo (LSA - UNACH), Ecuador. For the LOI method, soil samples were dried in the oven at 105 oC for 24 hours and filtered through a 75 μm sieve. For the DUMAS combustion method, soil samples were dried in the oven at 105° C for two hours and filtered through a 200 μm sieve.
The determination of TOC by the DUMAS combustion method, was carried out in the Organic Elemental Analysis FLASH 2000 equipment, which uses high purity gases such as Oxygen (for the combustion chamber) and Helium (transport gas). The equipment was calibrated using 2-3 mg of the BBOT standard (6.51% N, 72.53% C, 6.09% H and 7.44% S). For the analysis of soil samples, were weighed of 10-15 mg of soil. The standard and samples were analyzed with addition of approximately 10 mg of vanadium pentoxide and burned in the furnace at a temperature of 950 °C for an approximate time of 12 to 15 minutes depending on the type of soil.
In order to determine the MO by the LOI method, 5 g of soil were weighed, the samples were placed in a muffle oven at 430 ºC for 15 minutes. Before weight determination the samples were placed in a desiccator with silica gel to reach room temperature and did not absorb moisture, the weight difference corresponds to the MO and the CO was determined by dividing the MO for the conversion factor of 1,724 (Martínez et al., 2008).
To estimate the TOC, the apparent density (AD) was first determined using the cylinder method of known volume (Andrade & Ibrahim, 2003), which consists of taking a soil sample into a metal ring of known volume at different depths (0 to> 30) cm. These samples were brought to constant weight in an oven with a temperature of 105 °C for 24 hours (Equation 1).
 Equation 1
DA expressed in g.cm-3; Pss, is the weight of dry soil (g) and Vc, is volume of the cylinder (100 cm3). According to the percentage of CO and Da, the storage of organic carbon in soil (COS), was estimated using the methodology proposed by Andrade & Ibrahim (2003), (Equation 2).
 Equation 2
Where: COS is expressed in (Mg C ha-1); Ps is the soil depth (cm), Da expressed in g.cm-3 and CO is the concentration of CO in soils (%).
Statistic analysis
For the research, the Complete Random Design (DCA) was used with four treatments and five replicates per plot, and for the whole cluster, treatments were four with three replicates, for the statistical analysis we used the analysis of variance (ADEVA). To compare the TOC quantified by the method of LOI and DUMAS statistical analysis was used in R version 3.1.3, of free use (Salas, 2008), Free distribution and command-based open source, in which all procedures and options can be accessed through computational syntax (Sosa, García, & Piña, 2010).
Results and discussion
The plots were georeferenced and distributed in sites accessible to the collection of soil samples (Table 1), in an altitudinal range that goes from 3140 to 3265 m.a.s.l., where we find a high biodiversity (Silva & Tonello, 2014), With a sandy loam type, granular structure, stoniness less than 5%, black coloration and large amount of organic matter (Cargua, Rodríguez, Recalde & Vinueza, 2014).

Determination of edaphic carbon content by LOI
Applying the LOI methodology, carbon content (C) was determined in the soil, with a mean of 64.4 Mg C ha-1 in the cluster one, in the cluster two 63.3 Mg C ha-1 and for cluster three 61.7 Mg C ha-1, the largest TOC reserve is at C1 P5 with 271.77 Mg C ha-1, and the lowest in C3 P5 with 239.5 2 Mg C ha-1 (Table 2). The statistical analysis shows highly significant differences among depths and non-significant among plots, with a variation coefficient of 4.39%.

Determination of edaphic carbon content by DUMAS
Soil depth influenced COT contents, finding more C stored in the surface layer with a tendency to decrease towards the lower layers, presenting highly significant differences (p <0.05) between 0-10,10-20, 20- 30 and> 30 cm, respectively (Table 2). The largest stored C stock is found in C1 P5 with 268.45 Mg C ha-1, and the lowest in C3 P5, with 234.34 Mg C ha-1 with a highly significant statistical variance among depths and plots with a variation coefficient of 5.01%.
Distribution of data using the method of LOI and DUMAS
The highest edaphic content is within the first 10 cm of the surface layer C1 P5 (Table 2), decreasing as the depth increases, obtaining the lowest TOC reserve at depths> 30 cm C2 P3 (Table 2), For the IOL method there is a difference of 44.5 Mg C ha-1, whereas for the DUMAS method its difference is 47.97 Mg C ha-1, observing that the TOC stabilizes from the 20 cm (Figure 3). Corroborating the results with the studies carried out by Carvajal, Feijoo, Quintero & Rondón (2009) and Ojeda, Stein & López-Hernández, (2009), where soil depth, influences the contents of organic matter, C and N stored in the surface layer, with a tendency to decrease towards the lower layers, with an increase in C edaphic for the first soil layers attributed to the microbial biomass accumulation of Fungi saprophytes, arbuscular mycorrhizae and ectomycorrhizae, and others.

Comparison method of LOI and DUMAS to obtain edaphic carbon
Sixty samples were taken, divided by depths as follows: 0-10, 10-20, 20-30,> 30 cm, respectively (Tables 1, 2), selected to cover a wide range of COT concentration (40 to 90 Mg C Ha-1). The linear relationship (Figure 4) between the methods used for soil TOC determination, performed in R version 3.1.3 (r), finding a significant correlation among methods. The amount of total CO by the DUMAS method, did not differ significantly from the LOI method by finding a R2 = 0.99.
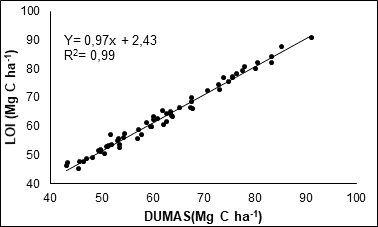
The slope of the relationship among TOC determined by the LOI methodology and TOC determined by DUMAS method, did not differ (p> 0.5), indicating both methodologies do not support the quantification of TOC, which was reflected in the low variation coefficient among methods being less than 19%, presenting statistical differences, which not were significant among methods. However, variation coefficient for DUMAS method, was lower than obtained by LOI (Table 3).

Given these concerns, Eyherabide, Saínz Rozas, Barbieri & Echeverría (2014), maintaining a close relationship among soil TOC determined by DUMAS and LOI methods, although the former accuracy was higher, these differences could be explained by the intrinsic characteristics of each method since the method by DUMAS is automated and does not perceive human errors unlike the method by loss of Ignition is done manually.
Conclusion
The depth of the evergreen Andean forest influenced the TOC contents, finding more C stored in the surface layer with a tendency to decrease towards the lower layers, presenting highly significant differences (p <0.05), between 0-10, 10-20, 20-30 and> 30 cm, respectively, due to the fact that in this type of ecosystem, the environmental and climatic conditions, influences the capacity of a greater microbial activity by increasing the TOC in the soil.
The determination methodology for TOC by LOI, showed the greatest reserve of TOC, which is found in C1 P5 with 271.77 Mg C ha-1 and lowest concentration in C3 P5 with 239.52 Mg C ha-1. For DUMAS method, the largest stored C stock is found in C1 P5 with 268.45 Mg C ha-1 and the lowest, in C3 P5 with 234.34 Mg C ha-1.
The correlation level shows a low significance level among these methods, the variation is greater in DUMAS method (3.38%) due to the analyzed volumes of soil samples and precision level of the auxiliary equipment. Finally, both techniques produce comparable results, being the DUMAS method, which shows greater efficiency when analyzing a large number of samples with respect to LOI

