


 Inglés (pdf)
 Articulo en XML
 Referencias del artículo
 Enviar articulo por email
 Citado por SciELO
  Citado por Google
  Similares en
SciELO
Similares en
SciELO  Similares en Google
 Permalink
1. Introduction
Mangroves cover about 13,200,000 ha on tropical and subtropical coasts with a presence in 11 countries. These places are highly important for their wide range of species, food source, tourism, medicinal plants, and forest products (Burke and Maidens, 2004; Hamilton and Casey, 2016; Villate et al., 2020). The mangrove formed by plants, which among other adaptations, have aerial roots that improve gas exchange, nutrient recycling, water purification, coastal protection (erosion and extreme events), and act as litter traps (Chong, 2005; Diaz, 2011; Kauffman et al., 2011; Cruz-Portorreal et al., 2013; Norris et al., 2017; Martín et al., 2019).
Unfortunately, the mangrove is a fragile ecosystem and is affected by disorganized infrastructure planning, industrial development, uncontrolled tourism, deforestation, fishing activities, climate change and mismanagement of marine litter (ML) (Hartley et al., 2015; Rangel-Buitrago et al., 2017). ML pollution refers to any persistent solid material manufactured, discarded, or abandoned in the sea or coastal environment (UNEP, 2009). The ML represents a concern in the world for what generates negative impacts on marine-coastal ecosystems and on the conservation of their biota (Bergmann et al., 2015; Jambeck et al., 2015; Bouwman et al., 2016; Lozoya et al., 2016; Ramos and Pessoa, 2019; Teckman et al., 2020), as it can affect human health and socioeconomic activities (Araujo and Costa, 2006; Antão-Barboza et al., 2018).
Jambeck et al. (2015) estimate a direct entry of between 4.8 and 12.7 million tons of ML to coasts and seas around the world. Its entry comes mainly from terrestrial sources (80.0 %) through hydrographic basins that can deposit it in other bodies of water adjacent to its mouths (Escobar, 2002; Garcés-Ordoñez and Bayona, 2019). The constant entry of ML can alter and transform the natural conditions of marine-coastal ecosystems into solid waste dumps (Barnes et al., 2009; Reisser et al., 2013; Gall and Thompson, 2015; Jambeck et al., 2015). The prop roots and pneumatophores of mangroves act as ML traps, causing several negative effects such as suffocation in seedlings, release of harmful chemicals, decreased capacity for renewal, sanitation, clogging, accidental ingestion, and physical damage to associated fauna (Cordeiro and Costa, 2010; Boix-Moran, 2012; Smith, 2012; Green et al., 2015; Staffieri et al., 2018).
Marine litter is found in virtually all marine and coastal ecosystems around the world, however, most scientific studies, management activities and management record it on beaches (OSPAR, 2007; Ocean Conservancy, 2010; Bergmann etal., 2015). While in estuaries and mangroves, actions related to evaluation studies and solid waste removal activities are limited (Cordeiro and Costa, 2010). The presence and impacts of ML in mangroves have been carried out in Singapore (Phua, 2001), Brazil (Simão, 1998; Ivar do Sul et al., 2013; 2014; Fernandino et al., 2016), Spain (Mazarrasa et al., 2019; Núñez et al., 2019), Indonesia (Suyadi, 2020), Tanzania (Shunula and Whittick,1999), Saudi Arabia (Martin et al., 2019), the Gulf of Aden and the Red Sea (Khalil, 2004).Taking into account that the entry of ML is increasingly recurrent in mangroves and that information about its presence and implications is scarce. The objective of this work was to review the topic in terms of its magnitude, composition, and impacts caused by BM on mangroves around the world.
2. Materials and methods
The literature review was carried out based on the formulation of the research question: the presence of marine litter in mangrove ecosystems. The search for information was done through the bibliographic databases of ScienceDirect, PubMed, Scopus, ResearchGate and Google Scholar from keywords of this article in both English and Spanish. In addition to this, the selection criteria for items to be evaluated was based on the presentation of baseline information on the composition and magnitude of various marine litter items in mangroves, with a collection area in square meters (m2) to standardize the unit of measurement in items/m2. From this process, a total of fourteen published studies were obtained. In turn, this study included information collected in the mangrove of the Mallorquín swamp in an area of 36 m2. The classification of these studies was carried out through the adaptation of the methodologies and international guidelines for the monitoring of ML proposed by the OSPAR Commission (2010), classifying it according to its properties, origins and uses in: plastic, polystyrene, rubber, textile, paper / cardboard, wood machined, metal, glass, fishing gear, biological risk (sanitary and medical waste), among others. Density was represented in items/m2, the main unit of measurement used in mangroves.
2.1. Environmental impacts of the Marine Litter
The environmental impacts of the ML on mangroves were assessed using two environmental indices: Clean Coast Index (CCI) and Hazardous Items Index (HII). The CCI proposed by Alkalay et al. (2007) and adapted by Rangel-Buitrago et al. (2019a), determines the free state of ML from the calculation of the following equation:

Where the coastal clean-up index is the totality of marine litter items recorded in relation to the area sampled in square meters s and a coefficient K = 20. From its execution the following scale of values obtained: 1) 0 to 2 as clean sites (Class I), 2) 2.1 to 5 as clean sites (Class II), 3) 5.1 to 10 as moderately clean sites (Class III), 4) 10.1 to 20 as dirty sites (Class IV), and 5) >20 as extremely dirty sites (Class V).
The adapted index of hazardous items proposed by Rangel-Buitrago et al. (2019a) measures the possibility of mangroves being affected by articles considered dangerous and that can generate a potential risk (direct or indirect) for the human being and the biota that inhabit or visit them. This index assesses the amount of potentially hazardous marine litter was calculated from the following equation:
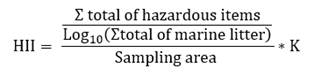
The index evaluates the relationship between hazardous marine litter (HML) articles and log10 of the total number of ML articles recorded in the sampled area. K is a coefficient equal to 8, used to generate a better interpretation of the data. In terms of exposure to dangerous items, environmental quality is classified on the following scale: 1) 0 as a safe site no hazardous items (Class I), 2) 0 to 1 for an observable amount (Class II), 3) 1.1 to 4 considerable quantity (Class IV), 4) 4.1 to 8 many dangerous items / not recommended to visit (Class IV), and 5) >8 is covered in dangerous items (Class V).
2.2. Marine litter similarities and differences by site
The similarities and differences between each mangrove ecosystem were evaluated from a hierarchical grouping and principal component analysis through RStudio Software Version 1.4.1717, and then edited in Grapher version 13.2.734. Since each study had sampling areas different from the total of each site sampled, the data of each evaluated study were expressed in units of items/m2, calculated obtained for each component or litter item divided by the entire sampling area in m2.
The cluster or hierarchical grouping is a multivariate technique applied to build dendrograms or similarity trees from the classification of each site according to the magnitudes of ML and its characteristics. The analysis was applied following the methodologies proposed by Tudor et al. (2002), Tudor and Williams (2004) and Rangel-Buitrago et al. (2018) from the Euclidean distance squared with the Ward bond, minimizing variability within the ML group, and thus producing distinct groups of uniform size.
Principal component analysis was performed with mangrove ecosystems as "cases" and ML as "variables", following the methodology proposed by Rangel-Buitrago et al. (2018). By correlating the ML categories, it was assessed whether changes in ML composition are different between the different mangroves assessed. The principal components are divided into CP1 (first major component) and CP2 (second major component) which represent the greatest variation between the data and were presented as scatter plots (sites) and vector plots (BM categories).
2.3. Correlation between marine litter typologies
Through the correlation and Spearman coefficient for non-parametric data, the associations between the different types of ML (variables) and their composition in units of items/m2 were evaluated from the Shapiro-Wilk inference of normality test using RStudio software version 1.4.1717.
2.4. Sectoral analysis
Following the methodology proposed by Rangel-Buitrago et al. (2019b), the CCI and HII were integrated through a sectoral analysis developed by Williams et al. (2016a; b). A table was constructed using the percentile technique (Langford, 2006) divided into three areas. The first, the green area showing sites from very clean to clean without hazardous items, where protective measures are necessary to maintain current conditions. The second, the orange area represents moderate cleanliness sites with a low to considerable number of hazardous items, where cleaning actions are necessary. And the third, the red area showing the sites from dirty to extremely dirty with a low to a high number of hazardous items, where urgent intervention and restoration measures are necessary.
3. Results
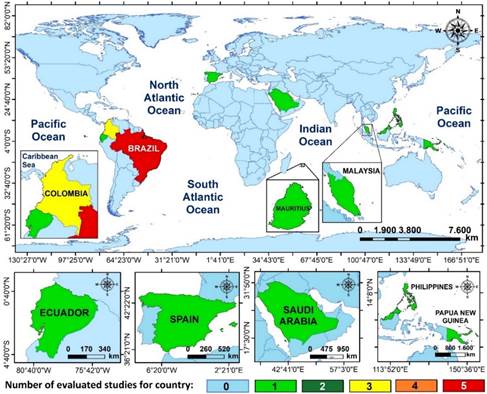
A total of fifteen studies were obtained in nine countries, of which Brazil registered a total of five studies (31.25 %), making it the country with the highest number of published works on the subject in the composition, magnitude and impacts of ML in mangroves, followed by Colombia with three studies (18.75 %) counting on the contribution made in the present work (Table 1, Fig. 1). A total of twenty-two studies in mangrove forests were excluded from the literature review because they did not meet the selection criteria such as registration of collection areas in square meters (m2) or information of different types of ML (e.g., composition only in plastic articles). Information from 207 studies evaluated in ecosystems other than mangroves such as beaches was also excluded (136).
Table 1 General information of published studies concerning BM in mangroves.
| No | Continent | Countries | Specific area | Sites | Area (m2) | Reference |
|---|---|---|---|---|---|---|
| 1 | Asia | Philippines | Mayo Bay | 2 | 2400 | Abreo et al. (2018) |
| 2 | Saudi Arabia | Red Sea and Persian Gulf | 20 | 1900 | Martín et al. (2019) | |
| 3 | Malaysia | Penang Island Mangroves | 3 | 1200 | Chee et al. (2020) | |
| 4 | Africa | Mauritius | Mangroves Mauritius Island | 2 | 3000 | Seeruttum et al. (2021) |
| 5 | America | Brazil | St. Vincent - Sao Paulo | 8 | 1600 | Cordeiro and Costa (2010) |
| 6 | Brazil | Complejo Estuarino Paranaguá - Paraná State | 6 | 124,518 | Possatto et al. (2015) | |
| 7 | Brazil | Santos Estuarino System - Saint Vincent | 6 | 300 | Fernandino et al. (2016) | |
| 8 | Brazil | Complejo Estuarino Paranaguá - Paraná State | 6 | 4500 | Krelling et al. (2017) | |
| 9 | Colombia | Ciénaga Grande de Santa Marta (CGSM) | 6 | 44,445 | Garcés-Ordóñez et al. (2019) | |
| 10 | Colombia | Buenaventura Bay | 4 | 154 | Riascos et al. (2019) | |
| 11 | Ecuador | Commune Puerto Roma, Province of Guayas | 4 | 70 | Jacho (2020) | |
| 12 | Brazil | Estuary of the Pará River | 8 | 20,286 | Gonçalves et al. (2020) | |
| 13 | Colombia | Mallorquín swamp, Atlántico | 4 | 36 | This article | |
| 14 | Europe | Spain | Pas, Miera and Asón estuaries | 32 | 2264 | Mazarrasa et al. (2019) |
| 15 | Oceania | Papua New Guinea | Bootless Bay | 20 | 219 | Smith (2012) |
Source: the author
Source: the author
Figure 1 Number of studies evaluated around the world on the composition, magnitude and impacts of marine litter on mangroves.
3.1. Composition of the BM
Within the ML s and an identification of a total of 16 typologies, where plastic is the main material with 68.8 %, followed by polystyrene 6.4 %, glass 4.6 %, Styrofoam foam 3.5 % and wood machined 2.9%. Cigarette pots, paper/cardboard, building material, miscellaneous, and organic matter registered a composition between 0.1 % and 0.8 % (Table 2, Fig. 2).
Table 2 The total number of marine litter items collected in each of the studies is collected within the literature review. The conventions are: P: plastic; Pol: polystyrene; S: Styrofoam foam; Rb: rubber; Tx: textile; PC: paper/cardboard; WM, wood machined; M: metal; V: glass; Ms: miscellaneous; BR: biological risk (medical and sanitary waste); O: organic matter; FG: fishing gear; BM, building material; CB, cigarette butts; Ot: other/unidentified; and HI: hazardous items.
| No. | P | Pol | S | Rb | Tx | PC | WM | M | G | Ms | RB | O | FG | BM | CG | Ot | Total | HI |
|---|---|---|---|---|---|---|---|---|---|---|---|---|---|---|---|---|---|---|
| 1 | 71 | 0 | 0 | 0 | 4 | 0 | 0 | 0 | 0 | 0 | 0 | 0 | 0 | 0 | 0 | 0 | 75 | 0 |
| 2 | 956 | 72 | 0 | 15 | 0 | 1 | 40 | 39 | 6 | 0 | 0 | 0 | 114 | 0 | 0 | 11 | 1254 | 159 |
| 3 | 8775 | 0 | 0 | 174 | 252 | 15 | 0 | 180 | 390 | 0 | 0 | 0 | 0 | 0 | 0 | 0 | 9786 | 570 |
| 4 | 1392 | 0 | 294 | 177 | 168 | 161 | 142 | 451 | 304 | 0 | 0 | 0 | 0 | 0 | 0 | 136 | 3225 | 755 |
| 5 | 1319 | 0 | 79 | 8 | 0 | 43 | 454 | 24 | 41 | 0 | 77 | 0 | 0 | 85 | 0 | 0 | 2129 | 226 |
| 6 | 246 | 1 | 0 | 0 | 5 | 0 | 0 | 9 | 3 | 0 | 0 | 6 | 13 | 0 | 8 | 0 | 291 | 33 |
| 7 | 2096 | 0 | 0 | 50 | 4 | 11 | 99 | 15 | 7 | 0 | 0 | 0 | 0 | 0 | 0 | 57 | 2339 | 22 |
| 8 | 536 | 0 | 150 | 25 | 3 | 1 | 24 | 8 | 17 | 0 | 36 | 0 | 47 | 0 | 23 | 54 | 924 | 131 |
| 9 | 1755 | 504 | 0 | 11 | 0 | 0 | 0 | 9 | 72 | 0 | 29 | 0 | 20 | 0 | 0 | 0 | 2400 | 130 |
| 10 | 1332 | 0 | 20 | 0 | 177 | 0 | 0 | 88 | 204 | 112 | 0 | 0 | 29 | 0 | 0 | 78 | 2040 | 432 |
| 11 | 144 | 0 | 0 | 0 | 22 | 0 | 0 | 2 | 6 | 0 | 0 | 0 | 0 | 0 | 0 | 29 | 203 | 8 |
| 12 | 1807 | 3550 | 2620 | 0 | 132 | 186 | 0 | 452 | 2931 | 0 | 0 | 0 | 0 | 191 | 0 | 134 | 12,003 | 3574 |
| 13 | 374 | 333 | 0 | 44 | 6 | 0 | 44 | 24 | 16 | 0 | 6 | 0 | 8 | 0 | 0 | 5 | 860 | 54 |
| 14 | 2640 | 0 | 0 | 9 | 20 | 20 | 52 | 31 | 188 | 0 | 514 | 0 | 0 | 0 | 0 | 0 | 3474 | 733 |
| 15 | 3005 | 0 | 0 | 98 | 20 | 54 | 57 | 38 | 77 | 0 | 0 | 0 | 0 | 0 | 0 | 0 | 3349 | 115 |
Source: the author

Source: the author
Figure 2 The control of marine litter in mangroves. P: plastic, Pol: polystyrene; S: Styrofoam foam; Rb: rubber; Tx: textile; PC: paper/cardboard; WM, wood machined; M: metal; V: glass; Ms: miscellaneous; BR: biological risk (medical and sanitary waste); O: organic matter; FG: fishing gear; BM, building material; CB, cigarette butts; Ot: other/unidentified; and HI: hazardous items. For more information, see Table 1 and 2.
Plastic was the main ML article in 14 of the 15 studies evaluated with a dominance between 43.2 % and 94.7 %. On the other hand, in the Pará River Estuary (study No. 12) polystyrene dominated with 29.6%, followed by Styrofoam foam 21.8%, glass 24.4 % and plastic 15.1% (Table 1 and 2, Fig. 2).
Marine litter items such as wood machined in Säo Vicente, São Paulo, Brazil (study No. 5), biological risk (sanitary and medical waste) in the Pas, Miera and Asón Estuary, Spain (study No. 14), and articles not classified in a category in Puerto Roma Commune, Guayas Province, Ecuador (study No. 11) registered moderate dominance (Table 1 and 2, Fig. 2).
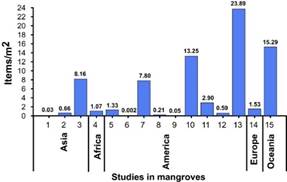
3.2. Magnitude of the BM
Of the total studies evaluated, four studies registered a low to a moderate density of ML, including the Paranaguá Estuarine Complex - Paraná State, Brazil (study No. 4, 0.002 items/m2). Other studies recorded a moderate to high ML density, such as that of Comuna Puerto Roma, Province of Guayas, Ecuador, 2.9 items/m2. The remaining seven studies recorded high BM densities such as Bootles Bay, Papua New Guinea with 15.29 items/m2 (study No. 15), Buenaventura Bay, Colombia 13.25 items/m2 (study No. 10) and Mallorquín swamp, Colombia 23.89 items/m2 (study No. 13) (Table 1 and 2, Fig. 3).
3.3. State of cleanliness in mangroves
Of the fifteen sites evaluated between mangrove plots and mangrove edges, eleven were considered between dirty (two Class IV sites, > 0.5 items/m2) and extremely dirty (nine Class V sites), due to the high ML density. Instead, the remaining four sites were very clean (three Class I sites) and clean (one Class II site) (Table 3).
Table 3 The cluster grouping, clean coast index (CCI) and hazardous items index (HII). For more information see Table 1 and 2.
| No | Cluster | Total density (items/m2) | CCI | Type CCI | Density hazardous items (items/m2) | HII | Type HII |
|---|---|---|---|---|---|---|---|
| 1 | 1 | 0.031 | 0.642 | I | 0.000 | 0.000 | I |
| 2 | 1 | 0.66 | 13.411 | IV | 0.084 | 0.216 | II |
| 3 | 2 | 8.155 | 163.15 | V | 0.475 | 0.952 | II |
| 4 | 1 | 1.075 | 21.500 | V | 0.252 | 0.574 | II |
| 5 | 1 | 1.331 | 26.712 | V | 0.141 | 0.340 | II |
| 6 | 1 | 0.002 | 0.048 | I | 0.0003 | 0.001 | II |
| 7 | 2 | 7.797 | 156.333 | V | 0.073 | 0.174 | II |
| 8 | 1 | 0.205 | 4.133 | II | 0.029 | 0.079 | II |
| 9 | 1 | 0.054 | 1.083 | I | 0.003 | 0.007 | II |
| 10 | 2 | 13.246 | 265.439 | V | 2.808 | 6.788 | IV |
| 11 | 1 | 2.900 | 59.143 | V | 0.114 | 0.396 | II |
| 12 | 1 | 0.592 | 11.842 | IV | 0.176 | 0.346 | II |
| 13 | 2 | 23.889 | 480.000 | V | 1.500 | 4.089 | IV |
| 14 | 1 | 1.535 | 30.979 | V | 0.324 | 0.732 | II |
| 15 | 2 | 15.292 | 307.671 | V | 0.523 | 1.187 | III |
Source: the author.
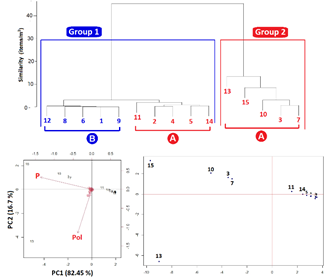
3.4. Similarities and differences between sites
The hierarchical clustering and principal components analysis yielded results like those obtained from the coastal cleaning index (CCI), dividing the evaluated sites into two groups. Group "A" mangrove ecosystems considered dirty with a density of ML > 0.5 items/m2. Group "B" mangrove ecosystems considered clean with a density of ML < 0.5 items/m2.
A total of ten mangrove ecosystems were classified in group A that through the CCI and were considered between dirty and extremely dirty. Similarly, the remaining five sites were classified in group B by their composition and lower magnitude of ML. The only difference is that the Pará River Estuary, Brazil (study No. 14) (group B), considered dirty by the CCI (Table 1 and 3, Fig. 4), is considered clean.
Source: the author.
Figure 4 The analysis of hierarchical clustering and main components in the fifteen studies evaluated in their composition and magnitude of marine litter in mangroves. P: plastic, Pol: polystyrene; S: Styrofoam foam; Rb: rubber; Tx: textile; PC: paper/cardboard; WM, wood machined; M: metal; V: glass; Ms: miscellaneous; BR: biological risk (medical and sanitary waste); O: organic matter; FG: fishing gear; BM, building material; CB, cigarette butts; Ot: other/unidentified. For more information, see Table 1 and 2.
Principal component analysis between the first two major components (CP1 and CP2) explains 99.15% of the data variation. These data showed that the sites with higher ML densities towards the negative axis of the first CP1 component (82.45%) are grouped by the high density of plastic items (studies No. 3, 7, 10 and 15) and polystyrene (study No. 13). While for the positive axis CP1, the sites that did not present a grouping given the composition and density of ML (items / m2) were registered, but with a clear difference as they were inversely proportional to the density of plastic items, and polystyrene. Otherwise, at the end of the CP1 positive axis are the four sites considered clean (Group "B", studies No. 1, 6, 8 and 9) (Fig. 4). The results were corroborated by the value of the mean obtained in sites 3, 7, 10, 13 and 15 with high ML densities, classifying those in group "2" with mean values of plastic of 9.41 % and polystyrene 1.85 %. In group "1" the value recorded for plastic was 0.53 %, and the polystyrene 0.02 % because of the lower density of ML (Table 3).
3.5. Association and correlation between ML typologies
Through Spearman's correlation, positive (blue) and negative (red) garbage typologies were obtained with each other, with a significant correlation coefficient visually represented with the intensity of the color (Fig. 5) and the value of the coefficient obtained. Plastic (P) registered positive correlations with textile articles (Tx, r = 0.72), metal (M, r = 0.85) and glass (G = 0.8), ML typologies with proportional densities (r ≥ 0.77) and with correlation coefficient values > 0.8. Rubber (Rb) showed a positive correlation with wood machined (WM, r = 0.78) with a coefficient of 0.9. Paper/cardboard (PC) showed a positive correlation with wood machined (WM, r = 0.78) with a coefficient of 0.83. Finally, unidentified ML articles (Ot) were positively correlated with textile articles (Tx, r = 0.55), glass (G, r = 0.42) and metal (M, r = 0.56) with coefficients > 0.8 (Fig. 5).

Source: the author.
Figure 5 Spearman's relationship between different types of marine litter. Shapiro-Wilk Debtor Test between variables p = 0.00000004553 - 0.0005614y W = 0.27265 - 0.74552. P: plastic, Pol: polystyrene; S: Styrofoam foam; Rb: rubber; Tx: textile; PC: paper/cardboard; WM, wood machined; M: metal; V: glass; Ms: miscellaneous; BR: biological risk (medical and sanitary waste); O: organic matter; FG: fishing gear; BM, building material; CB, cigarette butts; Ot: other/unidentified.
Among other results from the evaluation of the typologies of ML with the Spearman correlation, a certain number of significant negative correlations were obtained. On the one hand, the density between cigarette butts (GB) and organic matter (O) are proportional to each other, but inversely proportional to plastic (P, r ≤ - 0.37), rubber (Rb, r = - 0.31), paper / cardboard (PC, r = - 0.29), wood machined (WM, r = - 0.26), metal (M, r = - 0.45) and glass (V, r = -0.4) with correlation coefficient values ≤ - 0.78. On the other hand, the articles of biological risk (BR) and textile (Tx) are inversely proportional (r = - 0.48) with a correlation coefficient of - 0.78 (Fig. 5).
3.6. Hazardous marine litter in mangroves
Among the fifteen studies evaluated, they registered that Multiple items of ML are considered dangerous for the ecosystem, biota, and human beings. Items such as metal, glass, miscellaneous, fishing gear, building material (sharps), toxics between biological risk (sanitary and medical waste), and cigarette butts pose a physical risk. ML items that constituted between 0.9 % (22 HI articles, study No. 7) and 29.8 % (3,574 HI articles, study No. 12) of the total evaluated at each study site (Table 1 and 2).
Hazardous Items Index recorded the following: a) only one site did not present ML considered hazardous (Class I, study No. 1) b) 11 sites with an observable amount of hazardous ML (Class II) with the highest density at 0.475 items/m2 (study No. 3), c) a site with a considerable amount (Class III) for a density of 0.523 items/m2 (study No. 15). In turn, two studies recorded many articles of hazardous ML with densities of 2.8 items/m2 (study No. 10) and 1.5 items/m 2 (study No. 13), making it advisable not to visit them (Class IV, studies No. 10 and 13) (Table 3).
3.7. Cleanliness Index vs Hazardous Items
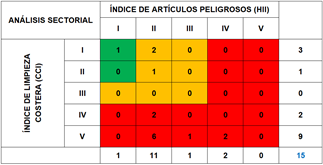
The sectoral analysis between CCI and HII showed that a total of eleven sites such as Red Sea and Persian Gulf, Saudi Arabia (study No. 2), Penang Island, Malaysia (study No. 3), Mauritius Island (study No. 4), São Vicente - São Paulo, Brazil (study No. 5), Santos Estuarine System - São Vicente, Brazil (study No. 7), Buenaventura Bay, Colombia (study No. 10), Puerto Roma Commune, Ecuador (study No. 11), Paraíso River Estuary, Brazil (study No. 12), Mallorquín swamp, Colombia (study 13), Pas Estuary, Brazil (study No. 14) and Bootless Bay, Papua New Guinea (study No. 15) need urgent restoration measures due to the high densities of ML recorded, and also due to the presence of ML items considered dangerous. Likewise, the Paranaguá Estuarine Complex - Paraná State, Brazil (study No. 6 and 8) and Ciénaga Grande de Santa Marta, Colombia (study No. 9) require adequate activities of management, cleaning, and control of sources of marine litter. Mayo Bay, Philippines was the only study evaluated with an optimal status in ML, considered very clean by the coastal cleaning index (Class I, CCI) and that does not present HML (Class I, HII) (Table 1 and 3, Fig. 6)
4. Discussion
Plastic was the main ML item recorded in mangroves with a dominance of 68.8 %, followed by polystyrene and Styrofoam foam, which are considered by various studies other types of plastic items. Between plastic, polystyrene, and Styrofoam foam make up 79.8 % (Fig. 2), a result according to what was found by the OSPAR Commission (2007), Cheshire et al. (2009), Thompson et al. (2009), Sutherland et al. (2010), Deudero and Alomar (2015), Fernandino et al. (2016), Krelling et al. (2017), and Rangel-Buitrago et al. (2020).
Five of the fifteen studies evaluated were registered in Brazil (Fig. 1), a country that represents 10.15 % (1,340,000 ha) of the mangrove area coverage in the 112 countries with mangrove forests, where 25 of the 40 largest metropolitan regions of the country are located near estuarine ecosystems (Cordeiro and Costa, 2010). This closeness highlights the importance of studying the condition of these ecosystems with respect to ML pollution. Among the studies of Cordeiro and Costa (2010), Fernandino et al. (2016) and Gonçalves et al. (2020) moderate to extremely high densities of 0.205 items/m2, 1.331 items/m2, and 7.797 items/m2, respectively, were recorded. In contrast, Possatto et al. (2015) and Krelling et al. (2017) registered lower densities of 0.002 items/m2 and 0.031 items/m2 respectively (Table 1 and 3, Fig. 3).
The highest densities of ML were recorded in Bootles Bay, Papua New Guinea by Smith (2012) with 15.29 items/m2, Pas, Miera and Asón estuaries, Spain by Mazarrasa et al. (2019) with 1.54 items/m2, Buenaventura Bay, Colombia by Riascos et al. (2019) with 13.25 items/m 2, Guayas Province, Ecuador by Jacho (2020) with 2.9 items/m2, Penang Island mangroves, Malaysia by Chee et al. (2020) with 8.16 items/m2 and in the Mallorquín swamp, Colombia (this study), with 23.89 items/m2 (Table 1 and 3, Fig. 3). The high density of ML recorded in Bootles Bay by Smith (2012), Buenaventura Bay by Riascos et al. (2019) and Mallorquín swamp responds to its proximity to large urban centers and the mouth of hydrographic basins that drag with them the ML from different sources and human activities. In addition, there is also the inadequate disposal of ML in streams, rivers, and open air (Cordeiro and Costa, 2010; Ivar do Sul et al., 2014).
Low ML densities in Mayo Bay, Philippines by Abreo et al. (2018) with 0.031 items/m2 and Ciénaga Grande de Santa Marta, Colombia by Garcés-Ordoñez et al. (2019) with 0.054 items/m2 could be attributed to a reduced sampling effort and small study areas. However, this is not the case, since in all three studies large sampling areas were covered, where a lower entry and accumulation of ML is feasible compared to other sites with high densities (Table 1 and 3, Fig. 2).
The composition and density of ML in the mangroves evaluated can generate negative impacts on the environment, biota and even humans (Araujo and Costa, 2006; Cordeiro and Costa, 2010; Boix-Moran, 2012; Smith, 2012; Green et al., 2015; Antão-Barboza et al., 2018). Through the CCI proposed by Alkalay et al. (2007), the analysis of hierarchical clustering and the main components has been obtained between 10 and 11 sites considered dirty, due to the high density of ML registered (Group "A", Class IV, and V) (Table 3, Fig. 6). In addition, plastic as the main ML article registered in fourteen of the fifteen studies evaluated (Table 1 and 2, Fig. 1 and 2) influences the grouping of ML among the sites evaluated. This makes plastic a potential retainer of other types of ML (Rangel-Buitrago et al. 2019b, Suyadi (2020), through a strong association and correlation with textile, metal, and glass articles (r ≥ 0.77) (Fig, 5).
The articles of textile (Tx), glass (G) and metal (M), which are strongly associated with each other and with other types of ML such as plastic, are considered non-floating or intermediate buoyancy and generally come from discharge activities and nearby sources (Ocean Conservancy, 2010; Rech et al., 2014). Similarly, ML articles such as cigarette butts and organic matter remains, which are positively (r ≥ 0.63) and negatively (r < - 0.26) correlated, with coefficients ≤ - 0.78 are grouped with articles of plastic, rubber, textile, processed wood, metal and glass. Even so, its entry and accumulation in mangroves seems not to be associated with other types of garbage. However, they are types of ML that come from nearby sources such as tourism (e.g., smoking) (Ocean Conservancy, 2010) (Fig. 5).
Through the registered ML, eleven sites have been found to have an observable quantity of hazardous items (Class II), one site with a considerable amount (Class III) and two with many hazardous items (Class V). This confirms that even though there is a high density of ML in 73.3 % of the studies evaluated (eleven sites), with types of ML such as plastic that allows the entry and accumulation of items such as glass and metal (considered dangerous) (Fig. 5), the presence of these ML articles considered hazardous in 3 of the 15 studies evaluated. The sites with the most worrying outlook are Bootles Bay, Papua New Guinea (Smith 2012, 0.52 items/m2), Buenaventura Bay, Colombia (Riascos et al. 2019, 2.8 items/m2) and Mallorquín swamp, Colombia (this study, 1.5 items/m2) (Table 1 and 3, Fig. 4). These three ecosystems require serious restoration and intervention measures based on strategies to reduce and eliminate primary sources of ML, with the adoption and improvement of measures such as education, management practices, management, and public awareness.
Mayo Bay, Philippines by Abreo et al. (2018) was the only study with the lowest impact caused by ML, with a clean state obtained from the clean coast index (CCI), hierarchical clustering and principal component analysis. In turn, no presence of BM considered dangerous was obtained from the hazardous items index (Table 1, 2 and 3). These results were evaluated from a sectoral analysis and make it the only mangrove area where only conservation-focused measures are necessary (Table 3, Fig. 6).
5. Conclusions
Despite the important role played by mangroves at the ecosystem and socioeconomic level with distribution in 112 countries around the world, there is little information on the composition, magnitude and impacts generated by marine litter. Plastic has the highest dominance (68.8 %) among different types of garbage, given its shape (e.g., bottles and large parts), durability, persistent buoyancy, and it is supporting the prop roots and pneumatophores of mangroves. This support can act as retainers or traps of different types of marine litter increasing in a greater density to plastic items. In turn, the high densities of marine litter allow the entry of items considered dangerous for both the ecosystem, biota, and humans. A total of three out of eleven sites with high (extremely dirty) ML densities have recorded a considerable amount of hazardous ML items. This leads us to conclude that a greater number of studies focused on evaluating the entry, composition, magnitude, and impact of marine litter is necessary. This baseline review work on the composition, magnitude and possible impacts of marine litter has led us to obtain that eleven of the fifteen studies evaluated demand a comprehensive, intelligent, and urgent management plan based on strategies to reduce and eliminate primary sources. Adding the adoption and improvement of measures such as education, good management practices and citizen awareness.

