


 Inglés (pdf)
 Articulo en XML
 Referencias del artículo
 Enviar articulo por email
 Citado por SciELO
  Citado por Google
  Similares en
SciELO
Similares en
SciELO  Similares en Google
 Permalink
1. Introduction
Benjamin Franklin coined the famous sentence: “in this world, nothing can be said to be certain, except death and taxes.” Taxes are part of the current income of the State, which is invested and spent in the welfare of the country, thus having tax and non-tax revenues, investment expenses, and current expenditures.
The debate between the productive sectors, the government, civil society, and economic analysts revolves around two issues, the structure that supports the tax legislation and the distribution made in the public budget. The foregoing, without counting the mistrust generated in society given the perception of corruption in the public sector where, with a score of 37 out of 100, Colombia ranked 96th out of 180 countries in 2019 (Transparency International, 2020).
The tax statute, decree 624 of 1989 (Presidencia de la República, 1989), from its pronouncement during the government of Virgilio Barco (1986-1990) until the current government of Iván Duque (2018-2022), has undergone not only reforms, called tax reforms, but also a series of regulatory decrees that modify the aforementioned statute. Making an inventory of the changes may vary; the method of measurement used here has been the product of exhaustive monitoring of regulations that aim to modify any article, not only the count of the reforms1 themselves, resulting in thirty-one, an average of one per year, with the aggravating factor that the last ten years concentrate 52% of them.
On the international plane, “Colombia has been invited to become the 37th member of the Organization” (OECD, 2018), so reads the press release for Colombia from the OECD, which describes itself as “an international organisation that works to build better policies for better lives. Our goal is to shape policies that foster prosperity, equality, opportunity and well-being for all” (OECD 2020a). The importance of being a candidate for membership in the OECD lies in adapting to the international standards that this institution promotes different issues related to public policies; one of these issues is taxation. Colombia’s accession to the OECD was made possible by Law 1950 of 2019, which was declared compatible with the Constitution by the Constitutional Court in Ruling C-492/19 (2019a).
Articles 150, 338, 345, 346, 349, 358, 359, 362, and 363 of the Political Constitution (Asamblea Nacional Constituyente, 1991) provide the legal basis for the duty to pay taxes, as established in the duties and obligations of Article 95 of the Constitution, especially paragraph 9. It follows that the law must establish the active and passive subjects, the facts and bases of taxation, the rates, the validity of the respective law, the budget, the development plan, current income, and social investment. According to these, the tax should not be understood in isolation calculated for a particular taxpayer; it is now a matter of public finances, which is why the tax statute does not define the tax as an end in itself, but as the means to collect the necessary income2 to cover the public budget and, hence, the mandatory payment by the taxpayer citizen.
The objective of this document is to identify Colombia’s international position on tax matters. To this end, a comparative analysis is made in different indicators with other OECD countries, especially in Latin America, taking advantage of the nation’s inclusion in this organisation since 2019.
2. The First Attempt at Structural Tax Reform
On December 29, 2016, the Official Gazette published Law 1819 of 2016 called Structural Tax Reform (RTE in its Spanish acronym), that is, it split in two the history of tax reforms in Colombia, this one that was structural and the others that were not. Nevertheless, before discussing what structural means, two other national laws, international recommendations, and multiple statistics should be reviewed.
Two fundamental laws precede the RTE, Law 1739 of 2014, not so much because it was the tax reform before the RTE, but because it created the commission of experts for tax equity and competitiveness with the objective of “studying the tax system and proposing reforms to make it more equitable and efficient” (Comisión de Expertos para la Equidad y Competitividad Tributaria, 2015), and Law 1473 of 2011 establishing a fiscal rule, with a structural deficit target of the Central National Government (CNG) of no more than 1% of GDP as of 2022, tracing a specific path: 2.3% or less in 2014 and 1.9% or less in 2018.
The report on compliance with the fiscal rule in 2015 indicated that at its close, the structural deficit was 2.2% (Dirección General de Política Macroeconómica, 2016). The public budget must be subject to the fiscal rule, and the commission of experts presented its final report to the Minister of Finance and Public Credit Mauricio Cárdenas (2012-2018) at the end of 2015, which served as the basis for the RTE.
Economic studies for Colombia by the OECD in 2015 recommended that the government increase revenue and build a more efficient and fair tax system. To do so, they suggest “reducing the tax burden on investment by gradually lowering the corporate income tax rate, phasing out the net worth tax on business, and eliminating the investment VAT” (OECD, 2015, p. 5).
As a whole, the fiscal rule, the commission of experts, and the OECD recommendations have guided the country in tax matters. The official discourse affirms that public policies in this area obey economic techniques. The logical explanation is that the fewer taxes companies pay, the more profits and the more investment there will be. However, for Banerjee and Duflo (2020), the low tax rates to drive growth is just an ideology; they conclude that there is no empirical evidence that the long-term growth rate increases under this economic policy. Thus, the national tax system has to be consistent with its economic model.
On the other hand, to control the fiscal deficit, Colombia has followed the postulates that the Washington Consensus designed as pillars for Latin America: fiscal austerity, privatization, and liberalization of markets, excluding other policies necessary for growth (Stiglitz, 2004). As a result, there was no adequate industrial policy; the productive sectors were not concentrated in greater comparative advantage activities but rather in imports (Sarmiento Palacio, 2002), contrary to what is expected by the orthodox economic theory, the neoclassical one. The reality did not coincide with the theory; egalitarian economic growth has not been achieved, nor has the minimalist State been able to satisfy social demands better, generating economic and social exclusion (Dupas, 2005).
Government, business people, and society want to maximize their profits; therefore, the problem on the tax system, that is, the rates and the taxable subject on which the tax finally falls, must be based on the principles of equity, efficiency, and progressiveness. Thomas Piketty states that “inequality is not economical or technological: it is ideological and political” (2019, p. 18); he affirms that this is the most important conclusion of his research because when one discusses tax and business issues, with all that their content implies, social construction is being made, and from common sense, it flourishes that the only thing that would be needed to build a more egalitarian society is political will.
3. Statistical Balance
What has been stated so far has materialized with the development of the RTE, and all tax reform is carried out in order to collect more taxes. The second government of Juan Manuel Santos (2014-2018) had not predicted a drop in oil prices in its calculations, and now it was obliged to make up for that shortfall in its income to finance the public budget. Table 1 shows the rise and fall of international prices for a barrel of oil and the annual average value of each dollar in national currency.
Table 1 The average international price of a barrel of Brent oil - WTI and average price of the dollar in Colombian pesos 2011-2018
| Year | 2011 | 2012 | 2013 | 2014 | 2015 | 2016 | 2017 | 2018 |
|---|---|---|---|---|---|---|---|---|
| Brent | 112,26 | 111,55 | 108,44 | 97,52 | 54,40 | 46,00 | 55,71 | 71,64 |
| WTI | 97,00 | 94,05 | 97,61 | 91,23 | 49,31 | 44,47 | 51,86 | 64,54 |
| µ $/dollar | 1.846,97 | 1.797,79 | 1.869,10 | 2.000,33 | 2.743,39 | 3.050,98 | 2.951,32 | 2.956,43 |
Source: Calculations made by the author based on Investing.com (2020), Banco de la República and Superintendencia Financiera (2020a).
In the WTI3 barrel, prices went from an average of US$94.97 between 2011-2014 to US$46.89 between 2015-2016, a decrease of 50.63%, while the Brent4 barrel, in the same intervals, went from US$107.44 to US$50.20, a decrease of 53.28%. The average price of the dollar between 2011-2014 was $1,878.55, and between 2015-2016 it was $2,897.19; that is, it had a devaluation of close to 54.22%. Since the end of 2011, Ecopetrol has been selling its oil with reference Brent (Dinero.com, 2012), triggering a stronger negative impact on the national economy, which could have been worse if the peso had not depreciated the way it did, allowing exporters of non-traditional products to be more competitive in the international market.
Table 2 shows the composition of Colombia’s exports, which details the decrease in the oil item between 2013-2016 by 21.24%, in addition to a downward trend in total products between 2012-2016 of 47.16%. This is because the structure of exports has not changed despite the opening to international trade and globalization since the early nineties, maintaining a structure of comparative advantage in natural resource endowment, mainly mining and energy, but not in the manufacturing industry.
Table 2 Main Colombian Exports 2011-2018
| Year | Coffee, coal, ferronickel | % | Oil | % | Non Traditional | % | Total |
|---|---|---|---|---|---|---|---|
| 2011 | 11.831.852 | 20,79 | 28.420.665 | 49,93 | 16.662.422 | 29,28 | 56.914.939 |
| 2012 | 10.596.356 | 17,62 | 31.558.933 | 52,49 | 17.969.877 | 29,89 | 60.125.166 |
| 2013 | 9.251.927 | 15,73 | 32.485.855 | 55,22 | 17.088.589 | 29,05 | 58.826.371 |
| 2014 | 9.923.905 | 18,09 | 28.988.176 | 52,84 | 15.944.674 | 29,07 | 54.856.755 |
| 2015 | 7.516.310 | 20,87 | 14.566.130 | 40,44 | 13.935.082 | 38,69 | 36.017.522 |
| 2016 | 7.384.338 | 23,25 | 10.795.579 | 33,98 | 13.588.424 | 42,77 | 31.768.341 |
| 2017 | 10.264.321 | 27,00 | 13.308.015 | 35,00 | 14.449.525 | 38,00 | 38.021.860 |
| 2018 | 10.273.881 | 24,52 | 16.842.687 | 40,19 | 14.788.210 | 35,29 | 41.904.777 |
| Figures in thousands of dollars FOB. | |||||||
Source: Calculations made by the author based on DIAN and DANE (2020).
Considering that the State is the largest investor in the largest oil company in the country, Ecopetrol, with a shareholding of 89.49%, received fewer dividends, causing a greater decrease in total income from the CNG as illustrated in Table 3, which also includes the loss of income due to the lower value of income and complementary taxes. The importance of the oil bonanza is noticeable, which once ended, produced a lack of public income that was not anticipated by the government in power. The impact in terms of GDP is greater than that indicated in the table, since the income tax rate, which was 33% in 2012, fell to 25% during the taxable years 2013 to 2016 with Law 1607 of 2012. Besides, only income tax is being analyzed, and not all of the taxes or royalties paid by Ecopetrol.
Table 3 Dividends and income tax of Ecopetrol and the CNG participation as a percentage of GDP 2012-2015
| Concepts | 2012 | 2013 | 2014 | 2015 |
|---|---|---|---|---|
| N° of shares | 41.116.698.456 | 41.116.698.456 | 41.116.698.456 | 41.116.698.456 |
| Dividend per share | 291 | 260 | 133 | 0 |
| Shares of CNG | 36.384.788.817 | 36.384.788.817 | 36.384.788.817 | 36.384.788.817 |
| Dividends for CNG | 10,588 billones | 9,460 billones | 4,839 billones | 0 |
| Dividends % GDP | 1,59% | 1,33% | 0,63% | 0% |
| Income tax | 6,561 billones | 5,211 billones | 3,730 billones | 0 |
| Tax % GDP | 0,99% | 0,73% | 0,49% | 0% |
| Dividends + tax of income % GDP | 2,58% | 2,06% | 1,12% | 0% |
Source: Calculations made by the author based on Ecopetrol (2019, 2020a, 2020b).
Table 4 shows the relationship between income taxes on CNG. In the first Santos administration (2010-2014), it was 91.40%, while in 2015, it was almost 96% and 99% in 2016 because non-tax revenues had collapsed, as had tax growth.
Table 4 Colombian CNG tax and revenue collection 2010-2018
| Year | Taxes | Variation (%) | CNG Revenue | Taxes/ CNG Revenue (%) |
|---|---|---|---|---|
| 2010 | 70.190.193 | - | 74.957.020 | 93,64 |
| 2011 | 86.568.640 | 23,33 | 94.247.232 | 91,85 |
| 2012 | 99.226.458 | 14,62 | 107.067.236 | 92,68 |
| 2013 | 105.442.806 | 6,26 | 119.781.199 | 88,03 |
| 2014 | 114.314.587 | 8,41 | 125.898.557 | 90,80 |
| 2015 | 123.705.323 | 8,21 | 129.321.068 | 95,66 |
| 2016 | 126.733.824 | 2,45 | 128.367.086 | 98,73 |
| 2017 | 136.430.262 | 7,65 | 144.062.445 | 94,70 |
| 2018 | 144.423.956 | 5,86 | 149.292.227 | 96,74 |
| Figures in millions of pesos. | ||||
Source: Calculations made by the author based on Coordinación de Estudios Económicos, Subdirección de Gestión de Análisis Operacional de la DIAN (2020) and Dirección General de Política Macroeconómica del Ministerio de Hacienda y Crédito Público (2020).
Santos government set up a public revenue exchange scheme with the entry into force of the RTE, replacing the drop in revenue from lower oil exports with higher consumption taxes, such as the general VAT, which rose from 16% to 19%. Also, by reducing the tax burden on companies and introducing more exemptions, in turn, adjusting the tax burden on individuals by increasing the number of people filing returns and betting on formalization and economic growth, as summarized in Table 5.
Table 5 Projected collection by type of tax as a percentage of GDP. Colombia 2017-2022
| Year | Consumption tax, VAT, Green taxes | GMF | Income | Formalization and growth | |
|---|---|---|---|---|---|
| Natural | Legal | ||||
| 2017 | + 0,8% PIB | + 0% PIB | + 0,0% PIB | - 0,1% PIB | + 0% PIB |
| 2018 | + 0,9% PIB | + 0% PIB | + 0,0% PIB | - 0,3% PIB | + 0,1% PIB |
| 2019 | + 0,9% PIB | + 0,2% PIB | + 0,1% PIB | - 0,1% PIB | + 0,3% PIB |
| 2020 | + 0,9% PIB | + 0,4% PIB | + 0,1% PIB | - 0,1% PIB | + 0,7% PIB |
| 2021 | + 0,9% PIB | + 0,6% PIB | + 0,1% PIB | - 0,1% PIB | + 0,6% PIB |
| 2022 | + 0,9% PIB | + 0,9% PIB | + 0,1% PIB | - 0,1% PIB | + 0,6% PIB |
Source: Calculations made by the author based on DIAN (2017).
Having elaborated the argument of the need for new revenues and the vision provided by the projection of its calculations, the government proceeds to inject ideology through economic technique. This is achieved with the reports, both from the commission of experts and the OECD, which have no other support than to increase consumption taxes, which is the bulk of what is observed in the table number 5 and, in part, with the fiscal rule that limits the public budget. This is how the RTE was built and approved; in the words of Castañeda (2019), it was nothing more than a patchwork quilt trying to solve the fiscal deficit provisionally.
The measures contained in the RTE plus the recovery of oil and the increased exports of coffee, coal, ferronickel, and other non-traditional products, observed in the tables number 1 and 2 for the years 2017-2018, allowed for an increase in CNG revenues, observed in the table number 4, while at the same time a few percentage points decrease in the pressure that fell almost exclusively on taxes; since in the last two years of the Santos government, the ratio of taxes to CNG revenues fell to an average of 95.72%.
4. The Role of the Taxes in the Public Finances of the Central National Government
The State needs permanent income to function, most of which are taxes paid by people and companies, which are contained in the so-called current income (Banco de la República, 1998). Others may be the sale of assets, known as capital income, or loans granted to the country that will gradually be converted into future taxes. The government uses part of these resources in its operation and another part in the investment. We could understand the State as an intermediary, which obtains its income from the taxes paid by the taxpayers and which redistributes them among the population for their development, attending to their needs.
The sources and uses of public resources refer to the public economics, and by extension, to public finances, known as State intervention in the economy. However, and especially for Latin America, Giraldo (2009) affirms that the archetype on which public finances are based arose after the 1982 external debt crisis, with reforms and adjustments loaded with market ideology and non-interventionism State. Therefore, the trend is to universalize the mass of taxpayers, increase indirect taxes, and reduce the rates of direct taxes. These ideas are part of the dominant neoclassical approach in economics where the market should not be distorted; on the contrary, Piketty (2014) argues that taxation is not a technical issue but the most important political issue.
The use given to taxes has also changed; social investment focuses on demand and not supply; that is, public resources are being transferred to a supposedly self-regulating market. States no longer offer the services that they used to provide to society, but society decides directly with whom to contract, that is, less and less State intervention in the economy and more and more market efficiency. Targeting is a trend of economic globalization, and governments are using public finances to advance not only economic policy but also public policy as a whole, leaving the administrative process itself without room for maneuver, ignoring that the economy does not it is the only factor that encompasses the public administration (Guerrero, 2010).
Investments in society and social spending should seek economic development, understood as increasing income and employment opportunities, eradicating poverty, and reducing inequality (Todaro, 1988). That is, not only the highest GDP growth, being objectives that can be achieved with good economic policies. This is the reason why the opinion of the national government has been to belong to an organization that has presented itself as the one that has good and best governmental practices, to be a model nation, of course, without first the country adopting those practices; it is like wanting to obtain the results first and then carry out the process to achieve those same results that they want to obtain, starting at the end.
In this way, Santos’ government administration led Colombia to belong to the OECD with all the adjustments that this implies, including of course the tributaries that not only refer to those administered by the CNG, but we are facing an imminent territorial tax reform that is, of the taxes administered by sub-central governments as indicated by Romero and Gómez (2018) in their study on the recommendations of the OECD to territorial taxation in Colombia, by the fiscal policy and territorial development committee. Everything seems to revolve around economics, and its schedule has been: tax affairs committee, chemicals committee, transnational bribery working group, investment committee, digital policy committee, corporate governance committee, employment committee and social affairs, fisheries committee, public governance committee, trade committee, environmental policy committee, and private insurance and pension committee (Presidencia de la República, 2017).
5. There Has Never Been such a Thing as a Structural Tax Reform
Changes to the overall economic policy could be thought of in structural terms. Analyzing whether structural is the same as structuralism is not an easy task, but to say that the government has achieved a structural tax reform is to affirm, semantically, that the structures have been removed in everything that involves the tax issue. Blair (1978) argues that the difference is epistemological; he explains that for some, the structure is a pattern of a verifiable thing because it physically exists; however, for a true structuralist, it is to focus the study of something through the vision we have of its structure, built by human thought, imposed by language. There has not been, until now, structural tax reform in Colombia because the foundations of the economic policy to which it belongs have not been reviewed.
It had been stated previously, with Piketty, that the tax system is a social construction that cannot be explained solely from the economy and that its decision is political and, with Giraldo, that public finances in Latin America respond to a model of economy of the market that did produce structural changes in public policy; then, the RTE that has established is the hegemonic economic model, without even carrying out the analysis that Blair warns about because the dynamics of the current economic structure is not being considered, in this case, how we relate economic equality to taxation to achieve economic development through a fair policy for all.
Thus, the old economic structure is consolidated in new tax reform; that is, the RTE has only served to administer public resources with the same economic bases. A tax reform, by itself, cannot change the economic model imposed, so there cannot be something called RTE; different would be a panorama with tax reform and a public budget that responds and are consistent with a new, more inclusive economic model. A true tax reform, which may not necessarily be structural but comprehensive, would begin after evaluating the bases of the economic model, of its national convenience, and thus be able to create the strategy to advance economic development and that, by generating wealth for its population, fair and progressive taxes are collected for a redistribution that minimizes inequality among citizens. In particular, it would define a policy of horizontal tax equity and vertical progressiveness, in addition to evaluating exemptions to the tax system; this is how comprehensive tax reform would include, from the law, the substantive part, and the procedural part, that is, substantive and adjective.
A structural change means a transformation in the joint composition of the economy that integrates production, relations between economic agents, income distribution, and insertion into the international system. It is not a uniform process; it depends on how the technology evolves and the growth of the various industries in a given period, unlike neoclassical economics and its single-good growth model (Vera, 2013). Ultimately, structural would be to seek an alternative to the current economic model that would include, in turn, a new fiscal framework.
The structuralist vision of economic development, centered on industrialization as the generator of economic growth, is based on the diversification of productive activities. It is a model of endogenous growth that is not opposed to commercial opening or the globalization of markets. To achieve this change, the will of the government is needed, a new economic policy. Ortiz and Uribe (2012) remind us of the pioneering analysis of this type of economic policy in Colombia. Albert Hirschman with his theory of economic development that involves the role of the State in directed public spending and Gabriel Poveda with the promotion of industrialization that goes from import substitution to the production of capital goods; explaining, also, that the structuralist vision conceives the economic system as development in stages.
The economic structure of the country, at present, is the result of the economic model of comparative advantage in the endowment of natural resources that left the manufacturing industry stagnant and opened the way, as we had mentioned before with Eduardo Sarmiento, to the accentuation of importing activity, for this reason, the highest GDP is now concentrated in trade. Table 6 summarizes four periods of GDP measurements that DANE has made by branches of economic activity, indicating the most important.
Table 6 The average economic structure of Colombia as a proportion of GDP for periods from 1994 to 2018 by selected economic activity branches
| Branches of Economic Activity | 1994 to 1999 (%) | 2000 to 2004 (%) | 2005 to 2014 (%) | 2015 to 2018 (%) |
|---|---|---|---|---|
| Agriculture, livestock, hunting, forestry, and fishing | 13,76 | 9,54 | 6,74 | 6,13 |
| Mining and quarrying | 4,08 | 5,72 | 6,78 | 5,47 |
| Manufacturing industries | 13,77 | 14,45 | 12,93 | 12,28 |
| Trade, repair, transportation, accommodation, and food services | 11,29 | 12,65 | 12,00 | 16,98* |
| Financial, insurance, and real estate activities | 17,34 | 17,35 | 19,43 | 13,27** |
| Seasonally adjusted series. Figures at constant prices per column for 1994, 2000, 2005, and 2015. * The first three periods do not add transportation. **For the last period, services to companies were not taken into account. | ||||
Source: Calculations made by the author based on DANE (2020a).
In the last 25 years, the national economic structure, excluding the activities of the public administration, has been led by financial, insurance, and real estate activities in the first four periods, with a rebound in the trade that came from occupying the fourth line in the first period to end in the first in the last period, replacing in its position the financial activities that moved to second place. Agriculture, on the other hand, lost importance consecutively in each period evaluated until it became less than half of what it weighed in GDP in the first, the same fate that has occurred with the manufacturing industry, although with greater relevance within the national GDP and that it has been holding between 12% and 15% as a percentage of this. Lastly, extractive activity, which fluctuates according to international commodity prices, remaining between the sixth and fourth line of GDP.
Table 7 shows the volatility in the extractive activity that increases and decreases, as seen above, due to international prices. Financial and commercial activities are the most dynamic since both grew on average, almost 5% per year for almost 15 years. Agriculture improved its growth in the last period, and the manufacturing industry recovered after the crisis at the end of the last decade of the 20th century, but its growth has been slowing down concerning other economic activities during the last 15 years.
Table 7 The average annual economic growth of Colombia for periods from 1994 to 2018 by selected economic activity branches
| Branches of Economic Activity | 1994 to 1999 (%) | 2000 to 2004 (%) | 2005 to 2014 (%) | 2015 to 2018 (%) |
|---|---|---|---|---|
| Agriculture, livestock, hunting, forestry, and fishing | 0,61 | 2,69 | 2,12 | 3,46 |
| Mining and quarrying | 11,78 | -2,46 | 6,38 | -2,98 |
| Manufacturing industries | -0,93 | 3,75 | 2,06 | 1,03 |
| Trade, repair, transportation, accommodation, and food services | -2,74 | 4,53 | 4,91 | 2,63* |
| Financial, insurance, and real estate activities | 2,38 | 5,22 | 5,18 | 3,20** |
| Seasonally adjusted series. Figures at constant prices per column for 1994, 2000, 2005, and 2015. * The first three periods do not add transportation. ** For the last period, services to companies were not taken into account. | ||||
Source: Calculations made by the author based on DANE (2020a).
We can infer that the tax reforms carried out to the tax statute cannot change, in any way, the economic development model used in the country, following the concept of the economic constitution that establishes an economic order configured by principles gradually developed by the public power. (Viera Álvarez, Bassa Mercado, and Ferrada Bórquez, 2016). As the table 7 indicates, during the last 25 years, the extractive activity regulated by international prices has been maintained, services and trade grew, largely due to higher imports since it did not do so in the same proportion as the production of the manufacturing industry. For its part, agriculture grew more in the last period, approaching long-term national GDP rhythm. There was no structural change in the economy.
6. The Last One, or Better, The Last Tax Reforms
Duque’s administration has been the only one to process two tax reforms in the course of his first 17 months in office. Law 1943 of 2018 called the financing law, demanded by Daniel Libreros, director of the Fiscal Observatory of the Universidad Nacional, and declared unenforceable by the Constitutional Court (2019b) through judgment C-481 dated October 16, 2019, because the principles of publicity and consecutiveness were unknown in the course of the parliamentary debate. It was declared unenforceable from January 1, 2020.
Therefore, the government processed a new tax reform in less than two years, the 2010 law of 2019 called the economic growth law, which so far has four lawsuits before the Constitutional Court (Chiquiza Nonsoque, 2020). In summary, there was no RTE, but neither has this new administration been able to develop a comprehensive reform that complies with the principles of equity, efficiency, and progressiveness, as determined by the Constitution.
The financing law was supposed to cover a tax gap, but due to the decrease of one percentage point per year, from 2020 to 2022, in income tax for legal persons plus the deduction for VAT on capital goods and the gradual decrease in presumptive income, former Minister of Finance Guillermo Perry (1994-1996) called it under financing. It found that the impact on revenue would fall 0.8% of GDP between 2020 and 2022, in addition to being regressive, since labor income was taxed more than capital income (Perry, 2019). This reform was not going to collect more taxes, and neither was it going to ensure the restoration of budget balance, which was what was intended.
Table 8 shows the Gini index of Colombia compared to other countries belonging to the OECD. It can be seen that, in 25 years, the Colombian State, with all its tax reforms, has barely been able to improve the redistribution of wealth by 1.8 points. Chile and Mexico have been more efficient; however, compared to France, we have a difference of 17 points in wealth concentration. In addition to the above, a loss of 0.8% of GDP in tax collection will worsen inequality in the country as there is not enough funding for the public budget.
Table 8 Gini index compared 1992 and 2017 of selected countries
| Country | 1992 | 2017 | Variation |
|---|---|---|---|
| Colombia | 51,5 | 49,7 | -1,8 |
| Chile | 54,8 | 46,6 | -8,2 |
| Mexico | 53,7 | 48,3 | -5,4 |
| France | N.A. | 32,7 | N.A. |
| Data from 2015 for France and 2016 for Mexico. | |||
Source: Calculations made by the author based on Grupo de investigaciones sobre el Desarrollo del Banco Mundial (s.f.).
Before the economic growth law, in March 2019, the advisory committee for the fiscal rule (2019) made modifications to widen the fiscal deficit during the years 2019 to 2023, from 0.5% of GDP to ending with 0.1%. With this law, which is an extension of the financing law, the government took advantage of this flexibility to argue that lowering taxes on companies creates more jobs and, in the end, more taxes will be collected.
Table 9 compares the unemployment rate, GDP, and taxes per capita in 2017 of Colombia, Chile, and Mexico, thus analyzing the contrasts in economic growth and the collection of existing taxes among the OECD members. For Colombia to match in GDP per capita to Mexico would have to grow 49.4% and to Chile 144.6%. Per capita tax collection is also low; reaching Mexico means increasing it by 28.7% and Chile by 162.7%, and that none of these Latin American countries is close to the OECD average, which is 34.2% as a percentage of GDP. The high unemployment rate and low GDP growth in Colombia are not explained in tax collection, as confirmed by Banerjee and Duflo (2020), given that, although nominal rates are high, the numerous exemptions to the tax system permeate your collection.
Table 9 GDP and taxes per capita and the unemployment rate in 2017 as a percentage of the workforce of Colombia, Chile, Mexico, and OECD
| Country | GDP | Census | GDP per capita | Taxes % GDP | Tax per capita | Unemployment Rate (%) |
|---|---|---|---|---|---|---|
| Colombia | 311.790 | 48.258 | 6.461 | 18,8 | 1.215 | 9,4 |
| Chile | 277.746 | 17.574 | 15.804 | 20,2 | 3.192 | 6,7 |
| México | 1.157.736 | 119.938 | 9.653 | 16,2 | 1.564 | 3,4 |
| OECD | 34,2 | 5,8 | ||||
| Population census in millions and GDP in millions of dollars at current prices. | ||||||
Source: Calculations made by the author based on DANE (2018), INE (2017), INEGI (2015), Banco Mundial (2019), and OECD (2020b, 2020c, 2020d).
Table 10 projects the real growth of Colombia, ceteris paribus, to equal the current per capita rate of Chile and Mexico, respectively, at more than 4% and 9% per year for at least one decade; high rates at which GDP would have to grow discounting inflation and without taking into account population growth.
Table 10 Projection of real growth of Colombia’s GDP to match Chile and Mexico
| GDP | In 5 years (MG-1) x 100 (%) | In 10 years (MG-1) x 100 (%) | In 15 years (MG-1) x 100 (%) |
|---|---|---|---|
| Chile | 19,59 | 9,36 | 6,14 |
| Mexico | 8,36 | 4,10 | 2,71 |
| Calculation: MG= n (𝑥 1 ) (𝑥 2 )…( 𝑥 𝑛 ) . | |||
Source: Authors’ own elaboration.
Graph 1 shows the real growth of the country’s GDP between 2006-2019, maintaining a long-term average of 3.92%, 0.18% below that required to equal Mexico and 5.44% to Chile in the medium term. Moreover, growth above the average of the last 14 years has only coincided with higher oil prices.
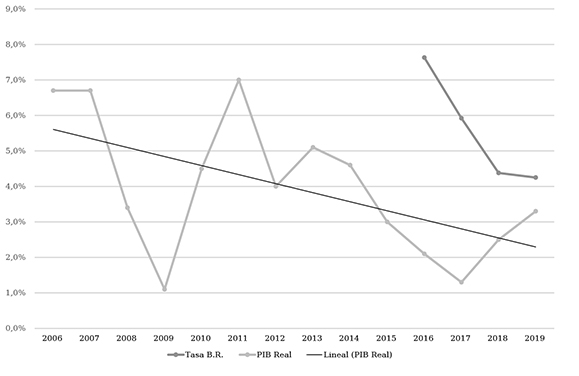
Source: Calculations made by the author based on DANE (2020b) and Banco de la República (2020b)
Graph 1 Real GDP growth in Colombia 2006-2019 and average intervention rate 2016-2019
This new government is betting on greater growth using a procyclical policy with a view to the years 2020-2022, given the exemptions and reduction of tax rates in the last tax reform accompanied by the lower intervention rates established by the Banco de la República, which have fallen from 7.75% in August 2016 to 4.25%, the current rate as of January 2020.
To grow further, no new tax exemptions or reductions were necessary, with the information from the income declarations for the taxable year 2017 Garay and Espitia (2019) found that the 500 wealthiest companies in the country pay taxes at an average effective rate close to 1.8% of their gross income and the 300 wealthiest people in the country do so at a rate of 2.26%. What is worrying about this economic policy is that, with a fall in GDP, the government would be forced to collect the taxes that were not collected in these last two reforms, thus strangling the economy in a possible recession.
The government lost this growth momentum and the unenforceability of the 1943 law, to carry out a comprehensive tax reform that would respond to the characteristics of a good tax system: justice, efficiency, flexibility, transparency and, above all, administrative simplicity (Stiglitz and Walsh, 2009). A per capita taxation like in Mexico, only in taxes administered by the DIAN, would have raised an additional $ 31,195 billion in 2018, allowing education that year to grow by 1.8 times its original budget, which was the highest item.
7. Conclusions
The entry of Colombia into the OECD requires it to adapt its taxation to international standards, which implies increases in its collection, reducing horizontal inequity, eliminating exemptions and reinstating the wealth tax, and increasing vertical progressivity, maintaining the constitutional principles of equity, efficiency, and progressivity. The tax system is consistent with its economic model, but it must tend to tax higher rates on higher incomes and without favoring capital income over work income.
The fall in oil prices reduced public revenues, which could not be replaced internally due to the absence of an industrial policy and the failure of economic openness due to the lack of export diversity. The dependence of the government on the natural resource endowment model revealed that lowering taxes on companies generated a crisis in public finances that, finally, they had to correct and replace with higher consumption taxes in so-called structural tax reform, which by itself cannot change the economic model, in accordance with the concept of the economic constitution that has established the economic order from the State.
The current government is again betting on reducing taxes on companies because they will generate growth and employment, for instance, the formalization of companies that pay taxes and employees who contribute to social security. However, with the growth law, fewer taxes will be collected; this means that another tax reform is imminent, one that does collect what has been stopped collecting and following the needs of the public budget.
Finally, when comparing the country with Chile and Mexico, which belong to the OECD, the precariousness of both GDP and per capita tax collection is noted. What is being proposed here is comprehensive taxation with progressive rates and without exemptions, which would collect more taxes, even with lower nominal rates, and would allow a better distribution of the public budget to promote a more significant economic growth with employment.

