


 Inglés (pdf)
 Articulo en XML
 Referencias del artículo
 Enviar articulo por email
 Citado por SciELO
  Citado por Google
  Similares en
SciELO
Similares en
SciELO  Similares en Google
 Permalink
Introduction
Scanning electron microscopes (SEMs) are a key tool in materials engineering departments worldwide. A SEM allows analyzing technological materials with a resolution down a to few nanometers. It can be equipped with different analyzing tools (i.e., the so-called Analytical-SEM). This includes backscattering electron diffraction EBSD, energy dispersive spectroscopy, EDS, wave-length dispersive spectroscopy, WDS, X-ray tomography, XRT, X-ray fluorescence, XRF, cathodoluminescence, CL, among others. Although elemental analysis using EDS in SEM is intrinsically less accurate than either WDS or XRF (or even other techniques not implemented in SEM), EDS microanalysis is the most used among them, as it is an inexpensive, less time-consuming, simpler technique that demands less operator training (Newbury and Ritchie, 2015). Most SEM facilities worldwide are equipped with EDS detectors. The concentration of atomic species is carried out by EDS, both with and without standards (Newbury and Ritchie, 2013). On the one hand, elemental analysis with standards typically leads up to a 5% standard error in the mean concentration for major elements. This is known as quantitative analysis (Newbury and Ritchie, 2013). On the other hand, standardless analysis could lead up to a 50% standard error in the mean concentration for major elements, which is why this approach is called semiquantitative or qualitative analysis (Newbury and Ritchie, 2013). Despite the inaccurate nature of the standardless approach, more than 98% of EDS microanalyses are performed with it (Newbury and Ritchie, 2015). In recent years, the structure of EDS detectors has been significantly improved, as is the case of the development of silicon drift detectors (SDD). This recently developed family of EDS detectors has an improved energy resolution, is more sensible to low energy photons, operates with negligible dead times, and has better pulse processing electronics than the former Si(Li) detectors (Burgess and Holland 2013; Carlton 2009; Gernet, 2008; Maniguet et al., 2012, Streli et al., 2004). Quantitative EDS elemental analysis with SDD detectors could potentially exhibit an accuracy similar to the concomitant accuracy of WDS analysis (Cubukçu et al., 2008; Newbury and Ritchie, 2015; Ritchie et al., 2012).
The precision of EDS elemental analysis is very dependent on the signal-to-noise (S-to-N) ratio and the background-corrected count intensity of the peaks in the spectrum (Lifshin and Gauvin, 2003; Newbury and Ritchie, 2019; Wassilkowska 2014). On the one hand, such peaks in the EDS spectrum show a Gaussian behavior (Franchi, 2017; Rackwitz, 2010; Scholze, 2009), which allows relating the background-corrected count intensity to the elemental concentration uncertainty. Here, the higher the counts, the lower the uncertainty. On the other hand, the detectability of minor species is related to the S-to-N ratio, with threshold values being established for defining major species, minor species, and traces, as well as for defining the detection limit as a function of the S-to-N ratio. A complete presentation of these computations is outside the scope of this work, and the reader is advised to consult the works by Goldstein et al. (2018) and Liao (2006).
In SEM facilities worldwide, the standard error of the mean EDS concentration is commonly reported as an integer factor of the concentration uncertainty (Goldstein et al. 2018; Liao 2006). As the concentration uncertainty is straightforwardly correlated to the S-to-N ratio, when accurate measurements are desired, it is a common practice to conduct EDS elemental analysis under SEMEDS operating conditions, which leads to high S-to-N values. Further research is needed to establish the actual relationship between precision and accuracy in standardless EDS analysis with SDD detectors.
In general terms, the operating conditions optimized for high-resolution and high-quality SEM morphological analyses are not the same as those needed for optimized accurate elemental analyses (Goldstein et al., 2018; Liao, 2006). Although that disagreement between optimal operational conditions for either morphological or elemental analysis is well known for microscopists, it is a customary practice to carry out EDS standardless elemental microanalysis under the very same operational conditions as those used for imaging. Further research is needed to quantitatively determine how much is the accuracy of standardless EDS analysis affected when the SEM-EDS operational conditions are far from optimal for chemical microanalysis.
In this study, EDS experiments were carried out with stainless steel (SS), varying the operational conditions for acquiring EDS spectra, i.e., the acceleration voltage (V0), working distance (WD), electron beam intensity, and count number (the latter through variations in the live acquisition time). The aim of this work was to appraise the effects of variations in EDS operating conditions regarding both the percent uncertainty and percent discrepancy of the elemental analysis of UNS 31603 SS.
Experimentation
SEM-EDS experiments were carried out with UNS S31603 SS. The SS samples were 2 mm-thick cylinders cut from a commercial hot-worked bar of 19 mm in diameter. For reference, the SS's chemical composition was assessed by optical spectroscopy (at-%): 18,0 Cr, 9,1 Ni, 1,8 Mn, 0,8 Si, 1,2 Mo, 0,14 C, and bal. Fe. The samples were initially ground in emery paper, increasing the mesh number up to 1 200, and finally polished in diamond paste slurry, with the final stage in slurries with an average particle size of 1 Lim. The RMS roughness parameter of polished samples was around 2-5 nm (as assessed by atomic force microscopy).
EDS experiments were carried out in a Tescan Vega 3 scanning electron microscope (SEM) equipped with an XFlash 410-M SDD detector from Bruker, which was cooled by a Peltier. The FWHM for Mnka was 128,0 eV. The energy scale division was 5 eV/channel. No electron dose was registered. The acquisition and post-processing of EDS spectra were carried out by using the ESPRIT 1,9 software. By means of this software, a deconvolution of the Bremsstrahlung vs. the characteristic X-ray radiation in the raw EDS spectra was performed, and the background-corrected peak intensity for every radiation line in the EDS spectra was recorded. An automatic analysis setup was used. From both the background-corrected peak intensities recorded and the intensity of the Bremsstrahlung, the S-to-N ratio was computed. From the peak characteristic intensity, the percent uncertainty was calculated as the standard deviation of the counts in the peak while assuming it followed a Gaussian distribution (Liao, 2006). The percent discrepancy was computed as the percent difference between the reference chemical composition assessed by optical spectroscopy and the chemical composition assessed by EDS. This percent discrepancy is usually called relative error in EDS analysis (Newbury and Ritchie, 2015). This research assumed that the lower the relative error, the more accurate the elemental concentration assessed. The following were set as the initial EDS operating conditions: V0 25 kV, WD 15 mm, electron beam intensity 12 a.u., spot size 150 nm, live time 60 s. From those initial operating conditions, experiments were carried out, varying only one of the following parameters: (i) V0 between 5 and 25 kV, (ii) beam intensity between 6 and 14 a.u., (iii) WD between 10 and 20 mm, and (iv) count number between 3x10³ and 8x10⁵ a.u.
Results and analysis
Figure 1 shows typical EDS spectra obtained by varying V0. It depicts the characterization of Mo via the L line, the characterization of Si is shown by means of the K line, and the characterization of Cr, Mn, and Fe is shown by the K line at V- between 10 and 25 kV and by the L line at 5 kV. The characterization of Ni is shown by the Ka line at V0 between 15 and 25 kV and by the L line at 5 and 10 kV. In the EDS spectra (Figure 1), it can be observed that the Mnka and Crkp lines strongly overlap. Therefore, Mn was characterized after deconvoluting of those two lines, which makes its quantification strongly unprecise. The EDS spectra show that the major alloying elements are Cr and Ni (bal. Fe), while Si, Mo, and Mn are minor alloying elements, which is in trivial accordance with the chemical composition assessed by optical spectroscopy.

Figures 2 to 5 show the percent uncertainty, percent discrepancy, and S-to-N ratio as a function of variations in V0 (Figure 2), electron beam intensity (Figure 3), WD (Figure 4), and count number (Figure 5).

Source: Authors
Figure 2 Effects of V0 variations on the discrepancy and uncertainty of the assessed elemental composition and the S-to-N ratio of spectral peaks. Left: major elements; right: minor elements. Beam intensity: 12 (a.u.); spot size: 150 nm; WD: 15 mm; and live time: 60 s.
Source: Authors
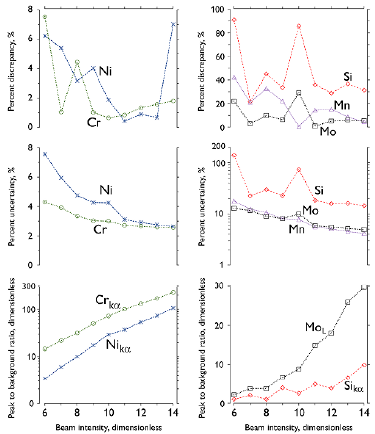
Figure 3 Effects of variations in the electron beam intensity on the discrepancy and uncertainty of the assessed elemental composition and the S-to-N ratio of spectral peaks. Left: major elements; right: minor elements. V0: 25 kV; WD: 15 mm; and live time: 60 s.
The results of this research regarding the S-to-N ratio (Figure 2 to 5) follow the trends well-known for microscopists worldwide: the S-to-N ratio increases as the (i) V0, (ii) beam intensity, and (iii) counts number increase, or (iv) when the WD is closer to a factory-reference optimal value. As the S-to-N ratio increases, the precision of elemental concentration increases (i.e., the percent uncertainty decreases), which is also a classical result in the realm of EDS error analysis. However, the accuracy of the elemental concentration (analyzed on the basis of the percent discrepancy) did not show a monotonic relationship with the precision, which is not consistent with the common conception at SEM facilities, where it is assumed that the standard error of the mean EDS concentration is proportional to the percent uncertainty (EDS analysis software have a report routine where the SEM microscopist can choose the confidence interval for the chemical composition, and then the software routine associates the concentration percent error to an integer factor of the percent uncertainty). The results of this work contradict this rule of proportionality, and, to the best of our knowledge, this is the very first report with actual experimental data where the precision and accuracy are compared for standardless EDS microanalysis carried out with a SDD detector.

Source: Authors
Figure 4 Effects of WD variations on the discrepancy and uncertainty of the assessed elemental composition and the S-to-N ratio of spectral peaks. Left: major elements; right: minor elements. Beam intensity: 12 (a.u.); spot size: 150 nm; V0: 25 kV; and live time: 60 s.

Source: Authors
Figure 5 Effects of variations in the count number on the discrepancy and uncertainty of the assessed elemental composition and the S-to-N ratio of spectral peaks. Left: major elements; right: minor elements. Beam intensity: 12 (a.u.); spot size: 150 nm; V0: 25 kV; WD: 15 mm.
The percent discrepancy of the Cr and Ni concentrations shows a smooth decreasing relationship with the increase in the S-to-N ratio when V0 varies (Figure 2), as well as a roughly decreasing relationship with the S-to-N ratio when the beam intensity varies (Figure 3). However, there is a not well-defined relationship between the percent discrepancy of the Cr and Ni concentrations and the S-to-N ratio. Regarding the minor species (Si, Mo, and Mn), an overall decrease in the percent discrepancy takes place as the S-to-N ratio increases, but that relationship is also not well-defined.
The results (Figures 2 to 5) show that, if X-ray spectra are acquired under SEM operating conditions that are very dissimilar to the optimal conditions for microanalysis, which leads to a decreased S-to-N ratio (i.e., when the V0, beam intensity, or count number are lower, or when the WD is far from 15 mm), both the detectability limit of minor species (Si, Mo, and Mn) and the uncertainty of the concentration of major alloying elements (Cr and Ni) are appreciably impaired. In particular, the morphological analysis of nanometric phases or particles is generally carried out in the SEM with low values of V0 (around 6-12 kV), beam intensity (around 6-10 a.u), and working distance (around 6-10 mm), conditions which are not well suited for EDS analysis. On the other hand, failure and coarse microstructures analyses are carried out at high values of V0 (20-30 kV), beam intensity (10-14 a.u.), and working distance (14-20 mm). The results of this study show that the latter are adequate operating conditions for EDS analysis, provided that the WD is limited to around 16 mm.
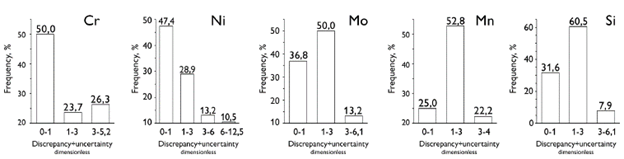
Figure 6 shows the distribution histograms for the ratio between the percent discrepancy and the percent uncertainty. It can be seen that the analysis of the major alloying elements is more accurate than that of the minor species. For Cr and Ni, around 25% of the data points have percent discrepancies higher than three times the percent uncertainty. Thus, it is concluded that the relationship between the percent discrepancy and the uncertainty does not follow a normal statistic distribution.
Source: Authors
Figure 6 Overview of the ratio between the percent discrepancy and the percent uncertainty
Figure 7 shows the effect of variations in the S-to-N ratio on the percent discrepancy, the percent uncertainty, and the ratio between the percent discrepancy and the percent uncertainty. On the one hand, a clear and smooth decrease in uncertainty can be observed as the S-to-N increases. On the other hand, a rough decrease in the discrepancy can be seen when the S-to-N ratio increases from 1 to around 20 (dimensionless). However, when the S-to-N ratio increases from around 20 to 300 (dimensionless), the discrepancy decreases only marginally. For lower S-to-N ratios (i.e., lower than around 20) the percent discrepancy randomly oscillates between zero and three times the uncertainty (which is in accordance with a normal distribution). Nonetheless, for higher S-to-N ratios (i.e., higher than around 20), the percent discrepancy randomly oscillates between zero and six times the uncertainty (which is not in accordance with a normal distribution). When the percent uncertainty is very low (lower than around 3%), it becomes clear that the standard error of the mean EDS concentration does not follow a normal distribution. It is worth highlighting this result, as it does not agree with the common practice in SEM lab facilities, where the error of the elemental concentration is reported as either ±1 or ±3 (said standard deviation is assessed via a Gaussian analysis of the characteristic peaks in the EDS spectra).

Conclusions
The S-to-N ratio could be improved by increasing the acceleration voltage, beam intensity, and total acquisition time, or setting the working distance near 15 mm. This increase in the S-to-N ratio is associated with an increase in the precision of the elemental concentration, but there is no clear increase in accuracy when the S-to-N ratio increases.
If X-ray spectra are acquired under operating conditions that are very dissimilar to the interval optimal conditions for EDS microanalysis, which leads to a decreased S-to-N ratio, both the detectability limit of minor species and of the uncertainty in the concentration of major alloying elements are significantly impaired.
When the percent uncertainty is lower than around 3%, the standard error of the mean EDS concentration does not follow a normal distribution concerning the percent uncertainty. It was observed that, for the major alloying elements, 25% of the measurements had a percent discrepancy higher than three times the standard deviation.

