Inglés (pdf)
 Articulo en XML
 Referencias del artículo
 Enviar articulo por email
 Citado por SciELO
  Citado por Google
  Similares en
SciELO
Similares en
SciELO  Similares en Google
 Permalink
Introduction
Food security and sovereignty in Colombia face numerous challenges due to the continuous increase in the population, climate change, international conflicts, pandemics, and the high dependence on imported food and supplies. Therefore, cost-efficient, high-quality protein that meets the needs of the human and animal populations should be pursued. Due to its high protein, unsaturated fatty acids, and carbohydrate content, soybean constitutes an excellent nutritional source for human populations and animal feed. It is also an important alternative crop for sustainable rotation due to its nitrogen fixation ability (Ritchie & Roser, 2021).
The agro-climatic conditions to produce soybean seed in Orinoquía are diverse and contrasting. In the first half from April to August, the climatic conditions include high rainfall that affects ripening and leads to wet grain harvest, causing seed deterioration. Seventy percent of this sowing area shows these conditions, with excesses during the entire crop cycle, particularly in the altillanura subregion, where improved soils facilitate surface drainage. On the contrary, in the second half from August to December, 20% is planted in the altillanura subregion, where alternating deficit/excess water periods occur; meanwhile, in the foothills, the remaining 10% of the total area is planted exclusively in this half. The climatic condition is highly relevant when producing seeds, particularly water excess/ deficit and diseases (González et al., 2008). For this reason, it is essential to develop adapted varieties and their recommendation domains to produce high-quality seeds suitable to the conditions of the Orinoquía. The knowledge of the genetic variations allows classifying contrasting genotypes regarding adaptation, earliness, production, and seed quality to design effective genetic breeding strategies.
Viability and vigor are the most critical genetically controlled seed quality traits, with significant repercussions on production; their variability is due to gene pool differences. The physiological and biochemical mechanisms by which this variability is expressed are not yet fully understood, but they are significantly influenced by the genotype (G), the environment (E), management practices, and their interactions (Bellaloui et al., 2011). Interactions are responsible for the differential response of genotypes to environmental diversity (Allard & Bradshaw, 1964).
Biplot graphs are useful in analyzing the GxE interaction, classifying the main effects in an easy-to-interpret way, estimating magnitude and direction and allowing the visualization of the best germplasm combination per environment and a more efficient selection (León Castillo et al., 2005). These graphs allow investigating the response pattern of varieties in different environments. Furthermore, they increase the information available than the more standard regression methods and principal component analysis (PCA) without needing additional calculations (Kempton, 1984).
The site regression (SREG) model is frequently used for data analysis from multi-environment comparative yield trials, especially in those that are determinant in the influence of the genotype and their interaction. It includes G+GxE in the bilinear term, providing a graphical analysis of yield and stability behavior of genotypes called the GGE-biplot, identifying genotypes with the highest potential in each environment and group's genotypes and environments with similar response patterns (Ibáñez et al., 2006).
The adequate interpretation of the GxE interaction is critical in deciding which variety will be used and where the high-quality seed will be produced. It is not enough to have a variety with high germination power; it must also have yield potential and stability to obtain the greatest benefits in producing high-quality seeds. Vargas Hernández and Crossa (2000) describe the ease of interpreting the interaction from the SREG-GGE-biplot, where the genotypes with yields above the average are located on the right margin of the vertical reference line, and those on the left margin have lower-than-average yields. Likewise, the biplot allows visualizing the most productive environments.
Accordingly, this research aimed to evaluate the effect of the GxE interaction on germination, vigor index, and seed yield of six soybean varieties under the edaphoclimatic conditions in the Colombian Orinoquía region in order to facilitate decision-making on the adaptation domains and recommendations to produce high quality and quantity seeds.
Materials and methods
Study area and plant material
The research was carried out with six varieties, five of Colombian origin (Corpoica Superior 6 and Orinoquía 3 with days to maturity (DM) between 78 and 85 d, Soyica P34, Corpoica Taluma 5, Agrosavia Primavera 11 and the Brazilian variety Barreira with DM between 95 and 105 d. These were evaluated in five environments of the Colombian Orinoquía region, two in the second half of 2020 (LIBB: La Libertad, TALB: Taluma) planted in August, and three in the first half of 2021 (LIBA: La Libertad, TALA: Taluma, finca LEONAS) planted in April-May. These varieties show adaptation to the Colombian lower tropics (Valencia-Ramírez & Ligarreto-Moreno, 2012).
Experimental design
Six soybean varieties were planted in five environments in a complete randomized block design with four replicates; each experimental unit consisted of six rows separated by 45 cm, with plants 5 cm apart, with a useful/work plot in the four central rows. Chemical fertilization was adjusted according to the soil analysis, and the biological fertilization of nitrogen was carried out with Bradyrhizobium japonicum (commercial product Rhizobiol-Agrosavia at 1 L ha-1 according to the manufacturer recommendations).
Evaluation variables
The response variables to measure seed quality were germination (GER), vigor index (VI), and seed yield (SY), defined as follows:
GER percentage (ISTA, 2016);
Germination speed (number of seeds that emerge per day after sowing for 5 d);
Viability, according to the tetrazolium test (FAO, 2019);
Electrical conductivity, according to Marcos Filho (2015);
Seed vigor index (VI): Composed of standardized values (mean 0, deviation 1) of seeds germinated with normal seedlings (GERe), germination speed at day 5 (V5De), viability (Ve), and electrical conductivity (CEe) according to Equation 1:

Seed yield (SY) according to Equation 2. Seed weight per area unit (YIELD) corresponded to clean and classified seeds dried to 14% moisture, which is the recommended commercial moisture content (%).

Statistical analyses
A combined analysis of variance was performed for GER, VI, and SY using the General Linear Model procedure of the SAS statistical program. Normality and homogeneity assumptions of variances were analyzed by the Shapiro-Wilk (1965) and Bartlett tests, respectively, with this same statistical program. The GxE interaction was evaluated using the SREG-GGE-biplot methodology proposed by Crossa et al. (2002), Burgueño et al. (2002), and Yan and Kang (2003) to measure the specific adaptation and phe-notypic stability (Eq. 3).

where Yge - average performance of genotype g in environment e, µ - overall mean, ße - deviations from environment means, N - number of Principal Components (PCs) retained in the model, λn - singular PC value, "γgn - genotype vector values for each PC, δen - environment vector values for each PC, and ρge - residual.
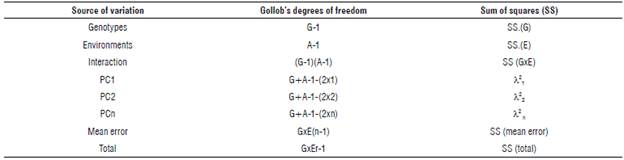
The SAS program for the SREG-GGE fixed effects and Gollob's test (Suppl. Tab. 1), mentioned by Vargas Hernández and Crossa (2000) to determine the significance of each SREG term, were obtained from www.cimmyt.cgiar.org/biornetrics. When GxE was significant, the GGE biplot statistical tool facilitated interpreting the GxE interaction according to Yan et al. (2000).
Stability (VE) was calculated according to Purchase et al. (2000) to establish the phenotypic stability of each variety depending on the environment (Eq. 4).

where VE - GGE stability value, SS-PC1 and SS-PC2 are sum of squares of PC1 and PC2 with the highest contribution to the variance, and PC1score and PC2score are values of components 1 and 2 per genotype, respectively.
Results and discussion
The combined analysis of variance for GER, VI, and SY showed highly significant differences (P<0.01; R2=0.87-0.92; CV=13.3-24.6%). Similarly, highly significant differences (P<0.01) were found for varieties, environments, and their interaction for germination and seed yield. Yan and Rajcan (2002) found similar results in Canada. However, no differences were observed between environments for VI. The statistical significance of the GxE interaction for the three variables implies that the average response of these cannot identify superior varieties since the phenotypic classification varies significantly across environments (Valencia & Ligarreto, 2010). When partitioning the variance components, the highest contribution in GER was by the environment, followed by GxE, for VI the highest contribution was by genotype, and for seed yield, the highest contribution was by the environment (Tab. 1).
TABLE 1 Sum of squares (SS) and contribution of the total variance by source of variation for germination (GER), vigor index (IV), and seed yield (SY) of soybean varieties in the Colombian Orinoquía region.
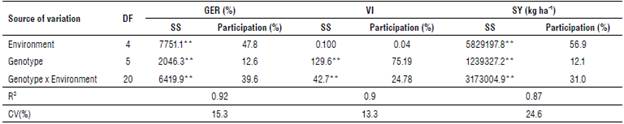
**Highly significant differences (P<0.01) according to a combined analysis of variance (ANOVA).
The PCA and SREG-GGE-biplot graphs allowed interpreting the GxE interaction, defining variety performance (yield) through the environments and determining the specific or general varietal adaptation. The highest contribution of the variance was in the first two components, with an accumulated value of 89.31% for GER, 96.65% for VI, and 77.4% for SY (Tab. 2). VI was measured in the most critical environments of the first half, of greater interest since the environmental conditions due to excess water were very marked from physiological maturity to grain harvest.
TABLE 2 Participation of the variance by the principal and accumulated components for germination, vigor index, and seed yield.
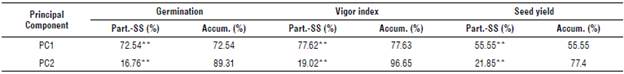
Part.-SS - participation in Sum of squares; Accum. - accumulated components.
**Highly significant differences (P<0.01) according to a principal component analysis (PCA).
The first component (SREG) represented the highest proportion of the variability, with the highest negative projection for the variety Agrosavia Primavera 11 in GER, VI, and SY; meanwhile, Corpoica Superior 6 and Orinoquía 3 had the highest positive projection (Tab. 3). Regarding the environment, the highest negative contribution for GER and SY was registered in TALB, and the highest positive projection in TALA. For VI, no statistical differences were observed in the three environments. These results indicate that TALA was the most discriminating environment for GER and SY due to its higher PC1 projection, which is highly relevant for future genetic breeding programs.
TABLE 3 Means and principal components PC1 and PC2 per variety and environment.
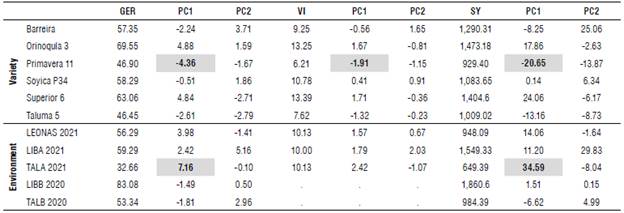
GER - seed germination (%); VI - vigor index; SY - seed yield (kg ha-1). GxE interaction analysis (GGE-biplot).
GxE interaction analysis (GGE-biplot)
The edaphoclimatic conditions contrasted greatly in precipitation, water excesses and deficits, relative humidity, temperature, and in the physicochemical properties of the soils. This singularity makes the GxE interaction study more relevant to define the best environment to produce high-quality seed and higher grain yield. However, high GxE negatively impacts heritability. Thus, the lower the heritability of a trait, the greater the difficulty in improving that trait via selection (Yan & Kang, 2003).
The main genotypic effect and the GxE interaction of a GxE data set (Yan et al., 2000) are shown in a GGE-biplot, where the variation sources of G and GxE constitute the most critical part of the variation when evaluating varieties (Yan & Kang 2003). This multivariate technique allowed stratifying environments and ranking varieties, clearly separating the LIBA, TALA, and LEONAS environments of the first half vs. LIBB and TALB of the second half and revealing the wide adaptation of the Soyica P34 variety, zero (<GxE). The varieties or locations with negative or positive coordinates furthest from the main axis, such as Orinoquía 3 and Corpoica Superior 6, contributed the most to GxE. In general, the most favorable environment for SY was LIBB, and the most unfavorable were, in order, TALA, TALB, and LEONAS.
Germination-(GGE-biplot)
A clear separation of environments by year halves is observed (Fig. 1). The responses of the second half are found in the left margin, and those of the first half are in the right margin. This differential varietal response is attributed to a specific adaptation (Yan & Kang, 2003). Simultaneously, the biplot separated early varieties (Orinoquía 3, Corpoica Superior 6) from intermediate (Soyica P34, Barreira) and late (Corpoica Taluma 5, Agrosavia Primavera 11). TALA and LEONAS shared the same sector, with similar varietal response, so all the environments are valid for evaluating the germination performance of soybean in the first half. However, TALA, showing a greater projection with less interaction (vector closer to zero in PC2), is the most discriminating environment with the highest varietal differences in germination.
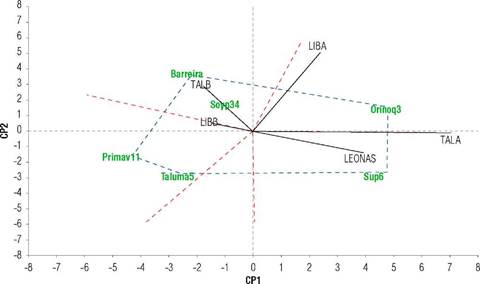
FIGURE 1 Site regression (SREG) (SREG)-model genotype-genotype x environment (GGE) biplot for seed germination of six soybean varieties (Corpoica Superior 6 (Sup6), Orinoquía 3, Soyica P34 (Soyp34), Corpoica Taluma 5, and Agrosavia Primavera 11 of Colombian origin and Barreira of Brazilian origin) in five environments of the Orinoquía region with two in the second half of 2020 (LIBB: La Libertad, TALB: Taluma) planted in August, and three in the first half of 2021 (LIBA: La Libertad, TALA: Taluma, finca LEONAS) planted in April-May.
LIBA is located in a second sector with higher interaction (higher PC2) and a vectorial projection opposite Agrosavia Primavera 11 and Corpoica Taluma 5, indicating an unfavorable GER environment for these. On the left margin, TALB and LIBB were located in sectors three and four. These are similar environments to evaluate in the second half, although LIBB is a more stable and favorable environment for the varieties because it is very close to zero on both axes. Both registered the best levels of GER, but the least discriminating environment is LIBB because it projects a short vector (Yan & Kang, 2003). In LIBA, a situation with high interaction occurred; therefore, it is unrepresentative and discarded for genotype selection processes for GER.
In general, the varieties showed higher average germination in LIBB (83.1%), characterized by its higher fertility with a cation exchange capacity of 3.14 meq/100g, organic matter contents of 2.39%, and phosphorus content of 5.94 mg kg-1, with 715 mm of water availability throughout the crop cycle, and low presence of foliar and seed pathogens. The exception was Corpoica Superior 6 (71% GER) due to excess water between maturity and harvest and a greater incidence of pathogens (Phomopsis sp.) TALA registered the most unfavorable edaphoclimatic conditions for seed germination, with frequent and intense rainfall (478 mm) prevailing in the final phase of the cycle, and higher presence of foliar diseases such as Cercospora sojina and Xanthomonas axonopodis, and seed pathogens such as Phomopsis sp. and Fusarium sp. Pádua et al. (2009) demonstrated that water stress in the soybean grain-filling stage reduces seed germination, worsened by high temperatures (>28°C). In this environment, Corpoica Superior 6 and Orinoquía 3 registered the best performance of germination (68.2 and 75%, respectively) compared to the others (<26%). In the GER-biplot, Barreira, Soyica P34, Corpoica Taluma 5, and Agrosavia Primavera 11 recorded the highest GER in the second half in LIBB and TALB. Corpoica Superior 6 registered its highest germination in LEONAS (85.8%) and Orinoquia 3 in LIBA and TALA of the first half (75%). These two varieties in the first half, characterized by excess water, show relatively better behavior in GER due to their genetic attributes, such as greater earliness (>95 d after emergence) and uniform maturation without foliar retention, favoring grain quality. The most unfavorable environment for these two varieties was TALB, mainly attributed to the water deficit in the phenological stages between R5 and R7. Drought in the critical stages of seed formation and filling decreases seed size and germination capacity (Sánchez & Pinchinat, 1974).
In the GGE-biplot, PC1 represents the main effects or average behavior of the genotype, and PC2 represents the GxE effects per genotype, considered a stability measure (Yan et al., 2000). Based on the stability analysis proposed by Purchase et al. (2000), Soyica P34 was the most stable (VE=2.9), and Corpoica Superior 6 (VE=21.1) and Orinoquía 3 (VE=21.2) were the most unstable. However, the most stable variety had a lower average germination percentage than the most unstable ones, suggesting a varietal-specific adaptation to produce high-quality seeds. The GER of Soyica P34 ranged between 25.9 and 69.3% in the first half; therefore, together with Barreira, Corpoica Taluma 5, and Agrosavia Primavera 11, they are not recommended for planting in the first half due to their higher leaf retention, longer cycle and sensitivity to foliar and seed pathogens.
The contrast between the environments and the differential response of varieties is notorious. LIBB was characterized by excess water in the growth and development periods and little water in the physiological maturity to harvest period. This circumstance favored the uniform drying of the plants and the lower attack of pathogens. At the same time, TALA showed excess water at the end of the vegetative cycle, noticeably affecting intermediate and late varieties, which suffered leaf retention, green stems, and higher pathogen attack.
Sowing in the altillanura subregion is traditionally carried out in April, with harvest in July-August, months with high rainfall where the seed has high water content (>18%), a condition that causes its rapid deterioration. On the contrary, in the altillanura and foothill subregions, sowing is done in August and early September and is harvested in the dry period of December-January, where the seed reaches a favorable humidity (13-15%), showing a differential response of the varieties attributed to adaptation, earliness, uniformity at maturity and resistance to both foliar and seed pathogens. Environmental stress in soybean plant cultivation reduces germination and vigor even in healthy seeds (Egli et al., 2005).
Vigor index (GGE-biplot)
The VI, as a variable composed of germination, viability, and electrical conductivity, was assessed only in the first half due to the high vulnerability of the seeds to excess water that deteriorates, and favors the presence of pathogens. In the GGE-biplot, a PC1 dimension with the highest positive contribution for Corpoica Superior 6 and followed by Orinoquiaí 3. Soyica P34 was the most stable, with the vector closest to zero in both dimensions, while the others, such as Agrosavia Primavera 11, had a negative and more marked response in projection (Fig. 2).
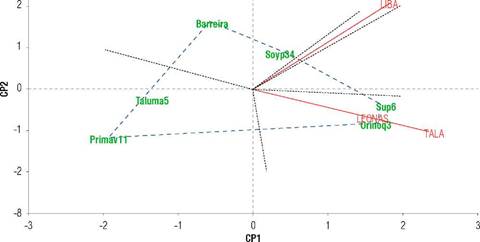
FIGURE 2 Site regression (SREG)-model genotype-genotype x environment (GGE) for seed vigor index in three environments (LIBA: La Libertad, TALA: Taluma, finca LEONAS) of the Colombian Orinoquía.
TALA and LEONAS showed similar behavior, discriminating similarly the varietal behavior in VI. Consistent with the GER response, the biplot for VI showed the similar performance of the varieties in LEONAS and TALA, very distant from LIBA with higher positive interaction. The first two belong to the altillanura subregion, and the second to the foothills, suggesting that the geographical location has a high relevance in the differential response of the varieties.
The varieties with the highest VI were Corpoica Superior 6 and Orinoquía 3, with positive values. For its part, Soyica P34 was the most stable variety; the rest of the varieties showed a negative response in their order: Barreira, Corpoica Taluma 5, and Agrosavia Primavera 11 (Fig. 2). These results evidence that the varieties with higher GER showed higher VI with a highly significant correlation (P<0.01) of 81%. These results suggest that it is enough solely to carry out germination tests to establish a seed quality opinion.
Seed yield (GGE-biplot)
In seed yield response variable composed of the SY and the GER percentage, a clear separation of environments is observed (Fig. 3), with a greater positive projection for the three environments of the first half, similar to GER. LIBB showed a positive projection for both PCs and was considered a more stable environment, and TALB exhibited a slightly negative projection for PCI and a positive one for PC2 (Fig. ЗА). An opposite response is found in LEONAS and TALA. Although they similarly discriminate varieties concerning SY, TALA has a greater projection and proximity to the abscissas. It is the most favorable environment for selecting future lines with comparative advantages in SY. According to Yan et al. (2000) and Yan and Rajcan (2002), sectors with higher values in PCI and lower in PC2 receive the greatest interest because they facilitate discrimination for the trait under study. They also improve the effectiveness of the selection process for superior genotypes. The ideal evaluation environment could have a high PCI and be more discriminating of the genotypes regarding the main genotypic effect. Furthermore, it also could have a small PC2 coefficient as the most representative of the environments (Yan & Rajcan, 2002).
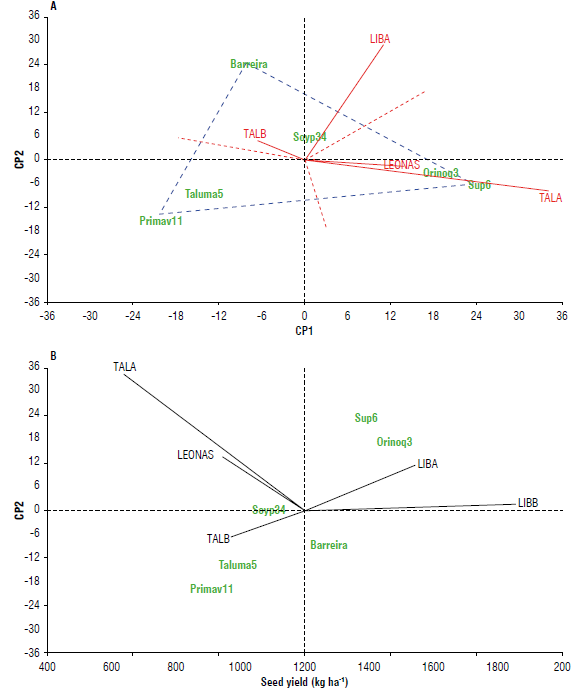
FIGURE 3 A and B) Site regression (SREG)-model genotype-genotype x environment (GGE) biplot for seed yield in five environments of the Orinoquía region, two in the second half of 2020 planted in August (LIBB: La Libertad, TALB: Taluma), and three in the first half of 2021 planted in April-May (LIBA: La Libertad, TALA: Taluma, finca LEONAS).
In contrast, seed yield selection may not be successful in LIBA, with a low relative PCI value and a high relative PC2 value. On the other hand, LIBB, a more stable environment, and TALB, with very low interaction, show similar varietal behavior for SY; therefore, the selection in these environments is not relevant. According to Crossa et al. (1990), environments with PCI close to zero have little interaction and low genotype discrimination. Blanche and Myers (2006) state that a discriminant locality maximizes the phenotypic variation observed between genotypes for a specific trait. Genotype selection efficiency and success in genetic breeding programs are high in these locations. The discriminating ability of a locality comprises various factors, including soil type, pathogens, field drainage, temperature, precipitation, soil fertility, and management practices.
Concerning varietal behavior, Orinoquía 3 and Corpoica Superior 6 had a positive projection for PCI and a low negative projection for PC2. Soyica P34, the most stable variety (VE=0.4), presented values close to zero. The rest of the varieties registered negative PC2 components. Agrosavia Primavera 11 recorded the highest negative projection for both components and was highly unstable (VE=56.4) (Fig. ЗА). This variety has the worst SY performance in the first half, followed by Corpoica Taluma 5, demonstrating varietal differences in adaptation. This differential response of soybean genotypes in contrasting environments has previously been reported (Ngalamu et al., 2013; Salmerón et al, 2017).
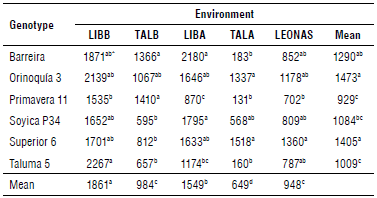
The highest average SY was registered in LIBB and LIBA, and varieties Orinoquía 3 and Corpoica Superior 6 stood out (1,473 and 1,404 kg ha-1, respectively), while the others reached a much lower value than the average (1,210 kg ha-1) (Fig. 3B). In general, all the varieties performed best in LIBB, with statistical differences in SY between Agrosavia Primavera 11 and Corpoica Taluma 5. The early varieties Corpoica Superior 6 and Orinoquía 3, as well as Barreira, significantly outperformed Agrosavia Primavera 11 and Corpoica Taluma 5 (Tab. 4). TALB showed alternating rainy and dry periods, where water deficit predominated, particularly in the phenological stages R5 and R7. Rainfall and temperature are the main factors responsible for grain yield fluctuation in much of the tropics (Carmello et al., 2016).
In Taluma or LEONAS, complementary irrigation must be applied during the second half of the year, since the water deficit was the most decisive factor for seed quality and quantity in all varieties. If high seed quality and quantity need to be produced in the first half, only varieties adapted to this edaphoclimatic condition that are early or precocious and have uniform drying should be planted. Moreover, fungicides must be applied to protect the seeds from pathogenic fungi, and a seed drying unit must be used to lower seed moisture gradually without affecting the embryo at a temperature below 40°C.
Orinoquía 3 and Corpoica Superior 6 stood out for their higher average varietal response (GER, VI, and SY), with a highly favorable response for planting in the first half. In this period, high frequency and intense rainfall predominates and these early varieties ripen and dry uniformly up to harvest without leaf retention. Although Orinoquía 3 and Corpoica Superior 6 can perform well in the second half with good management practices, the same does not occur with Agrosavia Primavera 11 Barreira, Corpoica Taluma 5, and Soyica P34 in the first half. This is because they are intermediate to late varieties showing genetic leaf retention at physiological maturity and uneven maturation, which delays harvesting, facilitating pathogen proliferation. These genetic traits are vital to close the gap regarding the quality and quantity of seed produced in Orinoquía, particularly in the altillanura subregion, where the only adequate strategy is genetic breeding.
Conclusions
The GxE interaction is highly relevant for defining the adaptation domain and recommending varieties with high germination potential and seed yield. The SREG-GGE-biplot graphic analysis identified TALA as the most discriminating and useful environment for genetic breeding processes focused on quality and seed yield.
Varieties Corpoica Superior 6 and Orinoquía 3 stood out for their better performance and seed quality due to their earliness, uniformity, and high seed yield potential. Seed germination potential and seed yield depended on the variety and the environment; GxE did not allow for generalization. The second half was the best time to produce seeds, particularly in La Libertad, with an advantage over Taluma. Moreover, La Libertad was the best environment to obtain better yields in the first half.