


 Inglés (pdf)
 Articulo en XML
 Referencias del artículo
 Enviar articulo por email
 Citado por SciELO
  Citado por Google
  Similares en
SciELO
Similares en
SciELO  Similares en Google
 Permalink
INTRODUCTION
Legume protein extracts have relevant physical, nutritional, and functional properties in the food processing industry, including emulsifying, nutritional, thickening, and water absorption abilities. As a result, extensive research has been completed on characterizing nearly all aspects of common cultivars of legumes, pulses, and their extracts [1, 2]. Although the characterization of legume protein has been an area of focused research for decades, extracts from legume varieties cultivated in South America have yet to be characterized thoroughly.
One cultivar of the common bean (Phaseolus vulgaris L.), native to the central Andes of Peru, is known as the ñuña, numia, or Andean popping bean (ÑB) [3-8]. The ÑB is similar to other beans in size (0.5 to 1 g) and morphology [3, 4, 9]. However, instead of being boiled before human consumption, ÑB is toasted, fried, parched, or microwaved in a similar manner to popcorn, which causes the seed coat to burst and the cotyledons to enlarge [5, 10, 11]. The resulting product has an agreeable flavor similar to popcorn, toasted soy nuts, or peanuts with a texture similar to malted milk ball [10,11]. Additionally, ÑB fat content (~1.3%) is lower than that of other beans, making a defatting step unnecessary during protein isolation [4, 11-13].
ÑB is widely available in its native region [8, 9, 13, 14], where it is cooked and eaten as a side dish or as a lightweight, easily transportable snack [8, 11, 13, 14]. Production in Perú ranged from 1,150 to 1,831 metric tons between 2008 and 2017 [15, 16], making it available for at least the niche market. Additionally, ÑB is slowly becoming more familiar outside of its native range. US-based and Andean nation researchers are presently taking more serious notice of the potential of ÑB [13, 14, 17-22]. Research has already been conducted on the genetics of popping properties of ÑB [21, 22] and on producing cultivars that can withstand the daylength variations of a temperate climate [10, 22]. At present, there are at least two consumer-oriented US providers of the bean [23, 24].
Given that ÑB is growing in familiarity worldwide but lacks extensive characterization, we analyze ten important physicochemical properties of ÑB protein extract, focusing on using this extract as a nutritional additive in processed foods.
MATERIALS AND METHODS
Preparation of ñuña bean protein extract (ÑBPE)
ÑB were rinsed in water for 10 minutes, peeled manually, dried for 12 hours at 32 ˚C, and ground to an 80-mesh (0.18 mm) size. For each production lot, 50.0 g of the resulting flour was used. The flour was combined with 750 mL of distilled water. The pH was adjusted to 10-11 using concentrated NaOH (aq). The suspension was agitated at room temperature (1 h, 7,700 g, 20 ˚C). The pellet was discarded, and the pH of the supernatant was adjusted to 3.5 with 1N HCl (aq). The protein was precipitated for 15 minutes at 4 ˚C. The suspension was centrifuged (7,700 g, 20 min, 10 ˚C), and the supernatant was discarded. The precipitate was rinsed with distilled water (5 mL of water per g precipitate), centrifuged again (7,700 g, 20 min, 10˚C), and the supernatant was discarded. The rinse step was repeated. The resulting protein pellet was dried using an oven (32 ± 3 ˚C for 14 h) or lyophilizer (Free Zone 4.5 L, LABCONCO) to produce ÑBPE. The desiccated pellet was stored at room temperature and weighed to the nearest 0.1 g. [25]
Protein extraction yield
Protein content of bean flour and protein extract were measured in duplicate using the Micro-Kjeldahl method [26] with a nitrogen-to-protein conversion factor of 5.7. The extraction yield was determined as the per-lot ratio of the mass of protein in ÑBPE to the total mass of protein in the bean flour precursor expressed as a percentage.
Foaming properties
ÑBPE (1.5 g) was combined with phosphate buffer (pH 7, 100 mL), mixed in a blender for 5 minutes, and rinsed with 10 mL of water into a graduated cylinder. Volume readings were taken 1 and 20 minutes after mixing. The before mixing volume (110 mL) was compared to the subsequent volume readings to determine foam percentage. Foaming capacity and foam stability were calculated as previously reported [27].
Water absorption properties
ÑBPE (0.5 g) and distilled water (7.5 mL) were combined in a tared tube and mixed for 1 minute. The sample was incubated at room temperature for 30 minutes, and centrifuged (1,000 g, 30 min). The supernatant was decanted, and the mass of the wet pellet was measured. Water absorption capacity (WAC) was calculated as the mass of water retained per mass of dry pellet [28].
Proximate Analysis
Moisture, ash, and fat content analyses were performed in duplicate according to standard methods [26]. The protein content of ÑBPE was determined using standard Kjeldahl, Bradford, and Biuret methods. The Kjeldahl method was discussed previously. The Bradford and Biuret assays were performed according to manufacturer instructions (Sigma Aldrich ®, St. Louis; product numbers B6916 and T1949) using bovine serum albumin standards. Bradford and Biuret analyses were performed in triplicate, and results reported as the percentage of protein in the sample. Total carbohydrate was calculated by subtracting the total content of water, protein, fat, and ash from the total mass of ÑBPE.
Color analysis
The color of ÑBPE was determined using a Minolta CR-400 colorimeter that used CIELAB color space (L a* b*) and performed in duplicate.
Isoelectric point determination
ÑBPE (0.5 g) was dissolved in 25 mL of distilled water, and pH was adjusted to 3, 4, 5, 6, 7, and 8 using 1M HCL or 1M NaOH. The suspensions were stirred for 2 h at room temperature and then centrifugated (10 min, 4,800 g, 4°C). The protein concentration of the supernate was measured by Bradford assay. Solubility was expressed as the ratio of the protein content in the supernatant over the total protein in the sample; the isoelectric point was considered to be the pH with minimum solubility.
Electrophoretic analysis of protein extract
ÑBPE was separated using sodium dodecyl sulfate-polyacrylamide gel electrophoresis (SDSPAGE). The sample was dissolved in a saline phosphate buffer (PBS) at a concentration of 1 mg/ mL of protein, and heat-denatured with Laemmli lysis buffer for 3 min at 90 ˚C [29] at 2:1 sample: Laemmli buffer ratio. The sample (15 µL) was run in a Mini Protean II unit (Bio-Rad Laboratories, Hercules, CA) at 100 V for 30 min, using 4% stacking and a 10% resolving polyacrylamide gel. A wide range of unstained protein standard was used as a mass reference (Novex-Thermo Scientific). Bands in the gel were stained using Coomassie blue.
Viscosity analysis of protein extract
An aqueous 25% w/v suspension of ÑBPE was prepared and adjusted to pH 7. Viscosity at 20 ˚C was measured using a Brookfield viscosimeter (model RVDV - III+, USA) with a 21 cm spindle at 100 rpm.
Thermogravimetric analysis (TGA)
TGA was conducted using a Malvern TGA-Q500 analyzer (New Castle, USA). ÑBPE (6 mg) was heated from 20 °C to 1,000 °C at a rate of 20 °C/min using a nitrogen flow rate of 90 mL/min. The loss of mass was measured as a function of temperature. The negative first derivative of the curve was taken to locate inflection points.
Amino acid analysis
A sample of protein extract was sent to a certified laboratory (Bio-Synthesis, Inc., Lewisville, Texas) for amino acid testing. ÑBPE (50 mg) was hydrolyzed in 6 N HCl for 24 h at 110 ˚C. The product was resuspended in water and derivatized with 6-aminoquinolyl-N-hydroxysuccinimidyl carbamate. The sample was then quantized for all amino acids using an HPLC-fluorescence system. Glutamic acid and glutamine, and aspartic acid and asparagine are reported together. This method typically has a low probability of recovery of tryptophan and cysteine. Results were compared to previously published work by plotting each amino acid concentration of one sample against the same amino acid concentration of another and calculating the coefficient of determination (R2).
RESULTS
Composition and physicochemical properties
Table 1 summarizes measured physicochemical properties of the ÑBPE.

Solubility and isoelectric point
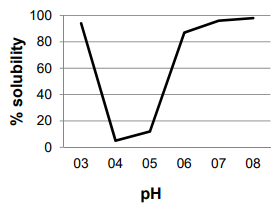
The solubility of ÑBPE is high at both low and high pH, resulting in a U-shaped solubility curve. Given that protein’s solubility decreases at its isoelectric point due to the loss of favorable waterprotein interactions, the isoelectric point of ÑBPE can be estimated from the observed solubility minimum between pH 4 and 5 [Figure 1].
Electrophoretic analysis
ÑBPE was separated by electrophoresis [Figure 2]. The gel image shows three bright bands between 40 and 50 kDa that accounts for nearly all of the protein in the extract.

Thermogravimetric analysis (TGA)
There were four inflection points on the mass curve as the heat was increased [Figure 3], indicating that there are four major steps in the sample’s pyrolysis.

Figure 3 Thermogravimetric analysis of ÑBPE. The blue line tracks the percentage of mass remaining given a temperature. The red line is the smoothed inverse of the first derivative of the remaining mass curve. Peaks in the negative first derivative line represent inflection points; temperatures where the mass is changing most quickly. Red numbers depict the temperature at the local maxima of the DTG line. The raw data for this figure is available as Supplemental Dataset 1.
DISCUSSION
Protein content and extraction yield
Raw ÑB has a protein content of about 20% [4]. This concentration tends to be on the lower end of other bean and pea cultivars, which tend to have a protein concentration between 20-30% [1,2]. ÑB may have a higher starch, moisture, and fiber content, which may relate to its popping properties.
During previous optimization experiments, it was found that both high pH and a large waterto-bean flour ratio improved yield of ÑBPE [12]. We decided to use a pH of 10-11 and a ratio of 50 g flour to 750 mL of water for extraction to avoid significant alkaline hydrolysis of the protein and balance experimental constraints. Using lower pH and water-to-bean flour ratios are likely viable routes, but yields may decrease. The typical protein yield for various lots was between 75 and 80%. These yields are reasonable given previously reported isolations using similar conditions on related beans. For instance, isoelectric precipitation using an initial solution step of pH 9.5 yielded 73, 80, 68, and 53 % for chickpea, lentil, broad. and kidney beans [30].
Proximate Analysis
The protein content of ÑBPE was measured using the Biuret, Bradford, and Kjeldahl methods [Table 1]; measured concentrations agree closely with each other (<10%). However, there was a 75.4 % recovery of amino acids during the amino acid analysis. This decreased recovery can be explained by incomplete derivatization or hydrolysis, protein glycosylation, or destruction of labile amino acids. The other components measured (fat, ash, moisture, and carbohydrate; Table 1] represent impurities that are likely carryovers from the extraction procedure.
The proximate analysis results of ÑBPE are nearly the same as those for isoelectric precipitates of other beans, such as kidney beans, chickpea, lentil, fava beans, black beans, pea, and soy [1,27, 31-35], where protein concentrations ranged between 70 and 90%. Adjustment of the pH of the acidic precipitation step and a defatting step may also improve the yield and purity of ÑBPE.
Protein Solubility
A U-shaped solubility curve [Figure 1] is characteristic of bean proteins; all tend to have a pI between 4 and 5, including ÑBPE. Very similar solubility curves have been generated for proteins in cowpeas, kidney bean, peas, lentils, chickpea, common bean, pinto bean, scarlet runner bean, mung bean, and soy [1, 2, 27, 28, 33, 35, 36]. This indicates that the isoelectric point and solubility profiles of bean protein extracts are all nearly the same.
Water Absorption
The water absorption of ÑBPE was measured to be 3.5 g water/ g protein extract. This value is within a factor of two to measurements of other bean protein isolates, such as soy [28], mung bean [36], chickpea [33], fava bean, and pea [34]. These differences are based on the solvent accessibility of polar side groups on these protein extracts. It seems that most bean protein isolates, including that of ÑB, absorb water at about 3±2 g water/g protein extract.
Color
ÑBPE appears as a grayish orange powder with L, a* and b* values of 77.34, 0.22, and 16.54, respectively [Table 1]. The color of ÑBPE is very similar to isoelectric bean protein extracts, such as isolates from chickpea, broad bean, and lupin [33, 37], kidney beans [32]; however, soy protein extract was darker [38].
Viscosity analysis of protein extract
Three measurements of the viscosity of a 25% w/v solution of ÑBPE yielded a viscosity of 27.5 ± 2 mPa•s [Table 1]. A similar analysis completed on great northern bean protein got a nearly identical viscosity of a 10% solution [39]. Similarly, work on P. vulgaris, and P. coccineus proteins indicated a more highly viscous solution than measured here [35]. However, this viscosity was similar to lupine bean protein concentrates at a similar concentration [40]. These results show that ÑBPE may be a less efficient viscosity enhancer than other bean protein extracts.
Foaming properties
Measurement and comparison of foaming properties depend on pH, homogenization method, and extract type. Foaming capacity for different protein extracts under different conditions varies widely, from above 500% to 26%; however, the large proportion of bean protein isolates seem to fall within the range of 50 to 100% foaming capacity [1, 2, 36, 41]. The value measured here, 50%, means that half of the foam volume is lost in 20 minutes, which indicates a low-to-moderate foaming capacity. Therefore, the isolate is unsuitable for applications where an abundant stable foam is required; but it may be appropriate where much foaming is not desirable, as in protein drinks.
Electrophoretic analysis
Electrophoretic separation of ÑBPE [Figure 2] produced three intense bands of mass between 40 and 50 kDa. This electrophoretic pattern is consistent with the subunits of the protein phaseolin. Phaseolins are a major class of bean storage glycoproteins that belong to the 7S vicilin group with a pI of about 5 [1, 2, 42], also consistent with the pI observed for ÑBPE. It appears that the extraction procedure yielded nearly pure phaseolin with a lack of other common bean proteins, such as lectins and legumins. It has yet to be determined whether the extraction procedure played a role in producing such a pure product, or whether ÑB has a high phaseolin proportion. The observed banding pattern is remarkably similar to pinto bean, common bean, and scarlet runner bean protein isolate electrophoretic bands, although bands for other proteins are relatively more intense in these samples than in ÑBPE [25,28,35]. Phaseolin easily obtained from ÑB has relevance as an industrial feedstock, where highly purified phaseolin is desired, such as in weight-loss products, where it has been investigated as diminishing the absorption of carbohydrates by inhibiting the activity of the enzyme α-amylase [43].
Thermogravimetric Analysis
The first temperature inflection point on heating occurred around 60 ˚C and represented a loss of 5% of the total sample mass. This decrease in mass is most likely the result of water loss from the sample. This percentage loss compares to the measured humidity content [Figure 1]. The second inflection occurred around 313 ˚C and resulted in a loss of about 40% of the mass [Figure 3]. This is most likely from the charring of the protein in the ÑBPE. Other smaller inflection points are most likely the result of the pyrolysis of ash and minerals with continued decarbonization of the protein pyrolysis products. The TGA curve observed here is characteristic of protein samples from pulses such as beans, chickpeas, fava beans, lentils, and peas [44].
Amino acid analysis (AAA)
The AAA results [Table 1] indicate that ÑBPE is particularly rich in glutamine and glutamic acid, asparagine, and aspartic acid, leucine, lysine, phenylalanine, and serine and is deficient in sulfur-containing amino acids. When previously reported amino acid profiles of common pulses, such as pinto [28], common [45, 46], lima [47], tepary [46], soy [28, 31, 48], chickpea [31, 33, 48], lentil [31, 49], pea [50], fava [31, 51], mung [52], African yam [47], mash [53], marama [54] beans and groundnut [48] are compared to each other and the amino acid proportions of ÑBPE, clusters of relative concentration emerge for each amino acid, with all bean AAA profiles following a similar pattern (compare light blue and red dots, Figure 4]. In order to quantify this relationship, the amino acid concentrations of ÑBPE were plotted against the amino acid concentrations of the other beans. These comparison plots resulted in almost straight lines, with the coefficient of determination from regression analysis ranging between 0.62 and 0.99, with 85% of the correlations above 0.8 (Supplemental Dataset 2). The sample with the highest correlation to ÑB was a different P. vulgaris variety grown in the USA, while Lima beans and tepary beans had the next highest correlations. The samples with the lowest correlation were marama bean and groundnut. Coefficients of determination between all possible combinations of profiles ranged from 0.51 to 1.0; 79% of the coefficients were above 0.8 (Supplemental Dataset 2). Additionally, a twosided Dixon test on the data in Figure 4 revealed that no ÑB amino acid concentration should be considered an outlier in the data. These data indicate that there is a high correlation between amino acid profiles of ÑB protein extract and other beans. Furthermore, there was a high degree of correlation between the profiles of other bean varieties. This means that all bean varieties, including ÑB, have amino acid profiles that closely resemble each other. This finding holds true over place and time, as Figure 4 compares results obtained over 45 years and includes samples from Africa, Asia, Europe, and North and South America.
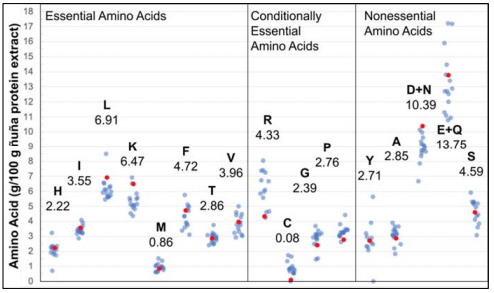
Figure 4 Amino acid profile of ÑBPE (red dots) and its comparison of pinto, common, lima, tepary, soy, lentil, pea, fava, mung, and African yam bean (transparent blue dots). Individual profiles were normalized by dividing the average amino acid content and multiplying by the ÑB average amino acid content. This was necessary because of the different units reported in the literature. Amino acids are represented with one-letter abbreviation, and numbers indicate the amino acid concentration (g/100 g extract) found in ÑBPE. Data and references for this figure are available as Supplemental Dataset 2.
CONCLUSIONS
From its physical and functional properties, ÑBPE has several nearly identical properties to other isoelectric bean protein isolates and may be well suited for similar food additive applications. Still, it is less efficient at increasing viscosity and forming and maintaining foam. This may work to its advantage because ÑBPE could be used where viscosity and foam are less desirable than nutritional enhancement. Therefore, ÑBPE can enhance the nutritional value of fortified beverages and milk, drinkable or vegan yogurts, weight-loss supplements, or powdered protein supplements for human or animal consumption. It is also possible that using ÑBPE could add unique marketing dimensions to the resulting product, such as connections with Perú and the Andes, organic, nonGMO agriculture, and support of small farmers. Indeed, increasing consumer awareness of other native Andean crops, such as quinoa, amaranth, camu camu, aguaymanto, inka corn, and sacha inchi, has increased demand for these products.

