


Servicios Personalizados
Revista
Articulo
 Inglés (pdf)
 Articulo en XML
 Referencias del artículo
 Enviar articulo por email
Indicadores
-
 Citado por SciELO
 -
 Accesos
Links relacionados
-
 Citado por Google
 -
 Similares en
SciELO
Similares en
SciELO -
 Similares en Google
Compartir

 Permalink
Cuadernos de Economía
versión impresa ISSN 0121-4772
Cuad. Econ. vol.31 no.spe57 Bogotá jun./dic. 2012
THE BRICS IN THE GLOBAL VALUE CHAINS: AN EMPIRICAL NOTE
Lurong Chen 1
1 Ph.D. in International Relations, with specialization in international economics. Research Fellow, United Nations University Institute on Comparative Regional Integration Studies (UNU-CRIS), Bruges (Belgium).lchen@cris.unu.edu. E-mail: Mailing address: UNU-CRIS Potterierei 72, 8000 Bruges, Belgium.
This article was received on January 17 2012, and its publication was approved on May 22 2012.
Resumen
Este artículo explora las interconexiones entre las economías BRIC y la economía mundial a través del análisis de sus competitividades y desventajas claves en las cadenas globales de valor agregado. Además, muestra que las economías BRIC continúan en los fragmentos de menor valor de las cadenas globales de valor agregado. A largo plazo, su crecimiento económico podría estar limitado por la capacidad tecnológica. Por lo tanto, para que los BRIC puedan sostener su desarrollo en el largo plazo, deben enfocarse en mejorar su capacidad tecnológica para ascender en las cadenas de valor.
Palabras clave: Economías BRIC, competitividad, cadenas globales de valor, crecimiento económico. JEL: O11, 020, 040, 053, O30.
Abstract
This paper explores the interconnections between the BRIC economies and the world economy by analyzing their key competitiveness and disadvantages in the global value chains. It shows evidence that the BRIC economies continue in the lower value-added fragments of the global value chains. In the long term, their economic growth might be constrained by technological capacity. Therefore, in order for the BRICs to sustain their development in the long run, they need to focus on improving their technological capacity to move up the value chains.
Keywords: BRIC economies, competitiveness, global value chains, economic growth. JEL: O11, 020, 040, 053, O30.Rèsumè
Cet article explore les interconnexions entre les pays du BRIC et l'économie mondiale en analysant leurs principaux éléments de compétitivité et leurs désavantages dans les chaînes de valeur mondiales. Il démontre que les économies BRIC continuent à se spécialiser dans les fragments à valeur moindre des des chaînes de valeur mondiales. À long terme, leur croissance économique pourrait être limitée par la capacité technologique. Par conséquent, afin que les BRIC puissent soutenir leur développement à long terme, il est impératif qu'ils se concentrent sur l'amélioration de leur capacité technologique pour remonter les chaînes de valeur.
Mots-clés: économies BRIC, compétitivité, chaînes de valeur mondiales, croissance économique. JEL: O11, 020, 040, 053, O30.
The 'BRICs'2 has been an increasingly popular concept in both the public media and academia. The countries of this group of emerging markets share as common characteristics large populations, less developed but fast growing economies, and governments willing to embrace global markets. Quantum changes are predicted in global economic power, with the BRIC countries gaining progressive importance and eventually becoming four of the six largest economies in world by 2050 (Wilson and Purushothaman, 2005) .Moreover, buoyed by their rising economic power, the BRICs states will keep expanding their diplomatic influence and playing more important roles in the international arena both regionally and globally.
Fundamentally, the BRICs phenomenon mirrors a general shift in the international balance of power, with the centre of gravity moving from the North to the South. The implications of the rise of the BRICs are certainly large for the world economy, even if the reality might sensibly differ from the projections conducted by the analysts at Goldman Sachs (O'Neill, 2007). Whether the forecasts will be met depends on how the BRICs improve the growth-supportive policy settings, such as macroeconomic stability, strong and stable political institutions, openness to trade and foreign direct investment (FDI), and a higher level of education.
It is evident that the rapid growth of the BRICs is supported by the integration of the domestic markets into the globalizingworld economy. External factors, such as the global economic environment and the performance of foreign markets are also determinants of the sustainability of their growth. This paper attempts to explore the interconnections between the BRICs economies and the world economy by analyzing their key competitiveness and disadvantages in the global value chains. In addition to the internal economic and political conditions, such global factors should also be taken into account when drawing the economic blueprint for 2050 and to evaluate the sustainability of their growth performance.
The rest of the paper is organized as follows. Section 2 provides facts on the rise of the BRICs economies and their integration in the world economy. Section 3 evaluates the BRICs countries in the context of global value chains and discusses their growth potential. Section 4 concludes.
THE INTEGRATION OF THE BRICS IN THE WORLD ECONOMY
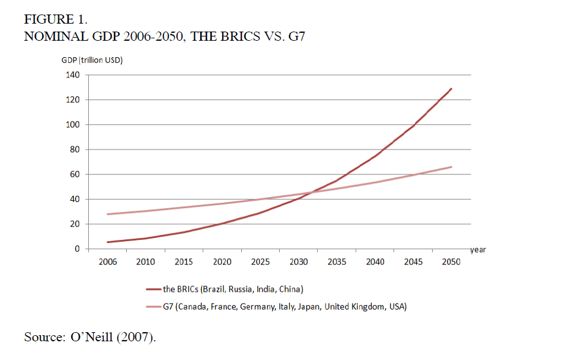
O'Neill (2007) forecasted that the BRICs as a group will overtake the G7 economies in 2032. They will become four of the six most dominant economies in the world; and the combined nominal GDP will be twice as much as that of the G7 in 2050 (Figure 1).
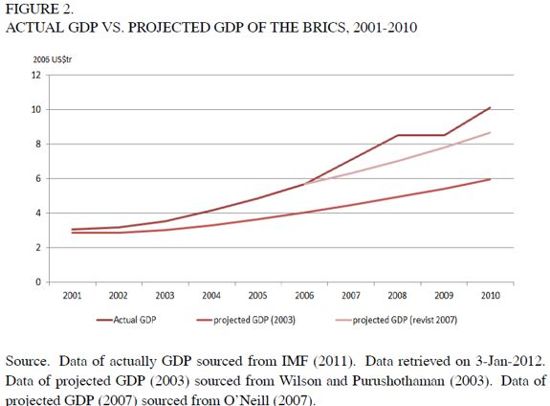
In reality, the BRICs countries grew much faster than that was projected by the Goldman Sachs economists. Figure 2 shows that the combined GDP of the four The BRICs in the Global Value Chains: An Empirical Note Lurong Chen 223 BRICs states increased from around 3 trillion US dollars in 2001 to 10 trillion US dollars in 2010. Although they were not immune to the 2007-2009 global economic crises, the four BRICs states are among those who first moved out of the shadows of crises and resumed high GDP growth. Compared to advanced economies that were trapped in recession and are still on the way of slow recovery, the BRICs have shown their potential to become the main force driving the global economy in the future. Based on the feedbacks from some 827 business directors from 61 countries, an IE Business School study (IE Business School, 2011) reveals that the highest growth rates in 2012 will be found in the BRICs.
Trade and investment liberalization makes it possible for the BRICs to achieve rapid growth via integrating the domestic economy to the world market. It is widely accepted that the world today has become increasingly interconnected as the result of economic, technological, political, sociological, and cultural forces that keep globalizing the world system (Baldwin, 2006). On December 16 2011, the WTO officially approved Russia's membership. All the four BRIC states will be full member of the WTO by 2012.3
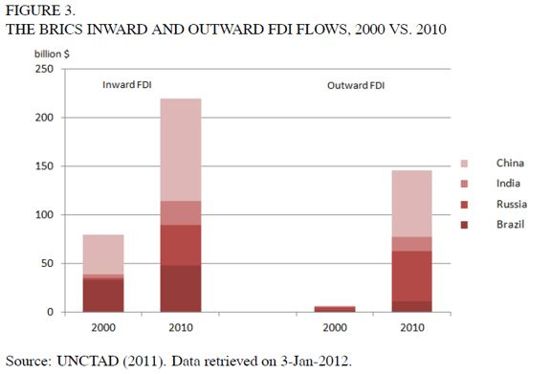
Economically, the BRIC countries are highly connected to the world in terms of international trade, capital flows, and market interdependence. The BRICs share as a destination for global FDI, which has been growing substantially in the past decade. FDI inflows have accounted for more than 10 per cent of their annual fixed capital formation. Especially for Russia, in 2009 and 2010, one fifth of the fixed capital formation sourced from FDI. The combined annual inward FDI flows to the BRICs in 2010 will almost triple the flows in 2000. According to UNCTAD (2011) statistics, the BRICs attracted more than $1.5 trillion or about 12 per cent of world FDI flows during the period from 2000 to 2010. At the end of 2010, the stock of FDI in the BRICs was valued at about $1.7 trillion, almost one-quarter of that of G7. Meanwhile, the BRICs outward FDI also picked up sharply to reach more than 4 per cent of the world as more and more companies expand their global presence. In 2010, more than one-tenth of the world total outward FDI flows were sourced from the BRICs (Figure 3).
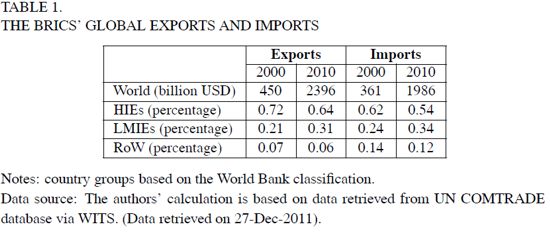
Both the BRICs exports and imports grew substantially as well. Between 2000 and 2010, the BRICs countries together more than doubled their share of world trade. China accounted for over two-thirds of that growth. In 2010, the BRICs accounted for over 17 per cent of the world total exports and almost 14 per cent of the world total imports.
The majority of the BRICs' trade still occurs with high income economies (HIEs). Table 4 shows that from 2000 to 2010 the BRICs' combined trade increased by over four times. HIEs' share in the BRICs' total exports and total imports declined from 72 per cent to 64 per cent and from 62 per cent to 54 per cent, respectively. This is compensated by the expansion of trade between the BRICs and low and middle income economies (LMIEs) during the period. In 2010, over 30 per cent of the BRICs' total exports went to LMIEs markets; while one third of its total imports were sourced from LMIEs.
All four BRIC governments are net foreign (currency) creditors. They accounted for almost 40 per cent of the world's total foreign currency reserves by 2010 (The World Factbook, 2011) 4. China is the dominant contributor, while Russia, India, and Brazil also accumulated substantial amounts of reserves. With China's surplus increasing sharply, the BRICs' combined current account surplus exceeded $280 billion in 2010 (IMF, 2011).
THE BRICS IN GLOBAL VALUE CHAINS
Globalization after the WWII is associated with the emergence of global value chains. Technical advances and economic liberalization have significantly lowered the service cost and internationalized many service activities; and made it possible to divide the previously integrated production processes into various stages (Jones and Kierzkowski, 1990, 2001). International sourcing and the spatial division of sub-stage production processes accelerated the transfer of technology and facilitated developing countries' participation into global production sharing networks. Particularly, the current economic integration is no longer restricted to OECD countries, but also involves large emerging global players like the BRICs (OECD, 2007).
Yet engaging in global value chains can facilitate the access to foreign knowledge and technology and therefore foster economic growth. It will also tie up the domestic and the external market. After achieving rapid economic growth via deeper integration into the globalmarket, in the long term the sustainability of the BRICs' growth depends on how they can move up the value chains progressively. It is therefore necessary to investigate the BRICs' advantages and limitations in global value chains.
As globalization increasingly involves cross border goods, capital and services flows, international trade, and foreign investment become the main channels connecting the BRICs economies to the global value chains.
In principle, a country's economic structure and fundamental competitiveness will to a great extent be mirrored in its pattern of international goods flows and capital flows. The degree of trade dependence of the BRICs countries (as measured by the ratio of total trade to GDP) ranges from 23 per cent (Brazil) to 55 per cent (China)(The World Bank, 2011) 5. Table 2 provides a snapshot of the BRICs' trade of goods and services in 2010.
Roughly speaking, Brazil and Russia are dominant suppliers of raw materials; while India and China are the world's dominant supplier of services and manufactured goods respectively. Except India, who is a net importer of goods but net exporter of services, all the other BRIC states show a surplus in goods trade and a deficit in services trade.
The Brazilian economy is characterized mainly by large and well-developed agricultural and mining sectors. It remains primarily a resource-based economy that is highly geared to international commodity prices. Over 40 per cent of its goods exports are raw materials, particularly metals such as iron ores and copper ores. Brazil is a net importer of capital goods and consumer goods. Its major imports include machinery, chemical products, electrical and transport equipment.
Russia's industrial sectors contributed almost 40 per cent of its GDP. Raw materials, including metal and energy, accounted for the majority of its total exports. On the other side, about one-third of Russia's imports were capital goods, such as vehicles, machinery, and equipment. Russia is the world's largest exporter of natural gas and the second largest exporter of oil. Generally speaking, the economic expansion in Russia in the past decade was mainly driven by energy exports, leaving the country vulnerable to international oil price fluctuations.
India is the only country among the BRICs that has a trade surplus in services. By capitalizing on its large pool of low cost, highly skilled, educated ,and fluent English-speaking population, India has become a major host of offshoring service activities particularly in IT and business process. At the same time, India is a leading exporter of gems and jewelry, textiles, engineering goods, chemicals, and leather manufactures. It is currently heavily dependent on coal and foreign imports of crude oil for its energy needs. In 2010, one-quarter of India's imports (in value) were crude oil.
China's economy highly depends on international trade. The overall scale of its trade (either exports or imports) is much larger than the combined scale of the other three BRICs states. In 2010, about half of China's goods exports were capital goods such as electrical machineries and transport equipments. However, the majority of its trade surplus was indeed generated from its exports of consumer goods such as household electronic appliances and articles of apparel and clothing accessories.
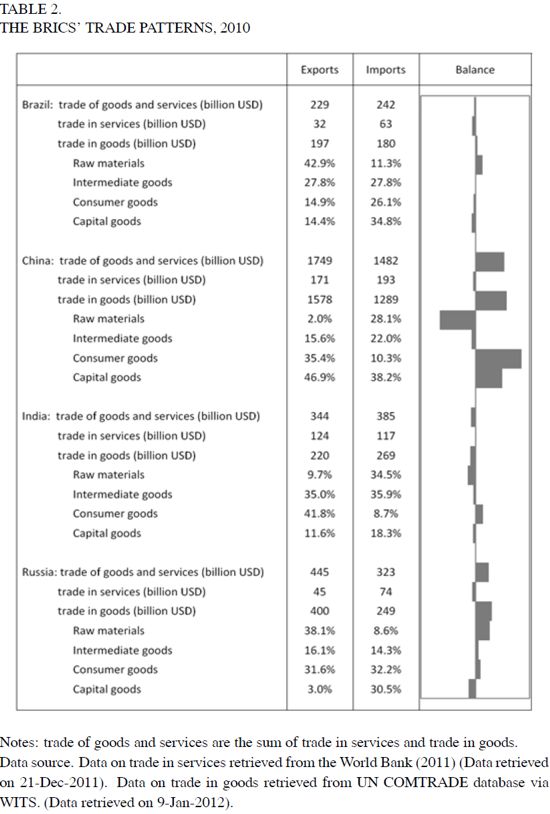
Meanwhile China is in need of raw materials and intermediate goods such as crude oil, iron ore, and refined copper to feed its rapid economic growth. China has become the world's largest consumer of steel, cement, and copper; and the second largest consumer of oil. It accounted for about two-fifths of the growth in global oil consumption since 2000.
It is also worthwhile to point out that China is not only a world factory of manufactures, but also a big supplier and big market of service activities. Indeed, the scale of China's trade in services is much larger than that of India.
The theory of global value chains has highlighted the value-added of different phases of sub-stage production and services. From the perspective of global production sharing, economic growth can be driven by a country's or a firm's upgrading from the relatively lower-valued to the relatively higher-valued activities (Humphrey, 2004; Brach and Kappel, 2009). At the micro level, the concept of upgrading refers to product upgrading, process upgrading, intra-chain upgrading, or inter-chain upgrading (Gereffi et al., 2001); while at the macro level, upgrading may refer to the transition from low value added (i.e. low skill required, labor intensive stages) to high value added phrases (i.e. high skill required, human-capital intensive stages).
The in-depth analysis of the export patterns will help us to assess the BRICs' competitiveness position in the global value chains. This is of relevance because different export structures have different implications for growth and effects on domestic industrial development; and they are the outcome of long, cumulative processes of learning, agglomeration, institution building, and business culture (Lall, 2000).
This paper will focus on analyzing the factor endowments and the technology capabilities as they emerge from the evolution of the BRICs' trade patterns. The classical Heckscher-Ohlin theory assumes identical production technology and shows that a country's comparative advantage is determined by its factor endowment. Since most developing countries are lacking capital and high-skilled labor but abundant in low-skilled labor and/or natural resources, they can participate into global production sharing and find competitive niches in (low-skilled) labor intensive production activities.
In the long run, however, it is technology that plays the key role in determining competitiveness. Loosely speaking, higher technology means higher productivity, and therefore a higher position in the global value chains. For developing countries, the integration in global production sharing facilitates their access to the international knowledge pool and allows them to learn, master, and adapt technologies faster. The patterns of comparative advantage between developing countries vary according to the different paces of technological learning even if they have similar factor endowments (Lall, 1992).
Commodity Aggregation System
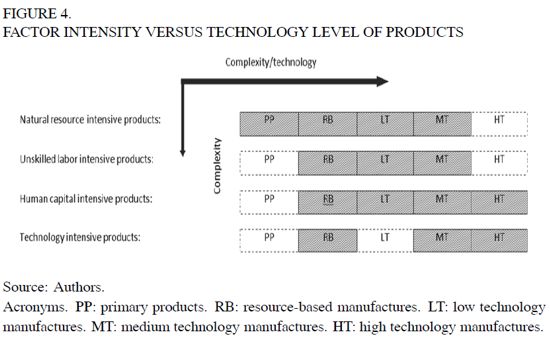
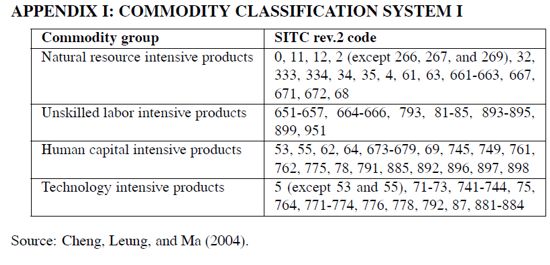
The commodity trade statistics used for our analysis are drawn fromthe United Nations COMTRADE database based on SITC Revision 2 classification. We adopt two commodity aggregation systems to analyse the factor intensity and technology capability of exports, respectively. The first commodity aggregation system was developed by Krause (1982, 1987) who categorized commodity exports into four product groups based on different factor intensities: (a) natural resource intensive products, (b) unskilled labor intensive products, (c) technology intensive products, and (d) human capital intensive products. Cheng, Leung, and Ma (2002) further updated the system and made it compatible with the SITC Revision 2 classification. 6
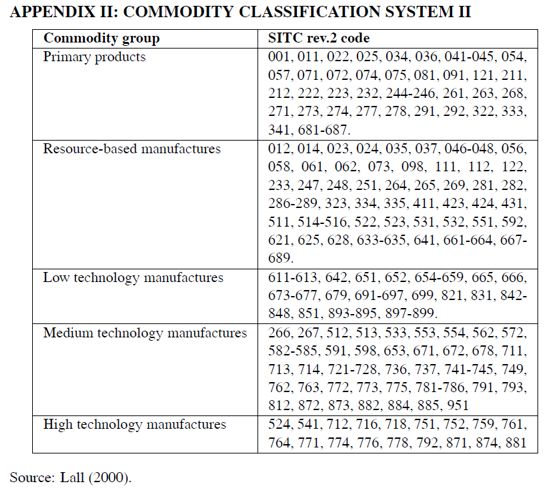
The second aggregation system is based on the technological classification as developed by Hatzichronoglou (1997) and Lall (2000). This classification allows mapping the technological structure of the BRICs, by classifying the traded goods in the following categories: (a) primary products, (b) resource-based manufactures, (c) low technology manufactures, (d) medium technology manufactures, and (e) high technology manufactures.7
Figure 4 shows how the two classifications hang together. As we can see, the production of natural resource intensive goods involves not only primary products but alsomedium-technology manufactures,while human capital intensive products also contain resource-based manufactures.
The revealed export competitiveness of the BRICs
We first of all look at the BRICs' share in the global market as shown in Table 4.
Considering the BRICs as a group, its relative advantage concentrates on exporting low technology manufactures and unskilled labor intensive products. However, the export structure of China is quite different from the others. By excluding China from the group, one can see that their most competitive sectors until 2010 were still primary products and resource based manufactures. Overall, the exports of Brazil, Russia, and India were still dominated by natural resource intensive products.
In the case of China, relocation might be the main force behind the exports of low technology exports. Relatively speaking, low technology manufactures are more cost-sensitive than medium or high technology manufactures. Because of this, more and more manufacturing activities with less technology requirements are moving to China to take the advantage of its large pool of cheap labor. In the long run, however, the room for further development of exports of low-tech products is quite limited due to the limited growth of demand and the slow rate of technical change in these sectors.
Meanwhile, although China has also been achieving substantial market shares in sophisticated products with high technology requirements, it is widely accepted that China is mainly specializing in those labor intensive sub-stage processes within the production of medium or high technology manufactures. The domestic contents of China's exports of technology intensive products are quite limited compared to the four newly industrialized economies (Kierzkowski and Chen, 2009; Chen and De Lombaerde, 2011).
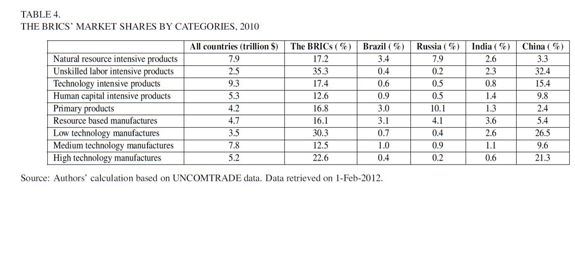
The majority of China's exports are processed exports, and the total imported content of China's export products account for over 50 per cent of the final value (Kwan, 2002). The share of "foreign value added" is even higher in high-tech products than in low-tech products.
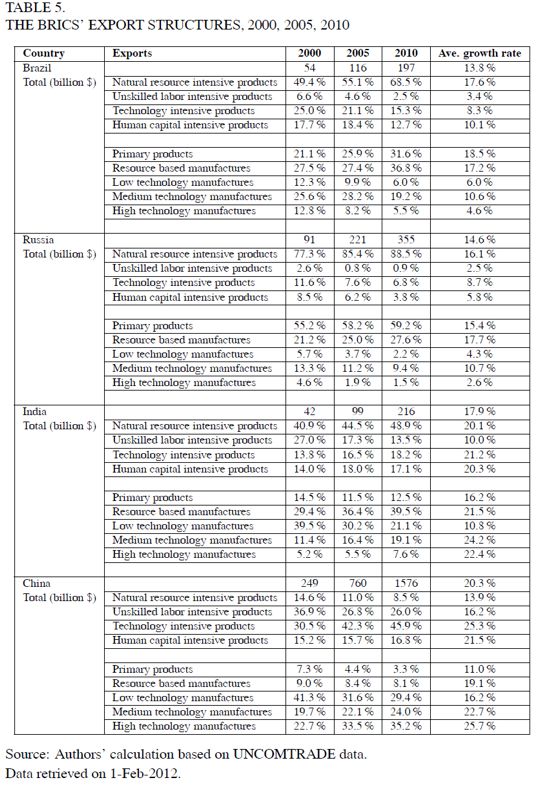
Generally speaking, the BRIC economies are still to be situated at the low valueadded fragments of the global value chains. Their general technological capacity is quite limited compared to the developed countries in the West. To some extent, the tendency to move-up in the value chains could be mirrored in the changes in the export structures. Table 5 shows some structural changes in the patterns of BRICs exports during the past decade. There are several points to note.
First, all the four BRIC countries have achieved high speed growth in their exports. The annual growth rate ranges from 14 per cent (in Brazil) to 20 per cent (in China).This being said, from the perspectives of international trade, the BRICs are growing at different paces and in different directions.
Second, China's export structure has undergone big changes within a period of ten years - the majority of exports shifted from natural resource intensive and unskilled labor intensive products in 2000 to technology and human capital intensive products in 2010. About 60 per cent of China's exports in 2010 were products of high or medium technology manufactures. Technology upgrade is also evident in India's exports, but not as significant as in the case of China. India's exports of technology and human capital intensive products increased by about 7.5 times between 2000 and 2010, much faster than the growth of exports of goods in any other category.
Third, structural changes are found in Brazil and Russia's exports as well, but in the opposite direction. In both countries, the exports of natural resource intensive products realized two-digit annual growth rate during the period between 2000 and 2010. The share of natural resource intensive products in Brazil and Russia increased from 49 per cent and 77 per cent in 2000 to 69 per cent and 89 per cent in 2010 respectively. However, there are differences between the two countries concerning the composition of the exports of natural resource intensive products. In Brazil, exports of resource based manufactures were almost as important as that of primary products; while in Russia, exports were still dominated by primary products even though within the exports of natural resource intensive products the ratio between primary products and resource based manufactures had declined from 3.1 in 2000 to 2.4 in 2010. Meanwhile, although in both countries the exports of technology or human capital intensive products have achieved positive growth, the relative importance of these two groups of products declined significantly; and so did the exports of high or medium technology manufactures.
Fourth, in India the relative importance of the exports of natural resource intensive products increased as well as that of technology or human capital intensive products at the cost of the shrinking exports of unskilled labor intensive products. In 2010, about half of the goods exported by India were categorized as natural resource intensive products. Different from Brazil and Russia's, India's exports of natural resource intensive products were mainly composed of resource based manufactures rather than of primary products.
Comparative advantage or disadvantage
The concept of revealed comparative advantage (RCA) has been applied widely to assess the underlying comparative advantage and disadvantage of an economy. We use the index of the "export revealed comparative advantage" (XRCA) to identify the comparative advantage of the BRICs in certain products or product groups. The XRCA index is defined as the ratio of the share of a country's exports of a product in its total exports of all products to the share of the world's total export of the same product in the world's total exports.
Using data for 2010, we calculate XRCA indices for each product (at three-digit level based on the United Nations SITC rev.2 classification) for the BRICs. We divide export products into two groups using XCRA=1 as a benchmark to distinguish between products with relative comparative advantage (XCRA>1) and products with relative comparative disadvantage (XCRA<1). Over 80 per cent of the BRIC exports in 2010 were contributed by products with relative comparative advantages. With regard to export diversification, China has the highest level of diversification while Russia and Brazil's are highly concentrated compared to India and China's. Russia's comparative advantages concentrated on 30 out of 236 products; and these products with relative comparative advantages contributed to 90 per cent of its total exports in 2010. During the same period, about one-fourth of Brazil's export products corresponded to relative comparative advantages. They accounted for 75 per cent of Brazil's total exports.
Table 6 lists each BRIC country's top ten export products according to comparative advantages (in terms of XRCA) in 2010. It shows the BRICs' comparative advantage in natural resource intensive and unskilled labor intensive products.
Brazil's comparative advantages are mainly based on natural resource intensive products. It is worthwhile to point out, however, that Brazil's top exporter of industrial products is indeed a high technology intensive product - aircraft and associated equipments and parts (product code 792). Brazilian aircraft maker Embraer S.A. is already the third largest commercial aircraft manufacturing in the world(after Boeing in the US and AirBus in Europe). It is the only emerging markets enterprise that managed to break into the top ranks of aircraft manufacturing.
Besides its comparative advantages in exporting natural resource intensive products, Russia is also competitive in exporting manufactured fertilizers, which are classified as a technology intensive product with medium technology requirement. Three of Russia's top ten export products are medium technology manufactures. Russia does also have some comparative advantages in exporting high-tech products, particularly other power generating machinery and parts (product code 718), which accounted for over 7 per cent of the world total exports of products in this category in 2010.
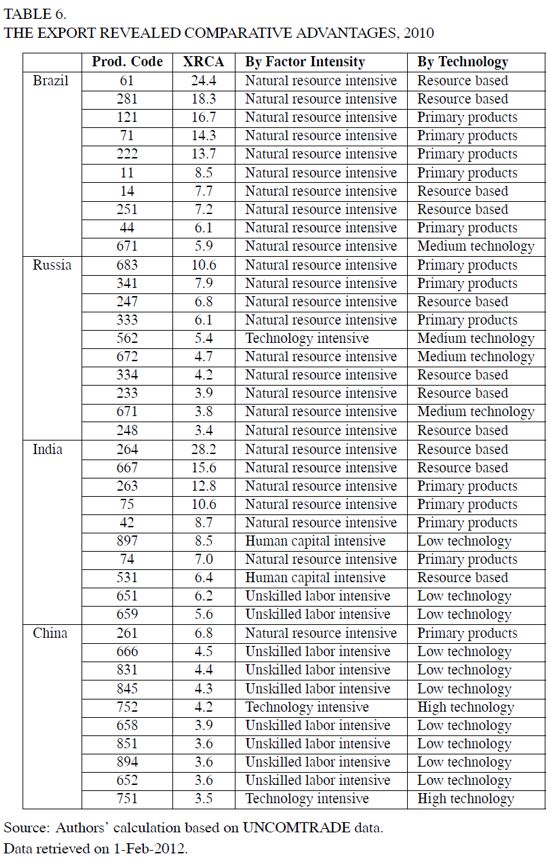
India is the only economy of the BRICs that has human capital intensive products among its top ten export products. However, the technology contents of these products are quite limited -products 897 are low technology manufactures while products 531 are resource based manufactures. Even though the overall share of high technology manufactures in India's total exports is higher than that in Brazil or Russia, there is no sign that India has comparative advantages in exporting high technology manufactures when examining each individual product at the threedigit level.
Seven of China's top ten most "advantageous" export products are unskilled labor intensive low technology manufactures. Silk and pottery, two products that China is traditionally famous for since hundreds of years, are still on top of China's most competitive export products. Compared to the other three BRICs, China shows more comparative advantages for exporting high-tech products. However, as mentioned before, it is still risky to say China has a higher technological capacity than the others.
Behind themassmanufacturing exports of "Made in China" there is indeed "Factory Asia" that is constructed on a "triangular trading system" where Japan and NIEs export capital goods and complex intermediate goods to less advanced economies, such as ASEAN and China, for processing operations (Chen, 2008). The export sectors in China highly depend on the regional production sharing network. For example, Kierzkowski and Chen (2009) show that China's imports of parts and components significantly influence its exports, and up to 60 per cent of China's exports to the U.S. would bear risk if China would not be able to continue to import parts and components.
CONCLUDING REMARKS
Generally speaking, the BRIC economies continue in the lower value-added fragments of the global value chains. In the long term, their economic growth might be constrained by technological capacity.
In the case of Brazil, Russia, and India, primary products and resource based manufactures represent the majority of their exports. The prices of most primary products are mainly manipulated by large multinationals from the advanced economies, and their influence on prices is still quite limited despite the large market share they have achieved. This leaves their exports vulnerable to the price changes in the global markets.
China benefits from foreign supplied intermediate inputs to complement its factor endowment and strengthen its export capability. But this is not risk-free; China's exports face constraints in terms of the demand for final products in the foreign markets, on the one hand, and in terms of foreign supplies of parts and components with high-tech contents, on the other hand.
In short, in order for the BRICs to sustain their development in the long run, they need to focus on improving their technological capacity to move up the value chains.
APEPNDIX
FOOTNOTES
2 The BRICs is an acronym for the four biggest and most dynamic emerging markets -Brazil, Russia,India and China.
3 Following the established procedures, Russia will become an official member after its government ratifies the related documents by the summer of 2012.
4 Data retrieved on 28-11-2011.
5 Data retrieved on 23-Dec-2011.
6 A full list is given in Appendix I.
7 A full list is given in Appendix II.
REFERENCES
1. Baldwin, R.E. (2006). Globalisation: the Great Unbundling(s). Helsinki: Economic Council of Finland. http://www.graduateinstitute.ch/webdqv/site/ctei/shqred/CTEI/Baldwin/Publications/Chapters/Globalization/Baldwin_06-09-20.pdf. [ Links ]
2. Brach, J. and Kappel, R. (2009). Global Value Chains, Technology Transfer and Local Firm Upgrading in Non-OECD Countries. GIGA Working Papers (110). Hamburg: German Institute of Global and Area Studies. [ Links ]
3. CIA (2011). The World FACTBOOK. Washington, D.C.: CIA. https://www.cia.gov/library/publications/the-world-factbook/index.html. [ Links ]
4. Chen, L. (2008). The Market Driven Trade Liberalization and East Asian Regional Integration. IHEID Working Paper (12). Geneva: The Graduate Institute of International Studies. [ Links ]
5. Chen, L. and De Lombaerde, P. (2011). Regional Production Sharing Networks and Hub-ness in Latin America and East Asia: a Long-term Perspective. Integration & Trade, 15(32), 17-34. [ Links ]
6. Cheng, L.K., Leung, S.F. and Ma, Z. (2004). Revealed Comparative Advantages and Intraregional Trade of the World's Three Major Regions: 1980-1995. In Y.K. Kwan and E.H. Yu (eds), Critical Issues in China's Growth and Development. Williston: Edward Edgar. [ Links ]
7. Gereffi, G., Humphrey, J., Kaplinsky, R., and Sturgeon, T. (2001). Introduction: Globalisation, Value Chains and Development. IDS Bulletin 32(3), 1-14. [ Links ]
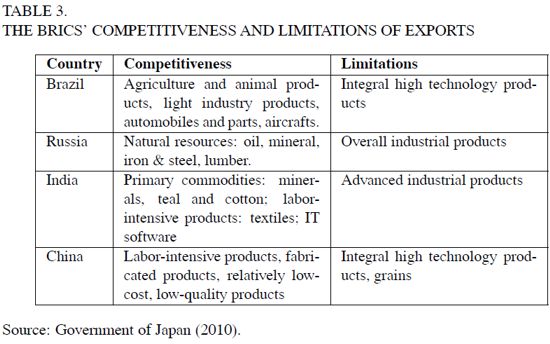
8. Government of Japan (2010). Comparative analysis of BRICs. Tokyo: Government of Japan. http://www.esri.go.jp/jp/archive/hou/hou020/hou16a-2-2.pdf. [ Links ]
9. Hatzichronoglou, T. (1997). Revision of the High-Technology Sector and Product Classification. OECD STI WORKING PAPERS 1997/2. Paris: OCDE. [ Links ]
10. Humphrey, J. (2004). Upgrading in Global Value Chains. ILO Working Paper (28). Geneva: International Labour Organization. [ Links ]
11. IE Business School (2011). Press Releases. http://www.ie.edu/IE/php/en/noticia_php?id=628. Last visit on 12-Jan-2012. [ Links ]
12. IMF (2011). World Economic Outlook 2011. Washington D.C.: IMF. [ Links ]
13. Jones, R. and Kierzkowski, H. (1990). The Role of Services in Production and International Trade: A Theoretical Framework. In R. Jones and A.O. Krueger (eds.), The Political Economy of International Trade: Festschrift in Honor of Robert E. Baldwin (pp. 31-48). Oxford: Basil Blackwell. [ Links ]
14. Jones, R. and Kierzkowski, H. (2001). A Framework for Fragmentation. In: S. Arndt and H. Kierzkowski (eds.), Fragmentation: New Production and Trade Patterns in the World Economy (pp. 17-34). Oxford: Oxford University Press. [ Links ]
15. Kierzkowski, H. and Chen, L. (2009). Outsourcing and Trade Imbalances: the U.S.-China Case. Pacific Economic Review, 15(1), 56-70. [ Links ]
16. Krause, L.B. (1982). U.S. Economic Policy toward the Association of Southeast Asian Nations. Washington, D.C.: Brookings Institution. [ Links ]
17. Krause, L.B. (1987). The Structure of Trade in Manufactured Goods in the East and Southeast Asian Region. In CI Bradford, Jr. and W. H. Branson (eds.), Trade and Structural Change in Pacific Asia, NBER Conference Report (pp. 205-226). Chicago: University of Chicago Press. [ Links ]
18. Kwan, C-H. (2002). The rise of China and Asia's flying-geese pattern of economic development: an empirical analysis based on US import statistics. RIETI Discussion Paper Series, (02-E-009). Tokyo: Research Institute of Economy, Trade and Industry. [ Links ]
19. Lall, S. (1992). Technological Capabilities and Industrialization. World Development, 20(2), 165-186. [ Links ]
20. Lall, S. (2000). The Technological Structure and Performance of Developing Country Manufactured Exports, 1985-98. Oxford Development Studies, 28(3):337-69. [ Links ]
21. Ng, F. and Yeats, A. (2003). Major trade trends in East Asia: what are their implications for regional cooperation and growth. World Bank Working Paper(3084). Washington, D.C.: World Bank. [ Links ]
22. OECD (2007). Moving Up the Value Chain: Staying Competitive in the Global Economy. A Synthesis Report on Global Value Chains. Paris: OECD. [ Links ]
23. O'Neill, J. (2007). BRICs and Beyond, Goldman Sachs Economic Research Group. New York: Goldman-Sachs. [ Links ]
24. TheWorld Bank (2011). World Development Indicator database. Washington, D.C.: World Bank. http://data.worldbank.org/indicator. [ Links ]
25. UNCTAD (2011). UNCTADSTAT. http://unctadstat.unctad.org/ReportFolders/reportFolder.aspx. [ Links ]
26. Wilson, D. and Purushothaman, R. (2003). Dreaming with BRICs: The Path to 2050. Goldman Sachs Global Economics Paper, (99). Boston: Goldman Sachs. [ Links ]
