Introduction
Electrical distribution networks (EDNs) supply electricity to both rural and urban areas at medium- and low-voltage levels 1. These networks are usually designed with a radial topology, which helps reduce costs for conductors and infrastructure, and simplifies the implementation and coordination of protection schemes 2. Nevertheless, radial EDNs entail significant energy losses, as there is only one line to carry electrical energy from the generation point (substation) to each demand node. Generally, energy losses in radial EDNs are within the range of 6 to 18 % of all the power delivered by the generator at the substation, whereas, in transmission systems, energy losses are approximately 2 % 3.
Utility companies have various options to address the issue of power losses in EDNs. These include making changes to the network’s topology and connecting shunt devices 4)-(6. In the case of topology changes, additional transmission lines are used, which connect to or are disconnected from the electrical system to minimize power losses for specific load conditions while maintaining their radial topologies 7. As for the incorporation of shunt systems, the following technologies have been used: distributed generator systems (e.g., solar and wind energy sources) 8, distribution network flexible AC transmission system (D-FACTS) devices (e.g., distribution static power compensators, or D-STATCOMs, static Var compensators, or SVCs, and fixed-step capacitor banks) 9), (10, and energy storage systems such as batteries 11. However, some of these systems are expensive when it comes to only reducing power losses, which does not allow recovering the investment made (e.g., distributed generator systems and energy storage systems). As a result, it is necessary to consider other objectives to justify their installation 11. The dispatch of reactive power can reduce the power losses in EDNs. Hence, systems such as D-FACTS or fixed-step capacitor banks are ideal. Capacitor banks are cheaper compared to distribution static compensators, require minimal maintenance, have a lifespan of over 25 years 12, and are highly reliable 13. Therefore, capacitors are considered to be the most reliable and cost-effective strategy for reducing power losses 10.
Capacitor banks have long been used as a solution to reduce energy losses in EDNs 10, and determining their optimal locations and sizes is of great importance. The problem lies in their mathematical model, which is challenging to solve because it includes two sets of variables (integer and binary). This implies a model with a mixed-integer nonlinear programming (MINLP) structure 14. The variables for the location and size of the new capacitor banks are binary, while the remaining problem variables are continuous. These include voltage profiles, generated and demanded apparent power, and apparent power flows, among others.
Combinatorial methods are commonly used to find a solution for the non-convex MINLP model that determines the location and size of capacitor banks in EDNs. The most relevant methods in this regard are listed below.
The study by 10 used the flower pollination method to effectively select the sizes and positions of fixed-step capacitor banks in radial EDNs. The goal was to reduce the annual operating costs of the grid, which include energy losses and the investments made in capacitors. The flower pollination method was evaluated in four EDNs with 33, 34, 69, and 85 nodes. The simulation results indicated that the proposed method yielded superior solutions when compared to other approaches, including analytical sensitivity methods, fuzzy logic algorithms, and classical genetic algorithms.
The work by 15 suggested using a discrete version of the vortex search approach to find and select suitable fixed-step capacitor banks for installation in EDNs. This work conducted numerical experiments on two well-known test systems consisting of 33 and 69 nodes. The findings indicated that the proposed approach was superior to the flower pollination algorithm in terms of efficiency.
The authors of 16 solved the problem regarding the optimal siting and sizing of capacitor banks in EDNs using the well-known General Algebraic Modeling System (GAMS) software. The authors improved the simulation results by incorporating the classical Chu & Beasley genetic methodology. They used two well-known test systems (33 and 69 nodes) and highlighted that the methodology could handle both EDN topologies (radial and meshed) without any modification.
Another study 17 introduced a heuristic approach for locating and sizing capacitor banks in EDNs. Its primary contribution the full incorporation of grid harmonic distortion into the heuristic optimization approach. This study utilized three IEEE test systems to demonstrate that the proposed algorithm could effectively decrease the total grid costs, surpassing the classical genetic algorithm.
The study by 18 proposed a bi-level methodology for solving the mathematical model for the optimal integration (siting and sizing) of fixed-step capacitor banks in radial EDNs. This methodology consisted of combining the generalized normal distribution algorithm with the optimal power flow method. The latter used a linearization of the power flow and iterated it consecutively to reduce the error, which is known as the successive approximations method. The generalized algorithm was responsible for providing the locations and sizes of the capacitor banks. Meanwhile, the optimal power flow method calculated the operating status of the system with the best configuration, minimizing the expected costs of energy losses. This methodology showed excellent results in several IEEE test feeders consisting of 33, 69, and 85 nodes.
Other algorithms employed for solving the mathematical model for the optimal integration of fixed-step capacitor banks in radial EDNs are the tabu search algorithm 19, the artificial bee colony optimizer 20, the particle swarm optimizer 21, modified genetic optimizers 22, and the cuckoo search optimizer 23, among others.
Although all of the aforementioned methods have shown excellent results, they all share the same problem: none of them ensures the best solution (global optimum) for the optimization model. This suggests that there may be better solutions. Additionally, they need to be calibrated, and, for this reason, their performance may vary among different testing systems. Furthermore, obtaining statistically reliable results requires multiple simulations. To address these issues, the study conducted by 14 proposed a conic programming model for mixed-integer (MI) optimization. This model ensures that an optimal solution to the optimization problem is obtained. However, this model was only evaluated in test systems operating for an hour and did not consider the use of renewable energy sources, which can be impractical in today’s world. Furthermore, this work neglected the stochastic aspects of renewable generators and the demand resulting from their uncertainties. Unlike the previous work, we present a stochastic MI convex model based on a branch flow optimization model. This model incorporates three different levels (i.e., low, medium, and high) regarding the demand and generation by renewable energy sources, aiming to address the stochastic nature of EDNs by considering multiple operating conditions. The contributions of this study are listed below.
A stochastic mixed-integer branch flow (SMIBF) model is presented for the optimal integration (siting and sizing) of fixed-step capacitor banks in EDNs. The proposed SMIBF model incorporates three operating conditions for demand and generation: low, medium, and high levels. These conditions result in a total of nine scenarios.
The proposed SMIBF model aims to minimize two objectives: the annual costs of energy losses and the costs of installing capacitor banks. These two objectives imply that the model is a multi-objective problem solved by incorporating a weighting factor.
Three simulation scenarios are suggested to showcase the stochastic model’s efficiency and compare it against three solvers accessible in the GAMS software.
The structure of this paper is as follows. Section 2 formulates the non-convex MINLP model to locate and size capacitor banks in EDNs. Section 3 formulates the proposed model using the branch flow optimization model. Section 4 outlines the three test feeders implemented and the load-generation scenarios considered. The primary findings and an analysis of the developed SMIBF model are presented in Section 5. Lastly, the main conclusions and proposals for future work are provided in Section 6.
Optimization model
The optimal integration (i.e., placement and size) of fixed-step capacitor banks in EDNs enhances their operating conditions. These conditions are the reduction of congestion in distribution lines, the reduction of power losses, and the improvement of voltage profiles. This means that it is important to carefully select nodes for locating capacitor banks, as well as the banks’ appropriate size, in order to avoid any negative impact on the operation of EDNs. This implies the need for a model aimed at optimally integrating capacitor banks in EDNs. In this vein, this model incorporates both continuous and binary variables. The continuous variables denote the nodal voltages, the power flows of the transmission lines, and the power generated by conventional generation and renewable energy sources, among others. Meanwhile, the binary variables only represent the location of the capacitor banks. The MINLP model for the problem under analysis is formulated below.
Optimization model objectives
The objective function (OF) z used for the optimal integration of capacitor banks in EDNs minimizes two parameters: the annual costs of energy losses (z 1) and the costs associated with capacitor bank installation (z 2). These two objectives indicate that the proposed model is a multi-objective problema solved by incorporating a weighting factor (ω). The use of this factor is referred to as the weighted sum method24, which turns the multi-objective problem into a single-objective one by assigning weights to each objective. Furthermore, the OF is normalized to adequately balance both objectives. Thus, the proposed OF takes the following form:
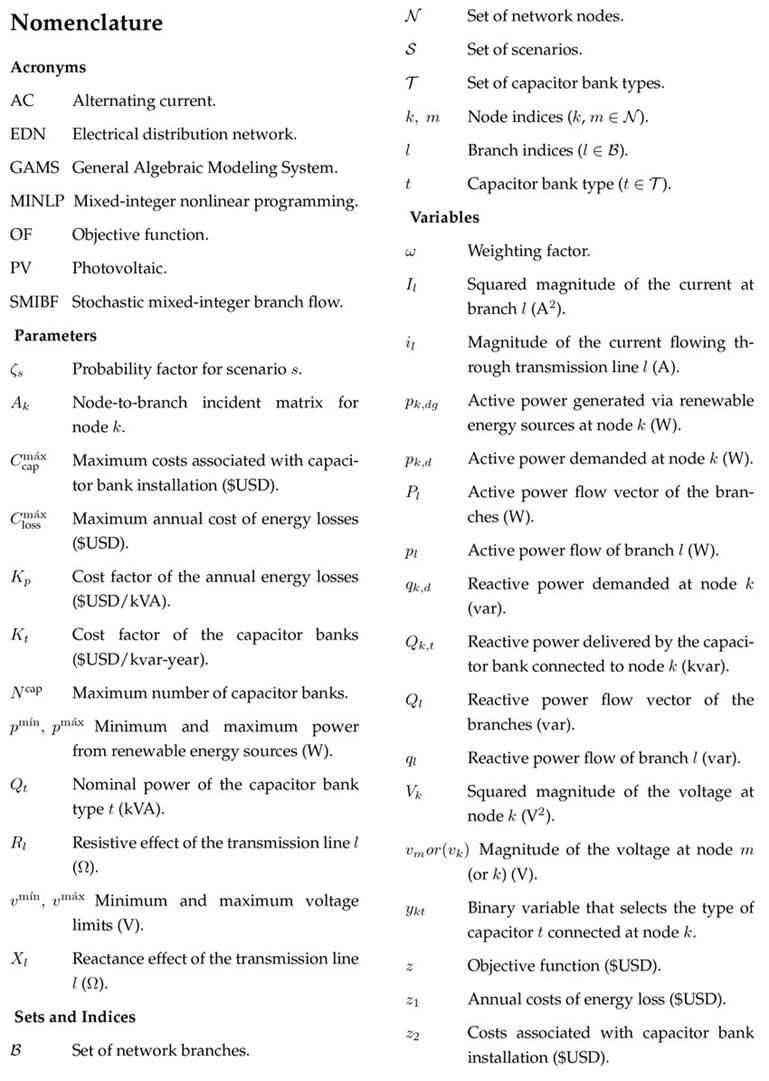
where ω ∈ (0, 1) represents the weighting factor, which assigns weight to each OF based on its value; K
p
is a cost factor that quantifies the power losses, yielding the annual energy losses; R
l
denotes the resistive effect of the transmission line connected to branch l; i
l
is the magnitude of the current flowing through the transmission line connected to branch l; B and N correspond to the sets of the branches (or lines) and nodes in the distribution network, while T represents the set of capacitor bank types; K
t
denotes the cost factor of the capacitor banks per kvar-year; Q
t
is the nominal power of the capacitor bank type t; y
kt
is the binary variable associated with the type or capacity of capacitor bank t and the connected node k;
 represents the cost of z
1 in the distribution grid without capacitor banks; and
 denotes the maximum possible costs related to the installation of these banks.
It is important to note that there are several approaches to solving multi-objective optimization problems, which can be broadly categorized into classical and evolutionary techniques, such as goal programming 25, Pareto-based methods 26, the weighted sum method 24, particle swarm optimization 27, genetic algorithms 27, differential evolution algorithms 27, the non-dominated sorting genetic algorithm II (NSGA-II) 28, the multi-objective evolutionary algorithm based on decomposition 29, and hybrid approaches. Although there are multiple methods to solve multi-objective problems, the weighted sum method was selected because it offers several advantages. These include conceptual simplicity, ease of implementation, flexibility in expressing preferences, the ability to transform the problem into a linear programming one, a unique approach, and the clear interpretation of solutions 30. However, it is also important to mention that this method has limitations and may not be suitable for all multi-objective problems, particularly those with non-convex Pareto fronts or highly non-linear problems.
Optimization model constraints
The set of model constraints for the optimal integration of fixed-step capacitor banks in EDNs is represented by the nodal power balance equations, the voltage drop in each branch, the maximum and minimum power capacity of the generators, the maximum and minimum voltage limits, and the number and size of the capacitor banks to be installed.
The nodal power balance equations are calculated so that the total power injected (or consumed) at each node is equivalent to the sum of the sending and receiving power flows through the branches connected to it. The nodal power balance in each node can be formulated as follows:
where A k in the incident matrix for node k (node-to-branch); P l and Q l are vectors that contain the active and reactive power flows of the branches, respectively; p k,dg is the active power generated via renewable energy sources at node k; p k,d and q k,d are the active and reactive power consumption at node k; Q k,c is the reactive power delivered by the capacitor bank connected to node k; and X l is the reactance associated with branch l.
The voltage drop equation establishes a connection between the voltage and current at both ends of each branch while considering its resistance and reactance. The voltage loss in each branch can be formulated as follows:
where v m (or v k ) represents the magnitude of the voltage at node m (or k), p l denotes the active power flow of branch l, and q l is the reactive power flow of branch l.
The squared magnitude of the apparent power flowing through the branches can be defined as
The limits regarding the maximum and minimum power from renewable energy sources and the maximum and minimum voltage bounds can be defined as follows:
where p m´ın and p m´ax denote the renewable energy sources’ minimum and maximum power; and v m´ın and v m´ax are the minimum and maximum voltage limits, respectively.
Box constraint (8) bounds the minimum and maximum active power available from renewable energy sources, while box constraint (9) is dictaded by regulatory limits for the adequate operation of EDNs. The typical values are between ±5 % and ±10 % 31.
The ideal incorporation of capacitor banks in EDNs can be split into two components. The first involves determining their appropriate placement within the system, while the second determines the right size. These difficulties are addressed by implementing the following constraints:
where
 is the nominal power of capacitor bank type t, and N
cap is the maximum number of capacitor banks to be incorporated into the EDN.
Interpretation of the optimization model
The optimization model for the optimal integration (siting and sizing) of fixed-step capacitor banks in EDNs, which is described in Eqs. (1) to (11), includes continuous variables associated with the magnitudes and angles of the nodal voltages, as well as with the active power generated via renewable energy sources and the reactive power injected by the fixed-step capacitor banks. At the same time, this optimization model incorporates binary variables associated with the location of the fixed-step capacitor banks in the EDN. The objective functions (2) and (3) and the set of constraints from (4) to (11) generate an MINLP model that has the following aspects.
The objective function (1) represents the total annual operating costs of an EDN. It consists of two terms: the first one (z 1) denotes the annual costs of energy losses in the EDN, while the second one (z 2) represents the costs associated with the installation of fixed-step capacitor banks. Constraints (4) and (5) represent the nodal active and reactive power balance, respectively. The left side of these constraints represents the power flowing through the distribution lines that reach the node, taking the corresponding losses into account. The right side denotes the energy generated or demanded at the same node. Constraint (6) corresponds to the voltage drop, which is represented in terms of the magnitude of the current flowing through the distribution lines and their parameters. Constraint (7) represents the squared magnitude of the apparent power flowing through the distribution lines, while inequalities (8) and (9) define the maximum and minimum values for the active power generated by renewable energy sources and the nodal voltages, respectively. Constraint (10) denotes the reactive power injected by a fixed-step capacitor bank, while constraint (11) regulates the maximum number of capacitor banks that can be included in the EDN.
Remark. The MINLP model described from (1) to (11) contains the convex and non-convex constraints, which are represented by (4), (5), (6), and (7). This set of constraints poses significant issues in solving the MINLP model and ensuring its global optimum since, mathematically, it is not possible to demonstrate it. This means that the solution found by some methods is most likely a local optimum. Thereupon, the next section reformulates these constraints in order to transform them into a convex model and thus ensure the global optimum of the model.
Branch flow reformulation
Auxiliary variables are defined which will be used to transform the non-convex MINLP optimization model into a convex one. These auxiliary variables are
Now, substituting these variables into Eqs. (4), (5), (6), and (7) yields the following:
Note that the constraints (14), (15), and (16) are linear expressions, and thus they are convex constraints. Nevertheless, the constraints in (17) continue to be a non-convex due to the product between the auxiliary variables. This product can be rewritten as follows:
The constraint (18) can be expressed using norm-2, as follows:
Note that the constraint (18) is still a non-convex expression, even though it has been transformed into a second-order conic constraint. However, it can be made convex by relaxing the equality to an inequality, as demonstrated in 32. The convex formulation of the second-order conic constraint takes the following form:
The convex model for the optimal integration of fixed-step capacitor banks in EDNs is as follows:
Subject to:
The main benefit of the mixed-integer branch flow model, as outlined from (21) to (31), is its ability to find the global optimum. A combination of the cutting plane algorithm and the interior point method can be used to find the solution to this optimization model. However, it is essential to note that this model does not consider the stochastic nature of demand and renewable energy sources, which will be included in the following subsection.
Stochastic MI branch flow model
An EDN experiences various operating conditions as a result of fluctuating generation from renewable energy sources and changing demand. Hence, it is crucial to establish a minimum number of potential scenarios for the problem under study. In this context, the OF value 21 can be expressed as the sum of each scenario considered, multiplied by the probability of occurrence. This approach is known as the sample average approximation model33 and is defined as follows:
where ζ s is the probability factor of occurrence for scenario s, and S represents the set of scenarios.
Remark. Note that the OF (32) remains linear (an affine function). As a result, it is convex, and its global optimum can be ensured. Nevertheless, it is crucial to limit the amount of scenarios in order to make the optimization model more manageable.
The proposed SMIBF model is formulated below.
Test system under study
The proposed SMIBF model was tested through numerical experiments on three modified, well-known distribution networks, i.e., the 33-, 69-, and 85-node test feeders. For the sake of simplicity, these test systems will be referred to as Test Feeder 1, Test Feeder 2, and Test Feeder 3, respectively. The renewable energy sources considered are photovoltaic (PV) power plants, and three of them are incorporated in each test feeder. The main features of each test feeder are outlined below.
Test Feeder 1
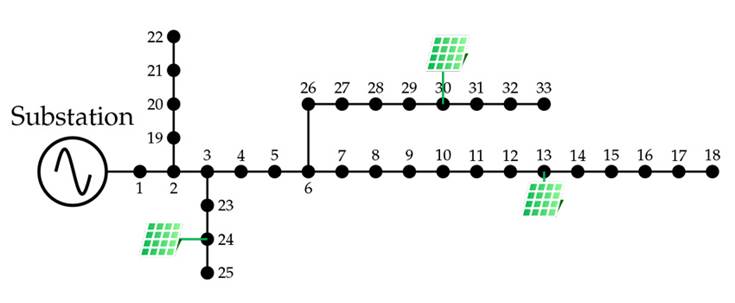
Test Feeder 1 is a radial EDN, with 32 transmission lines and 33 nodes. It operates at 12,66 kV at the slack node (bus 1) and has a peak apparent power demand of 3,715 kW + j2,300 kvar. For this peak demand, the test feeder experiences apparent power losses of approximately 210, 9876 kW + j143, 1283 kvar. The three PV power plants are located at buses 13, 24, and 30, and their rated powers are 801,8, 1.091,3, and 1.053,6 kW, respectively. These locations and sizes were taken from (34). Fig. 1illustrates the topology of Test Feeder 1 with three PV power plants. This grid considers 12,66 kV and 1 MW as its voltage and power bases. The main information about this test feeder can be consulted in (35).
Test Feeder 2
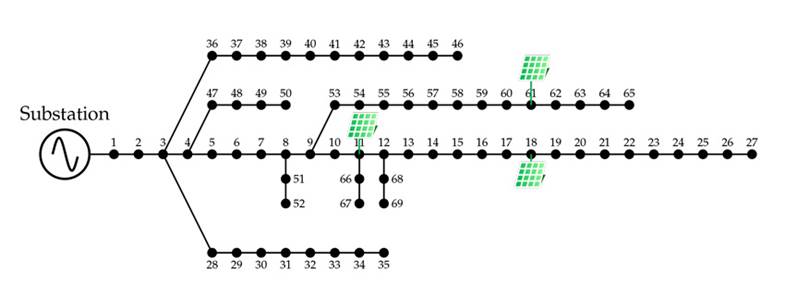
Test Feeder 2 has a radial configuration, 68 transmission lines, and 69 nodes. It operates at a voltage of 12,66 kV at the slack node (bus 1), and its peak apparent power demand is 3,890, 7 kW+j2,693, 6 kvar. The apparent power losses of this peak demand are approximately 224, 9520kW + j102, 3559 kvar. In this test feeder, the locations of the PV power plant are at buses 11, 18, and 61, with nominal powers of 1.631,31, 463,33, and 503,80 kW, respectively. This information has been taken from (34). Fig. 2depicts the topology of Test Feeder 2 and the three PV power plants. The base values used for power and voltage are 1 MW and 12,66 kV. The main information about this test feeder can consulted in 35.
Test Feeder 3
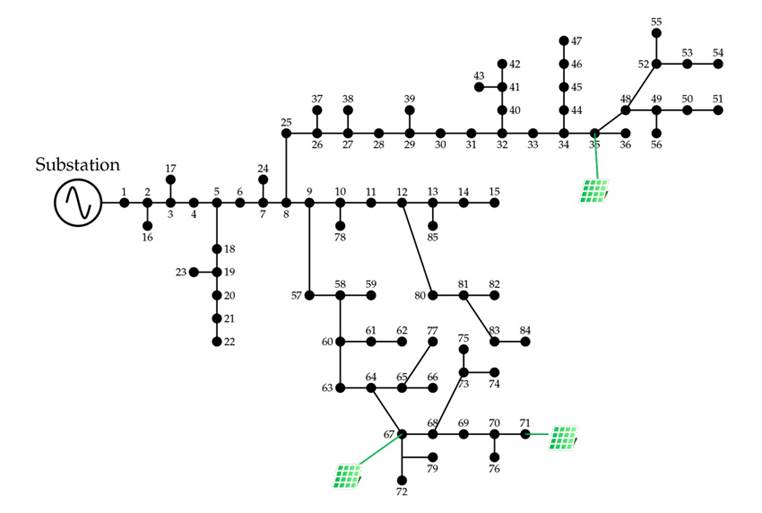
Test Feeder 3 has a radial topology, with 84 transmission lines and 85 nodes. It operates at a rated voltage of 11 kV at the slack node (bus 1) and has a peak apparent power demand of 2,570, 28 kW + j2,622, 20 kvar. The nominal powers of the three PV power plants are 526,8, 380,1, and 1.719 kW, and they are located at nodes 35, 67, and 71, respectively. This information can be consulted in 36. Fig. 3shows the topology of Test Feeder 3. This system considers 11 kV and 1 MW as its voltage and power bases.
Load-generation scenario
The number of scenarios plays a crucial role in analyzing uncertain situations; a reliable and manageable model must have an adequate number of scenarios. This research examines three distinct scenarios related to PV power plant generation and demand conditions. These scenarios incorporate low, medium, and high levels, resulting in nine potential combinations of renewable energy generation and load consumption, each with its own probability. The accuracy of the optimization model could be enhanced by increasing the number of scenarios. However, this would generate a large computational effort with little potential benefit. The probability factor used in this paper for each scenario can be consulted in 37.
The cost coefficient K p used is equal to 168 US$/kW-year, and the capacitor bank data for the optimization model are shown in Table I. This information was taken from 14.
Numerical results and discussions
The SMIBF model was executed in the CVX interface, which allows modeling convex optimization problems in MATLAB 38. The solver used in CVX was Gurobi. Additionally, the non-convex MINLP model was implemented in GAMS and solved by employing the BONMIN, KNITRO, and DICOPT solvers. Three simulation cases were proposed to evaluate the effectiveness of the SMIBF model:
C1 This case assumes that only three capacitor banks can be installed.
C2 This case analyzes the effect on the OF z with varying numbers of capacitor banks on the systems It considers a range of 0-5.
C3 This case generates a Pareto front by varying the weighting factor between 0 and 1. This case only considers the installation of three capacitor banks.
Results obtained for C1
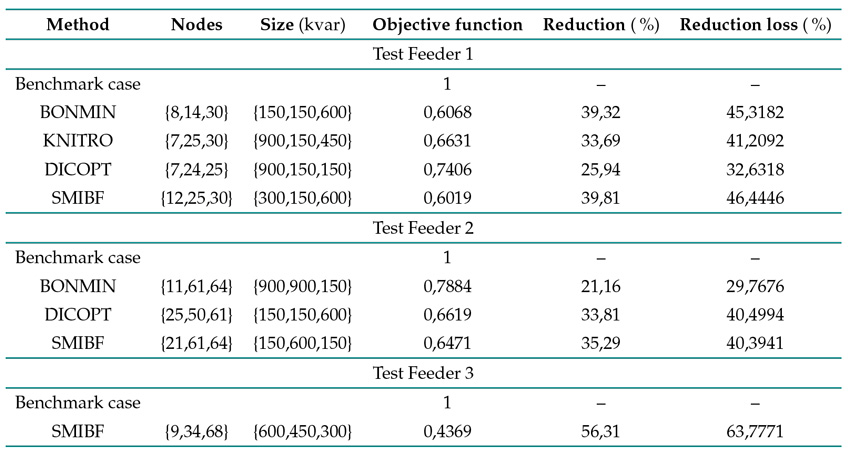
This case evaluates the efficiency of the SMIBF model and compares it against the non-convex model solved in GAMS using three different solvers. Table IIpresents the results obtained regarding the OF value in Eq. (33), its reduction compared to the benchmark case, and the reduction of power losses. The cost factors
 for Test Feeders 1, 2, and 3 are USD 9.010,848, USD 11.422,13, and USD 14.846,52, respectively. Moreover,
 = USD4,698.
According to results shown in Table II, it can be stated that:
The best solution was found by the proposed SMIBF model in the three test feeders. The OF values for these feeders are 0,6019, 0,6521, and 0,44769, which have been recalculated from the non-convex MINLP model. Regarding the benchmark cases, there were reductions of 39,81, 35,29, and 56,31 % in Test Feeders 1, 2, and 3, respectively, when compared to the best solutions. The reductions in energy losses are approximately 46,44, 40,39, and 63,77 %, respectively.
As for Test Feeder 1, it is worth noting that the BONMIN solver achieved a solution close to that of the proposed SMIBF formulation. However, this solution is a local optimum that reduces the OF and energy losses by 39,32 and 45,3182 %, respectively. On the other hand, the KNITRO and DICOPT solvers obtained the worst solutions, reducing the OF value by 33,69 and 25,94 %.
In the case of Test Feeder 2, the KNITRO solver had convergence problems and was unable to find a feasible solution. Meanwhile, the BONMIN solver yielded the worst solution overall; it only minimally reduced the OF value by 21,16$. On the contrary, the DICOPT solver found a solution close to that of the proposed SMIBF formulation, reducing the OF value by 33.81 %. Note that, regarding Test Feeder 3, none of the solvers could converge to any feasible solution, which is why this information is not included in Table II.
These results demonstrate that the non-convex MINLP model for the optimal integration of fixed-step capacitor banks in EDNs is a challenging problem to solve. No solver in GAMS was able to find the best configuration. Additionally, as the test systems increase in size, the solvers encounter convergence problems. This shows that a convex formulation is better for solving this type of optimization model, even if it is relaxed.
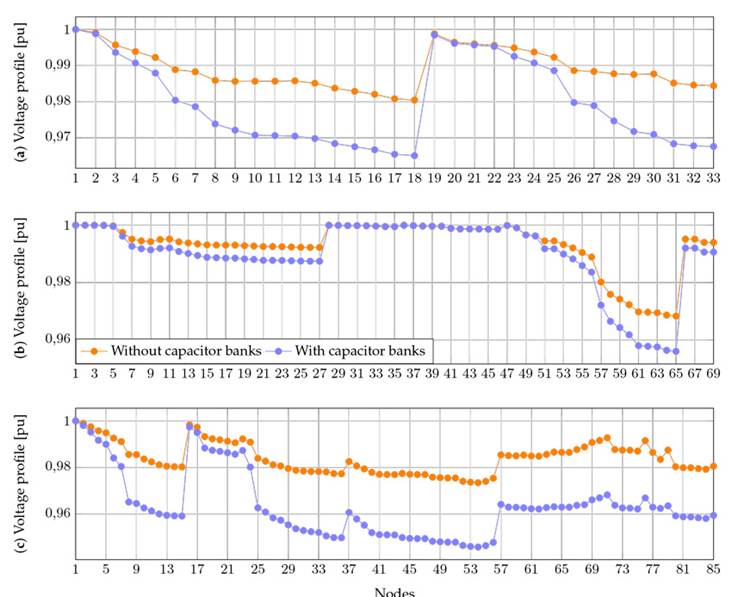
Fig. 4 compares the average voltage profiles of the test systems, considering the presence or absence of capacitor banks. Based on this figure, it can be argued that, when capacitor banks are incorporated into the EDNs, the average voltage profiles are improved, i.e., they remain closer to 1,0 pu. In Figure 4a, the worst average voltage profile, with or without capacitor banks installed, corresponds to node 18. However, it increases from 0,9804 to 0,9650 pu, i.e., an improvement of approximately 1,60 %. For Test Feeder 2, the worst average voltage profiles (Fig. 4b) are 0,968 and 0,9560 pu (both at node 65) with and without capacitor banks installed. The improvement was around 1,28 %. In the case of Test Feeder 3, the improvement was around 2,91 %, going from a voltage level of 0,9464 pu (without capacitor banks) to 0,9740 pu (with capacitor banks) at node 54 (Fig. 4c). Additionally, in Figs. 4b and 4c , it can be noted that all voltages are above the minimum limit (≥ 0, 95 pu) when the capacitor banks are installed, as opposed to not having them in the systems.
Results obtained for C2
This case analyzed how the OF is affected by changing the amount of capacitor banks installed from 0 to 5. Fig. 5 displays the value of the OF in (33) as the amount of capacitor banks increases in the three test feeders.
The results presented in Fig. 5 show that the addition of a third bank of capacitors does not lead to any improvements in the OF value; in fact, it makes it worse. This indicates that there is no significant reduction in system power losses after the third bank of capacitors - note that the installation of the capacitors increases the costs. For Test Feeder 2, the OF value is not significantly improved after installing the first capacitor bank. This improvement is reduced from having just one to three banks by only 0,35 %. A similar situation occurs for Test Feeders 1 and 3: the OF is reduced by 0,30 and 1,64 %, respectively, when going from two to three banks.
Results obtained for C3
This case analyzes the Pareto set by increasing the ω factor by 0,1 from 0 to 1 in the OF z described in (21). Table III presents the OF values for all test feeders, which have been calculated via the SMIBF model.
From the Pareto set results in Table III, it is possible to conclude that:
Both objective functions, z 1 and z 2, are in conflict because, as the value of the first one decreases (improves), that of the second one increases (deteriorates). The extreme solutions occur at the minimum and maximum values of the weighting factor, i.e., when ω = 0 and ω = 1. The maximum weighting factor solution reveals that the annual energy losses costs for Test Feeders 1, 2, and 3 are USD 9.010,848, 11.422,13, and USD 14.846,52, respectively. An analysis of the minimum weighting factor reveals that the investment costs for installing capacitor banks are highest at USD 341,5446, 386,6454, and 416,7126 per year for the modified Test Feeders 1, 2, and 3, respectively. However, in this solution, the annual energy losses costs are the lowest for the three test systems.
The optimal solution of the OF z (i.e., the multi-objective scenario) was found for ω = 0, 5 in each test feeder. This shows that the weighting factor for the single-objective scenario does not substantially impact the final result of the proposed SMIBF model. Nevertheless, the benefit of the Pareto set lies in having a spectrum of solutions that energy companies can use to make better decisions for their electrical systems.
Discussing the influence of integrating energy storage systems and the effect of radial reconfiguration on the model
In modern distribution systems, the integration of energy storage systems (ESS) introduces a dynamic element that could influence the optimal location and sizing of capacitors. The presence of ESS alters the overall energy flow patterns and affects the voltage profile across the grid. When incorporating fixed-step capacitor banks, co-optimization with storage systems becomes crucial. Storage systems can help alleviate the intermittency of renewable energy sources, which affects the requirements for reactive power compensation. The optimal placement of capacitors is intricately linked to the temporal and spatial dynamics of energy storage, as the latter influence load profiles and voltage stability. This dynamic interaction adds a layer of complexity to the model by introducing non-linearities caused by the time-dependent nature of storage systems 39. Consequently, the stochastic mixed-integer branch flow optimization model needs to evolve to capture these complex relationships, considering the dynamic nature of energy flow and voltage support in the presence of storage technologies.
On the other hand, the reconfiguration of electric distribution networks, particularly the transition to new radial configurations, could significantly influence the integration of fixed-step capacitors. Radial reconfiguration aims to enhance system reliability and minimize power losses by modifying the network’s topology. In this context, the integration of fixed-step capacitors is a strategic endeavor. The new radial configurations may result in changes in load distribution and voltage profiles. To optimize the integration of capacitors, their location and size must be recalibrated to align with the new network conditions. Capacitors play a crucial role in compensating for reactive power demand and minimizing losses. Therefore, the strategic deployment of these devices is essential for achieving the objectives of the reconfigured network, such as minimizing losses and enhancing overall reliability. This is particularly important when considering altered power flow paths. Control strategies for capacitor banks may also need to be adapted in order to effectively address the dynamic changes introduced by radial reconfiguration 40.
Conclusions and future Works
This paper proposes an SMIBF model to optimally integrate fixed-step capacitor banks into EDNs. The aim is to reduce the annual costs of energy losses and those of installing this technology. Our proposal is based on a branch flow optimization model that incorporates two sets of auxiliary variables in order to generate a convex model and thus the global optimum. Furthermore, the model incorporates the sample average approximation model to address the stochastic nature of EDNs under multiple operating conditions. This allows for the inclusion of three different conditions into the developed model with regard to demand and renewable generation, namely low, medium, and high levels. The performance of the proposed model was evaluated on three test feeders and compared to the solutions provided by the BONMIN, KNITRO, and DICOPT solvers available in the GAMS software. The simulation results indicate that the developed SMIBF model provides the best solution for all three system, reducing the OF value by 39,81, 35,29, and 56,31 % in Test Feeders 1, 2, and 3 when compared to the benchmark case. At the same time, the annual energy losses were reduced by 46,44, 40,39, and 63,77 %, respectively. No GAMS solver was able to achieve the global optimum of the optimization model. Additionally, the solver exhibited convergence problems as the size of the test feeders increased. This demonstrates that our proposal is a better option for optimally integrating fixed-step capacitor banks, even though it corresponds to a relaxed model.
The impact of increasing the amount of capacitor banks on the OF value was analyzed, finding that, after adding three capacitor banks, the OF value becomes worse. This implies that the energy losses were not significantly reduced after three capacitor banks. On the other hand, the use of the weighting factor allowed implementing a multi-objective approach. When ω = 0, 50, this approach yields the best solution (minimum). This finding confirms that the developed SMIBF model successfully identifies the global optimum in every evaluation.
The following future works could be conducted: (i) considering fixed-step switched capacitor banks in the proposed model, (ii) simultaneously integrating fixed-step capacitor banks and D-FACTS devices, and (iii) extending the developed SMIBF model to large-scale transmission systems with new objective functions


