


 Inglés (pdf)
 Articulo en XML
 Referencias del artículo
 Enviar articulo por email
 Citado por SciELO
  Citado por Google
  Similares en
SciELO
Similares en
SciELO  Similares en Google
 Permalink
1. INTRODUCTION
The demand for oil and gas resources is rising, and the world's major oil companies are accelerating the production of energy. The potential of the drilling market is also expanding, and the global rig usage, drilling quantity, and other indicators continue to rise (Wang J. & Wang W., 2011); (Jiarong & Lingjie, 2014). To reduce drilling costs and ancillary costs (transportation and shutdown costs, etc.), the modular rig, as a new rig technology, plays an important role in oil exploration because of its efficient transport, economy, advanced technology, and reliability (Cao L. et al.,2017; Sun Y et al.,2018; Huang Z. et al., 2018).
The derrick is an important piece of the modular rig. It belongs to the large steel frame structure, with numerous rods and complicated forces. It provides support and protection for the entire rig system during the drilling process. Once the structure is damaged, the consequences are unimaginable (Yuanqing., W. 2000; Zu., W., 2017).
Many essential components in the derrick are welded, and the welds at critical locations vary with the conditions of use. Because of the complicated force of the weld at the critical position, in the design and calculation of the weld, not only the operability of the weld at the critical position should be considered, but also the fatigue characteristic of the key weld under different stress conditions (Wang J P & Bao Z F,2012;Hu J et al,2013; (Dongying et al., 2011; Chen et al.,2013). Currently, the structural design of amodular rig and the development of supporting control systems and transport devices have achieved certain results (Hua et al.,2016; Ren Deyong et al.,2017). However, there is very little research on the weld of the modular rig derrick. This paper is focused on the modular rig as the research core to analyze the fatigue characteristics of the key weld of the derrick to obtain the necessary scientific basis for the design, manufacture, and safe use of the modular rig.
2. THEORICAL FRAMEWORK
Ther allowable stress amplitude method is a fatigue calculation method developed along with a welded steel structure. Through numerous experimental research and engineering practice, it has been proved that welding defects are often the source of fatigue cracks and fatigue damage. Most of the derricks are welded structures, and their fatigue strength is calculated by means of the equation 1,

Where ΔσΔσ is calculated stress amplitude, c, and M are coefficients, N is the number of stress cycles.
The load on the derrick and the base are unstable, and the fatigue is variable. Therefore, according to the principle of accumulated damage fatigue, it is necessary to convert the variable amplitude fatigue into equivalent normal amplitude fatigue. Equation 1 further evolves into equation 2,

Where Δσ c is equivalent stress amplitude, it is defined by equation 3,

Where k c is the equivalent stress amplitude coefficient, σ max is the maximum tensile stress in each stress cycle of weld stress; σ max -weld stress maximum tensile stress in each stress cycle; The load in this working condition is: maximum drill string weight, second floor platform weight, crane weight, second floor derrick and accessories weight, derrick to bear wind load. σ min is the minimum tensile stress or compressive stress in each stress cycle of the weld stress. σ min -weld stress minimum tensile or compressive stress in each stress cycle; (Tensile stress is positive, compressive stress is negative); the load in this working condition is: full vertical root, no hook load, weight of the second floor, weight of the derrick and accessories, and wind load of the derrick.
Although the fatigue strength is calculated by the allowable stress amplitude method, including the effect of the local yield zone due to local stress concentration, the design of the entire component is still made according to the elastic criteria. Since the probability density of the load is continuously changed due to the drilling operation, the equivalent stress amplitude coefficient can be expressed as equation 4.

Where f is the impact coefficient of the drill, C is the number of stress cycles of the derrick when the drill string is raised by 1 m, φ is the probability density function of the drilling load, N 0 is the stress cycle base, S is the total number of meters of the rig lifting the drill string during the life of the derrick weld, α is relative drill string weight, for derrick fatigue calculation, α max =1.
From the perspective of fatigue calculation, the duration of the drill-down operation is the longest, and the resulting number of stress cycles is the highest. The down-drilling load spectrum is related to the type of drilling rig, well depth, geological conditions, etc., and its load changes from small to maximum, and the frequency of repeated action of the load is equivalent to the ratio of the number of times of drilling down and the depth of the well. Considering the influence of some accidental loads, the probability density function of the tripping load can be expressed by equation 5.

And Combine equation 6

Deriving the formula for calculating the fatigue life of the derrick weld:

Where T is the derrick weld fatigue life, L is the depth of drilling, Z is the average number of drills per well, X is the number of wells in a year.
3. EXPERIMENTAL DEVELOPMENT
From the above theoretical derivation, it can be observed that some parameters are related to the structural properties of the derrick, which can be obtained by consulting the relevant manual. However, some parameters are closely related to the load on the derrick, and it must be calculated based on the analysis of the load condition, such as σ max and σ min . The loads on the derrick mainly include three types: wind load, working load, and dead load.
1.WIND LOAD
Wind load is a random load that changes not only with time but also with spatial position. Depending on the derrick structure, this paper divides the wind load into the wind load on the derrick, and the standpipe.
(1) Wind load on the derrick
The wind load calculation is based on the specifications of API Spec 4F ("API Specification 4F",2013) version 4, and the wind load calculation formula is

Where F m is the wind perpendicular to the longitudinal axis of the individual component, or the surface of the windshield, or the projected area of the attachment, K i is the coefficient of the inclination angle between the longitudinal axis of the individual members and the wind, V H is the local wind speed at height, C s is shape coefficient, A is the projected area of a single component, β is height coefficient; V des is the maximum rated design wind speed.
(2)Wind load on the standpipe
The schematic diagram of the discharge of standpipe in monkey-board is shown in Fig. 1. Where +X, +Y, -X, -Y represent different wind directions, i and j represent the number of row and column, respectively
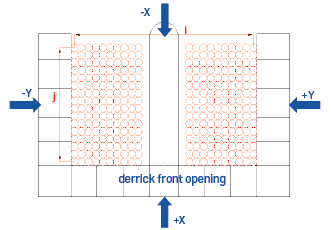
Figure 1 Schematic diagram of the discharge of standpipe in monkey-board and the direction of the wind

Wherem is the number of towers on the monkey-board, as the wind comes from the +X or -X direction, m=i, as the wind comes from the +Y or -Y direction, m=j. d is the outer diameter of the root joint.
2.Working load
The working load is the load generated during the work of the derrick, including the maximum hook load, rated hook load, additional work and handling accident hook load, the force of working line, standpipe load, and so on. The working load to be considered in the derrick static calculation mainly includes the maximum hook load, the rated hook load, the force of the working line, and the standpipe load.
(1)Maximum hook load
The maximum hook load is the maximum lifting weight of the hook when the dead rope is fixed at the designated position, the number of drilled ropes is specified, and there is no wind load, and the second floor does not store either the stand or the sucker rod. It does not include the weight of the crown block, traveling block, and the hook. (2)Rated hook load.
The rated hook load is also called the maximum drill string weight. When drilling to the maximum well depth, the rated load is the weight of all drill strings suspended from the hook. Generally, it can be derived from

Where Q R is the rated hook load, q is the average weight per meter of the drill string, L, the weight per unit length.
(3)Force of the working line
The force of the working line is the resultant force of the hook load on the fast rope and the dead rope under a given traveling system. The action point acts on the crown block, and the general direction of the force does not follow the direction of the center of the crown block. The horizontal component is generally small and negligible, and its vertical component can be approximated as:

Where P l is the force of the working line, Q max is the maximum design hook load of derrick, G s is the weight of the traveling system, Z is the effective number of working line in the traveling system.
(4)Standpipe load
The standing load is composed of the horizontal and vertical component forces caused by the vertical weight of the stand on the drill floor during the drilling process. The horizontal component force acts on the fingerboard of monkey-board, pointing to the two sides of the monkey-board, and the vertical component force acts directly on the rig base in the vertical direction.
The horizontal force of the standpipe can be calculated by the following formula:

Where P L is the horizontal force of standpipe on the derrick, θ is the angle between standpipe and the plane of monkey-board, n is the amount of standpipe; / is the length of the standpipe.
3.Dead load
The dead load to be considered in the calculation of the derrick mainly includes the weight of the derrick, the weight of monkey-board, the weight of the crown block, and the weight of the traveling system.
4. RESULTS
Using the module rig ZJ90D as an example, given the structural complexity of the derrick, traditional theoretical calculations are difficult to obtain the key parameters σ max and σ min so the numerical simulation is preferred. To improve the success rate of meshing and reduce the computational workload, the shape and size of the derrick are simplified according to the specific characteristics (Ren, H. & He., J. 2017), and the simplified derrick model and key weld position are shown in Fig. 2. The derrick is made of 16Mn material. The yield strength of the well frame and the weld is 345MPa and 532.1Mpa (Matti R. at el,2022), respectively, and the elastic modulus of both are 210 GPa, and the Poisson's ratio is 0.3. A Strain Gauge is a sensor used to measure the strain of an object. It is based on the fact that the resistance of conductive or semiconductor materials changes with the degree of strain. The strain gauge is usually implemented by pasting or mounting a conductive or semiconductor material on the surface of the object to be measured. Measuring changes in the strain gauge is usually done via an external circuit. The strain gauge is connected to the bridge circuit, which consists of an excitation power supply, a resistance meter, and a measuring device. During the experimental test, clean the weld surface to ensure that it is free of dust, grease, or other impurities, paste the strain gauge on the weld of the derrick, connect the wire to the bridge, the strain collector (ASMB2-16) and the computer, add the external load in the predetermined way, analyze the data, calculate the strain value, and calculate the corresponding stress value according to the mechanical properties of the material. The experimental test device is shown in Fig. 3.


When analyzing the key welds of the derrick and determining the calculated load, it is necessary to fully understand the structural characteristics and technical parameters of the derrick. The main technical parameters of the derrick are shown in table 1. The main parameters are as follows: c =4.06x10¹¹, N =5x10⁶, M =3, C =1/28, N_00=5x10⁶, L =9000m,ll=28m, q =36kg/m, θ =87°, d =0.127m.
Table 1 Main technical parameters of derrick
| Item | Parameter |
|---|---|
| IMaximum hook load (7x8 wheel train, no wind load, no standpipe) | 7000kN |
| Effective height of the derrick | 48.8m |
| Height of the monkey-board | 26.5m |
| Standpipe capacity of the monkey-board (φ127mm drill pipe, 28m standpipe) Wind resistance: | 9000m |
| a. Waiting for the weather (no hook, second-floor storages full of standpipe) | 36m/s |
| b. Equipment preservation (no hook load, second floor has no standpipe) | 47.8m/s |
| c. derrick lifting | ≤7.8m/s |
The calculation results of wind load on the derrick at different wind speeds are shown in table 2. In particular, the -X, -Y wind and the +X, +Y wind load are in the same amount of force, but in opposite direction, respectively.
Table 2 Wind load size of the derrick at different wind speeds (kN)
| Wind speed | 16.5m/s | 36m/s | 47.8m/s | ||||||
|---|---|---|---|---|---|---|---|---|---|
| Position | +X | +Y | +X,+Y | +X | +Y | +X,+Y | +X | +Y | +X,+Y |
| top section | 5.72 | 5.92 | 8.24 | 27.25 | 28.21 | 39.22 | 48.06 | 49.74 | 69.16 |
| upper middle section | 10.55 | 7.44 | 12.73 | 50.25 | 34.45 | 60.60 | 88.61 | 62.50 | 106.85 |
| lower middle sections | 8.71 | 6.21 | 10.55 | 41.50 | 29.57 | 50.26 | 73.17 | 52.15 | 88.61 |
| bottom section | 5.03 | 4.66 | 6.86 | 23.97 | 22.22 | 32.66 | 42.27 | 39.18 | 57.59 |
| standpipe | 26.02 | 20.87 | 33.15 | 123.86 | 99.3 | 157.85 | 218.38 | 175.18 | 278.29 |
The numerical analysis of the key welds of the derrick includes the following four conditions:
Condition 1: Maximum hook load (7000 KN) + rig structure and attachment weight + standpipe load (4500 KN) + wind load at speed of 16.5m/s + top drive torque.
Condition 2: Maximum turntable load (7000 KN) + rig structure and attachment weight + standpipe load (4500 KN) + wind load at speed of 16.5m/s.
Condition 3: Standpipe load (4500 KN) + maximum turntable load (7000 KN) + rig structure and attachment weight + wind load at speed of 36m/s.
Condition 4: Rig structure and attachment weight + maximum turntable load (7000 KN) + wind load at a speed of 47.8m/s. In the analysis process, considering the different loads of the derrick during the drilling operation, the drilling process is divided into two working states. State 1: Rig structure and attachment weight + wind load + (top drive torque) + standpipe load. State 2: Rig structure and attachment weight + wind load + (top drive torque) + drill string weight.
Through the analysis of finite element software, when the wind is coming from +X direction, the stress of the welds in each section of the derrick is the most dangerous. The stress analysis results at position 17 of the lower section of the derrick are shown in Fig. 4.

The stress analysis results of the welds in each section of the derrick are compared and analyzed in four conditions, as shown in Fig. 5, From the results, the stress results are less than the allowable stress of the weld material, within the safe range, meeting the safety requirements. The difference between condition 1 and condition 2 is whether there is a top drive torque. However, it can be noted from the calculation results that the top drive torque has little effect on weld stress. Based on the load combination of condition 2, the wind load of condition 3 continues to increase, and the weld stress of derrick also increases. Condition 4 differs from conditions 1, 2, and 3. There is no standpipe load in the load combination of condition 4, the wind load continues to increase, and the weld stress gradually increases from the top section to the bottom section of the derrick. Analysis of stress results of welds at different positions of the derrick, the weld stress in the middle section of the derrick is relatively close, and the weld stress in the upper and the lower sections of the derrick fluctuates. Moreover, the weld stress in the lower section of the derrick changes substantially, and the greater the stress fluctuation, the more dangerous the rig fatigue failure.

To verify the accuracy of the simulation analysis, the stress value of position 17~20 in condition 1, condition 2 and condition 3 was tested, and the simulated analysis value was compared with the test value, as shown in Fig. 6. The simulation analysis results show the same trend as the test results, and are within error tolerance. Among them, S1, S2, and S3 represent the simulated analysis values in conditions 1, 2, and 3, respectively. T1, T2, and T3 represent the test values in conditions 1, 2, and 3, respectively. As can be observed in Fig. 6, the numerical simulation results are close to the actual test results, so the analysis method is reliable. The numerical simulation results are slightly different from the actual test results, which is due to the accuracy of the test method and instrument, testing environment, and other factors.

5. RESULTS ANALYSIS
1.Theoretical calculation results
(1)Operating condition 1
The results obtained by theoretical calculation under working condition 1 are shown in Table 3. According to the fatigue calculation results, the fatigue life of most welds is 30~120 years, and the lowest fatigue life is 22 years. The weld life of the upper section of the derrick is roughly between 35 and 120 years.
Table 3 Fatigue life of key weld of derrick under working condition 1 (years)
| Weld position | +X | +X,+Y | +Y | -X,+Y | -X | -X,-Y | -Y | +X,-Y |
|---|---|---|---|---|---|---|---|---|
| T | T | T | T | T | T | T | T | |
| 1 | 30 | 31 | 31 | 32 | 31 | 30 | 30 | 31 |
| 2 | 30 | 30 | 29 | 29 | 31 | 32 | 33 | 32 |
| 3 | 23 | 24 | 22 | 24 | 26 | 25 | 23 | 22 |
| 4 | 39 | 38 | 37 | 41 | 39 | 37 | 38 | 37 |
| 5 | 44 | 44 | 43 | 42 | 41 | 42 | 42 | 41 |
| 6 | 46 | 46 | 47 | 45 | 46 | 45 | 44 | 45 |
| 7 | 49 | 50 | 49 | 52 | 48 | 51 | 50 | 51 |
| 8 | 40 | 42 | 41 | 44 | 42 | 42 | 40 | 43 |
| 9 | 25 | 26 | 25 | 25 | 24 | 23 | 24 | 25 |
| 10 | 51 | 53 | 54 | 54 | 53 | 52 | 55 | 52 |
| 11 | 40 | 43 | 42 | 44 | 40 | 41 | 43 | 42 |
| 12 | 23 | 24 | 24 | 23 | 22 | 24 | 23 | 23 |
| 13 | 34 | 35 | 24 | 24 | 25 | 25 | 28 | 35 |
| 14 | 54 | 56 | 42 | 43 | 27 | 32 | 35 | 53 |
| 15 | 51 | 53 | 39 | 40 | 25 | 31 | 35 | 52 |
| 16 | 77 | 91 | 89 | 91 | 77 | 80 | 78 | 80 |
| 17 | 25 | 26 | 23 | 27 | 24 | 24 | 24 | 25 |
| 18 | 102 | 108 | 97 | 94 | 92 | 93 | 95 | 100 |
| 19 | 100 | 105 | 93 | 95 | 94 | 97 | 96 | 105 |
| 20 | 60 | 64 | 49 | 52 | 48 | 54 | 53 | 62 |
| 21 | 72 | 103 | 103 | 99 | 101 | 102 | 103 | 70 |
| 22 | 95 | 108 | 98 | 96 | 93 | 106 | 97 | 96 |
(2)Operating condition 2
The results under working condition 2 are shown in Table 4. According to the fatigue calculation results, the fatigue life of most welds is 24~120 years, and the lowest fatigue life is 22 years.
Table 4 Fatigue life of key weld of derrick under working condition 2 (years)
| weld position | +X | +X,+Y | +Y | -X,+Y | -X | -X,-Y | -Y | +X,-Y |
|---|---|---|---|---|---|---|---|---|
| T | T | T | T | T | T | T | T | |
| 1 | 31 | 31 | 31 | 32 | 31 | 30 | 30 | 31 |
| 2 | 30 | 30 | 29 | 29 | 31 | 32 | 33 | 32 |
| 3 | 24 | 24 | 22 | 24 | 26 | 25 | 22 | 22 |
| 4 | 39 | 37 | 37 | 41 | 39 | 37 | 38 | 37 |
| 5 | 44 | 44 | 43 | 42 | 41 | 42 | 42 | 41 |
| 6 | 46 | 46 | 47 | 45 | 43 | 45 | 44 | 46 |
| 7 | 49 | 50 | 49 | 52 | 48 | 51 | 50 | 51 |
| 8 | 40 | 42 | 41 | 44 | 42 | 42 | 41 | 43 |
| 9 | 26 | 26 | 25 | 25 | 24 | 23 | 24 | 25 |
| 10 | 51 | 53 | 54 | 54 | 53 | 52 | 55 | 52 |
| 11 | 41 | 43 | 41 | 44 | 40 | 41 | 43 | 42 |
| 12 | 23 | 24 | 24 | 23 | 22 | 24 | 23 | 23 |
| 13 | 34 | 35 | 24 | 24 | 25 | 25 | 28 | 35 |
| 14 | 54 | 56 | 42 | 40 | 26 | 32 | 34 | 53 |
| 15 | 51 | 53 | 39 | 40 | 25 | 31 | 35 | 52 |
| 16 | 77 | 91 | 89 | 91 | 77 | 80 | 78 | 80 |
| 17 | 25 | 26 | 22 | 26 | 24 | 24 | 24 | 24 |
| 18 | 102 | 108 | 97 | 94 | 92 | 93 | 95 | 100 |
| 19 | 101 | 104 | 94 | 95 | 94 | 96 | 96 | 105 |
| 20 | 60 | 64 | 48 | 52 | 48 | 54 | 53 | 62 |
| 21 | 72 | 103 | 103 | 99 | 101 | 102 | 103 | 70 |
| 22 | 94 | 108 | 98 | 96 | 93 | 106 | 96 | 97 |
(3)Operating condition 3
Working condition 3 is based on the combined load of working condition 2, and the wind load increases, so its change shows the same trend. The results are shown in Table 5. With the distribution law of working condition 2, according to the fatigue calculation results, the fatigue life of most welds is 30~120 years, and the lowest fatigue life is 21 years.
Table 5 Fatigue life of key weld of derrick under working condition 3 (years)
| weld position | +X | +X,+Y | +Y | -X,+Y | -X | -X,-Y | -Y | +X,-Y |
|---|---|---|---|---|---|---|---|---|
| T | T | T | T | T | T | T | T | |
| 1 | 25 | 26 | 24 | 25 | 23 | 27 | 26 | 25 |
| 2 | 26 | 27 | 25 | 25 | 24 | 27 | 26 | 24 |
| 3 | 21 | 17 | 18 | 21 | 20 | 19 | 18 | 20 |
| 4 | 33 | 35 | 34 | 39 | 33 | 34 | 28 | 36 |
| 5 | 32 | 33 | 34 | 43 | 33 | 32 | 32 | 36 |
| 6 | 36 | 35 | 33 | 44 | 35 | 34 | 42 | 41 |
| 7 | 34 | 33 | 32 | 44 | 44 | 30 | 38 | 32 |
| 8 | 32 | 31 | 27 | 39 | 41 | 25 | 32 | 23 |
| 9 | 27 | 26 | 26 | 24 | 26 | 27 | 25 | 28 |
| 10 | 34 | 35 | 34 | 35 | 40 | 33 | 37 | 38 |
| 11 | 33 | 39 | 35 | 45 | 31 | 34 | 32 | 30 |
| 12 | 27 | 26 | 26 | 28 | 28 | 29 | 27 | 31 |
| 13 | 34 | 36 | 25 | 28 | 28 | 23 | 29 | 37 |
| 14 | 60 | 62 | 35 | 33 | 32 | 31 | 56 | 58 |
| 15 | 54 | 56 | 46 | 41 | 45 | 28 | 32 | 54 |
| 16 | 32 | 34 | 27 | 23 | 22 | 35 | 25 | 32 |
| 17 | 28 | 24 | 27 | 23 | 22 | 25 | 25 | 33 |
| 18 | 76 | 75 | 67 | 74 | 78 | 84 | 86 | 94 |
| 19 | 85 | 87 | 63 | 80 | 82 | 81 | 93 | 95 |
| 20 | 47 | 50 | 36 | 34 | 29 | 31 | 33 | 53 |
| 21 | 67 | 82 | 77 | 74 | 35 | 39 | 63 | 80 |
| 22 | 95 | 84 | 81 | 79 | 38 | 35 | 56 | 61 |
(4)Operating condition 4
The calculation results of working condition 4 are shown in Table 6. According to the fatigue calculation results, the fatigue life of most welds is 30~150 years, and the lowest fatigue life is 31 years.
Table 6 Fatigue life of key weld of derrick under working condition4 (years)
| Weld position | +X | +X,+Y | +Y | -X,+Y | -X | -X,-Y | -Y | +X,-Y |
|---|---|---|---|---|---|---|---|---|
| T | T | T | T | T | T | T | T | |
| 1 | 39 | 36 | 33 | 36 | 33 | 34 | 35 | 41 |
| 2 | 38 | 36 | 32 | 34 | 32 | 31 | 33 | 40 |
| 3 | 39 | 36 | 33 | 36 | 33 | 34 | 35 | 41 |
| 4 | 40 | 37 | 35 | 38 | 35 | 37 | 38 | 45 |
| 5 | 40 | 42 | 44 | 40 | 45 | 47 | 50 | 53 |
| 6 | 40 | 41 | 40 | 43 | 42 | 42 | 43 | 45 |
| 7 | 43 | 42 | 45 | 52 | 40 | 49 | 46 | 45 |
| 8 | 40 | 42 | 45 | 52 | 38 | 49 | 46 | 46 |
| 9 | 40 | 41 | 43 | 51 | 36 | 48 | 45 | 43 |
| 10 | 36 | 40 | 41 | 134 | 43 | 100 | 90 | 78 |
| 11 | 36 | 80 | 97 | 203 | 48 | 89 | 54 | 68 |
| 12 | 40 | 71 | 51 | 41 | 30 | 48 | 43 | 65 |
| 13 | 97 | 56 | 64 | 46 | 37 | 81 | 79 | 126 |
| 14 | 144 | 146 | 76 | 121 | 50 | 178 | 151 | 234 |
| 15 | 148 | 197 | 97 | 155 | 40 | 121 | 87 | 159 |
| 16 | 88 | 165 | 94 | 89 | 38 | 64 | 58 | 125 |
| 17 | 102 | 146 | 85 | 90 | 37 | 58 | 61 | 145 |
| 18 | 238 | 328 | 103 | 109 | 52 | 84 | 185 | 204 |
| 19 | 206 | 312 | 144 | 110 | 85 | 89 | 126 | 132 |
| 20 | 102 | 301 | 78 | 60 | 40 | 63 | 80 | 115 |
| 21 | 117 | 164 | 120 | 92 | 53 | 114 | 200 | 226 |
| 22 | 124 | 116 | 194 | 173 | 60 | 103 | 160 | 217 |
2.Weld fatigue simulation calculation
According to the weld fatigue calculation formula and stress results, the fatigue life of the key weld of the derrick under various conditions is obtained, as shown in Fig. 7.

According to the fatigue calculation results, the fatigue life of the upper and middle welds of the derrick is shorter. Furthermore, the fatigue life of the welds in the lower section of the derrick is quite different; in particular, the fatigue life of weld position 18 and 19 is longer than in other positions, having to do with the magnitude of the stress int that position. Under condition 1, the minimum fatigue life of key welds is 22 years, and the weld life of other positions in the derrick is roughly between 27 and 120 years. Under condition 2, the minimum fatigue life of key welds is 22 years, and the weld life of other positions at the derrick is about 28~120 years. Condition 3 is based on the combined load of condition 2; the wind load increases, so the change shows the same trend. The minimum fatigue life of the key weld is 21 years, and the weld life of other positions of the derrick is about 23~120 years. Under condition 4, the minimum fatigue life of key welds is 21 years, and the weld life of other positions in the derrick is roughly between 22 and 300 years.
■ CONCLUSIONS
With the modular drilling rig being the object of study, the calculation formula for the fatigue life of the well welded seam was proposed. Then, with the ZJ90D modular rig drill as the analysis case, in combination with the working condition and structure characteristics of well shelf, using limited element software for the analysis, the key calculation parameters were obtained.
Based on the analysis, the stress results are lower than the permissible stress of the welding material in the four working conditions, meeting the safety requirements within the safety scope. Through the fatigue life analysis of the key welds of the well shelf, the fatigue life of the upper and middle welds is shorter, and the fatigue life of the lower weld varies greatly. Combined with the limited fatigue analysis and fatigue lifespan calculation, the maximum position of the accumulated fatigue damage of the soldering weld is determined, laying a good foundation for the optimized design of the future modular drill shelf.


