


 texto en
  Inglés (pdf)
 Articulo en XML
 Referencias del artículo
 Enviar articulo por email
 Citado por SciELO
  Citado por Google
  Similares en
SciELO
Similares en
SciELO  Similares en Google
 Permalink
Introduction
Huanglongbing (HLB) is one of the most destructive diseases currently affecting citrus in the world, forcing producers to cut down millions of trees (Da Graça et al., 2016). The American continent was free of HLB until it was detected in Brazil in March 2004 and the state of Florida (USA) in August 2005 (Bové, 2006). The disease is associated with three species of ɑ-proteobacteria: Candidatus Liberibacter asiaticus (Ca. L. asiaticus), Candidatus Liberibacter africanus (Ca. L. africanus), and Candidatus Liberibacter americanus (Ca. L. americanus) (Jagoueix et al., 1994; Do Carmo Teixeira et al., 2005). These bacteria are obligate endopathogens which presence is restricted to phloem tissues in infected plants (Da Graça et al., 2015; Da Graça, 2008; Do Carmo Teixeira et al., 2005). In the American continent, the predominant species is Ca. L. asiaticus, although in Brazil, Ca. L. americanus is also found (Santivañez et al., 2013). Diaphorina citri Kuwayama (Hemiptera: Liviidae), the Asian citrus psyllid and main vector of HLB, transmits both bacteria and itʼs found on at least 25 genera of the Rutaceae family, including all commercial citrus varieties (Bové, 2006; Pérez-Artiles et al., 2017). The disease severely affects sweet orange Citrus sinensis (L.) Osbeck, mandarin orange Citrus reticulata Blanco, and lemon Citrus x limon (L.) Osbeck. To a lesser degree, it harms lime Citrus aurantifolia Swingle and grapefruit Citrus x paradisi Macfad., as well as various wild hosts such as Murraya paniculata (L.) Jack, and Swinglea glutinosa (Blanco) Merr., which are important due to their presence in urban areas as ornamental plants (Center for Agricultural Bioscience International [CABI], 2020; Secretaría de Agricultura y Desarrollo Rural & Servicio Nacional de Sanidad, Inocuidad y Calidad Agroalimentaria, 2019).
The first record of D. citri in South America was in São Paulo (Brazil) in 1942; it was subsequently reported in other countries in the region: Argentina (Entre Ríos) in 1984, Uruguay in 1991, the United States (Florida) in 1998, Cuba in 1999, Mexico (Campeche) in 2002, Bolivia in 2004, and Paraguay in 2008 (CABI, 2020; European and Mediterranean Plant Protection Organization [EPPO], 2020a; Hall et al., 2013). In Colombia, the presence of D. citri was first reported in 2007 in the departments of Tolima and Valle del Cauca (Ebratt et al., 2011; King, 2012; Kondo et al., 2012). Later, it was detected in the departments of Antioquia, Atlántico, Caldas, Casanare, Cesar, Córdoba, Cundinamarca, Bolívar, Cauca, Huila, Meta, Nariño, Norte de Santander, Quindío, Risaralda, Santander, and Vichada (Ángel et al., 2014). Currently, it is found in 25 departments of the country (Resolution 1668, 2019).
As for the HLB disease, after detections in Brazil and the state of Florida (USA), over time, its presence was recorded in several countries: Cuba in 2006, Dominican Republic (Santo Domingo) and USA (state of Louisiana) in 2008, and Mexico (states of Jalisco, Nayarit, and Yucatan) and Belize in 2009 (EPPO, 2020b; CABI/EPPO, 2017). In Colombia, it was detected for the first time in citrus plants in the department of La Guajira in November 2015 (Resolution 2390, 2015). Currently, 333 positive cases for HLB have been reported in 27 municipalities in the departments of Atlántico, Magdalena, Cesar, Bolívar, La Guajira and Norte de Santander (Instituto Colombiano Agropecuario [ICA], 2018).
The spread of the disease throughout the American continent does not have a precise scientific explanation, perhaps due to the lack of data, the symptomatic complexity of the disease, or the difficulty in finding accurate and early reports. Cases in Brazil, possibly from Asia or Africa, have a high probability of being a consequence of the dispersion of contaminated plant material by man (Do Carmo Teixeira et al., 2005). In Florida (USA), the most probable cause was the transport of infected material from Asia, Africa, or Brazil (Hall et al., 2013). In Cuba, HLB may have originated from Florida by the dispersal of the infectious D. citri or by the mobilization of plant material (Beattie et al., 2008; Da Graça, 2008). The spread of the infectious D. citri could be activated between the Caribbean and Central American countries due to the large number of hurricanes that struck the area during these years or due to the mobilization of infected material caused by international tourism (Galindo, 2014). In the case of Colombia, the entry routes of HLB have not yet been defined.
In 2007, Colombia did not have any official report of the entry of HLB, although, since that year, D. citri was present in the propagation material of Tahiti lime and also in a swinglea hedge in the department of Tolima (King, 2012). In 2010, monitoring and tracking activities were carried out in 32 municipalities in 17 departments; the departments of Atlántico, Cauca, Cesar, Meta, and Santander showed no trace of D. citri (ICA, 2010). In 2014, monitoring activities in 434 municipalities in 26 departments, mainly in citrus-producing areas in Colombia, were intensified. As a result of the inspections, it was determined that D. citri was present in all areas planted with citrus; however, in none of them, the presence of the disease was detected (ICA, 2014). In 2015, the phytosanitary diagnostic laboratory of Instituto Colombiano Agropecuario (ICA) confirmed the first two cases of HLB in the municipalities of Distracción and Fonseca, department of La Guajira (Resolution 2390, 2015).
Based on the above, the dispersal of infective psyllids and the movement of plant material with HLB represent a severe risk to citrus production in Colombia. Although the disease is not widespread, experiences in other Latin American countries indicate that extensive and dynamic surveillance should be carried out (Santivañez et al., 2013) to prevent the spread of HLB, including actions for the efficient control of D. citri, among other measures. In this sense, the aim of this work is to show a methodological proposal to analyze the potential risk of HLB in Colombia through the use of geospatial technology, specifically remote sensors and geographic information systems that allow determining the location of vulnerable hosts, areas climatically suitable and the number of generations of D. citri that could be formed under certain environmental conditions. The consolidated data could serve as an input to strengthen the surveillance and monitoring actions carried out in the country.
Geospatial technology or geotechnology has been a useful tool in detecting areas affected by HLB or by D. citri, particularly in the generation of predictive models and spectral recognition from satellite images (Richard et al., 2018). Studies developed by García-Ruiz et al. (2013) and Pourreza et al. (2015) indicated that the use of these methodologies strengthens the location and monitoring of risk areas for HLB from rapid detection in the process of exploration, and helps to delimit the disease territorially, both in asymptomatic and symptomatic stages, which can occur extensively (region) and with constant periodicity. For example, Sankaran et al. (2013) reported that with the use of spectral indices, infected and asymptomatic trees can be classified with an accuracy of 87%. On the other hand, Weng et al. (2018) found that hyperspectral sensors can have 90% accuracy in classifications of trees with HLB. In general, sensors, satellite images, and processing using geographic information systems are tools that allow us to recognize and locate areas with phytosanitary problems.
Materials and methods
The methodological structure is based on the concept of the epidemiological triangle to locate areas with potential risk for HLB when establishing the correlation between environment, pest, and host (Scholthof, 2007). Each of these variables is related to the potential for introduction, establishment, and spread of the HLB-D. citri pathosystem for which different spatialization methods were used. These are described below.
Spatial identification of hosts
For the identification of commercial and rural hosts, data from the Information and Communication Network of the Agricultural Sector of Colombia (Red de Información y Comunicación del Sector Agropecuario de Colombia [Agronet], 2017) and the Third National Agricultural Census carried out by the National Administrative Department of Statistics (Departamento Administrativo Nacional de Estadística [DANE], 2014) were obtained. The report on the statistics of the area planted with the hosts, including orange, lemon, tangerine, Tahiti lime, and grapefruit, were concentrated in a single database at the municipal level. This information was combined with a vector map (shapefile) at the municipal level downloaded from the Geoportal of the Geographical Institute Agustín Codazzi (Instituto Geográfico Agustín Codazzi [IGAC], 2005). The cartography of the planted surface was represented through colors per municipality; the warm colors (red) indicate the sites with the largest surface area, and the cold colors, the sites with the smallest surface area.
Characterization of degree-days of development using satellite images
The degree-days of development (DDD) model, also known as heat units or development units, was used according to which the development speed of insects is proportional to the temperature of their environment and they require a certain amount of heat to pass from one point to another in its life cycle (Damos, 2015; Pruess, 1983). This relationship can be established by knowing the lower and upper threshold temperatures between which the species develops, and the number of heat units necessary to complete its life cycle (egg-adult, in the case of insects) (Maiorano, 2012).
Daily satellite images of the surface temperature of the earth (LST) were downloaded from the Level-1 portal, the Atmosphere Archive & Distribution System, and the Distributed Active Archive Center (LAADS DAAC) of NASA, where the data set MOD11A1 MODIS/Terra Land Surface Temperature/Emissivity Daily L3 Global 1km SIN Grid, V006 (Wan et al., 2015) is hosted, to generate the DDD model. The images were taken on December 31, 2018, and May 31, 2019, and those from subdataset 0, which correspond to daily LST, were downloaded. The spatial resolution of these images is 1km x 1km, and they are geographically divided into six grids that cover almost the entire Colombian territory. Then, the pixel values were scaled –originally in the range of 7,500 to 65,535– using a raster calculator by multiplying the image by the scale factor, whose value is 0.02. This resulted in the pixel value in kelvin units, which were then converted to centigrade (Wan et al., 2015). After radiometric correction of the cloudiness of the processed images, the following formula was applied:
Where Tmin: minimum temperature; Tmax: maximum temperature, and UI: lower temperature threshold (Arnold, 1960; Snyder, 1985). For D. citri, the data obtained by Nava et al. (2007), who reported a lower threshold of 10.45 °C and a maximum of 35 °C, with accumulative degree-days of 210.9 for the egg-adult phase were used. In the end, the total of the images downloaded by each grid was added (31 images for both dates), and a mask was applied to extract only pixel values from Colombia.
Potential distribution model
With the sites of the presence of D. citri and the bioclimatic variables, a potential distribution model was obtained using the Maxent software. This program uses an artificial intelligence method that applies the principle of maximum entropy to calculate the most probable geographic distribution of a species using as data, only the sites of presence and the bioclimatic variables associated with them (Phillips et al., 2006). For this, the information on the presence of D. citri in Colombia recorded on the website of the Global Biodiversity Information Facility (GBIF, 2019) and the reports of Ángel et al. (2014), Moncayo-Donoso et al. (2014), King (2012), and ICA (2010) were employed. In total, 398 D. citri presence records were obtained, organized by longitude and latitude, and prepared in a comma-delimited database (CSV) for incorporation into the software. As bioclimatic variables, the world layers of WorldClim were used, which correspond to 19 climatic variables (table 1) in raster format and with a resolution of 1 km x 1 km (Fick & Hijmans, 2017; Hijmans et al., 2005).
Table 1 Bioclimatic variables used to generate the potential distribution model for D. citri
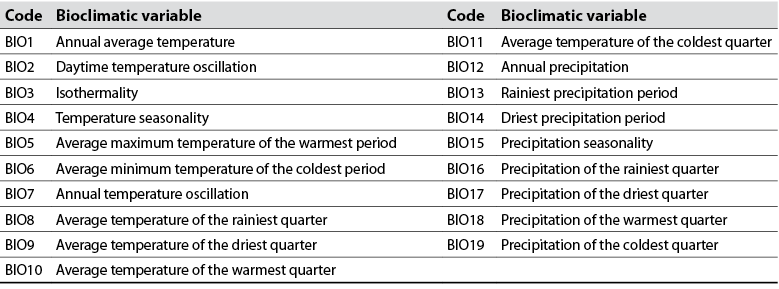
Source: Hijmans et al. (2005)
When running the model, 80% of the data were considered for training and the remaining 20% to measure the predictive capacity (test); furthermore, an output of the logistic model was obtained with predicted presence probabilities between the binary range (Phillips et al., 2006; Tang et al., 2019). The result of the model expresses the value of the habitat suitability for D. citri as a function of the environmental variables through the statistical validation test area under the curve (AUC). This test indicates sensitivity, understood as the probability of obtaining a presence result when the species is present; the closer to 1, the more reliable the result will be (Phillips et al., 2006). Additionally, the software calculates from iterations, the contribution percentage to the model of each of the bioclimatic variables used for its creation. This analysis shows the climatic similarity between the sites inhabited by D. citri, and that represent a risk due to dispersal probability.
Identification of risk areas
For the definition of the risk areas for HLB in Colombia, the result of the previously described procedures (Scholthof, 2007) was used: degree-days of development (pest), surface planted with citrus (host), and potential distribution model (environment). Each layer was homologated to values between 0 and 1, where 1 represented the maximum value obtained according to its subject or topic, and the numbers close to 0, the minimum value. Subsequently, a multicriteria analysis was performed in the QGIS geographic information system, in which the same weight was assigned to each of the three variables obtained. The risk map is intended to locate potential sites for the presence of the HLB-D. citri pathosystem and recognize the probabilistic intensity of the damage. The risk scales were grouped into values that ranged from 0 to 1, where values close to 1 indicate the highest risk and are identified with warm colors (red), and values near 0 indicate the lowest risk and are represented with cold colors (blue).
Results and discussion
As seen in Figure 1, citrus plants are cultivated in all the natural regions of Colombia. According to the Third National Census of Agriculture in 2014, Colombia has a planted area with citrus crops of just over 160,000 ha distributed in 885 municipalities in 33 departments (DANE, 2014). In the Andean and Caribbean regions, higher density and surface of host plants are observed. The predominant citrus fruits are orange, lemon, mandarin, Tahiti lime, and grapefruit.
Previous HLB detections have been described in six departments in northern Colombia, which account for 11.2 % of the commercial citrus of the country (DANE, 2014); that is, about 11,000 ha are vulnerable to the disease. However, due to its proximity to areas with HLB, the Santander department, which has the largest planted area with commercial citrus (>20,000ha), is highly vulnerable to HLB and the infectious D. citri. Besides, it can geographically connect to the quarantine and free areas in the central and western regions of the country. Likewise, the almost total distribution of citrus in the country increases the risk of dispersal and establishment of the disease or D. citri, both due to the mobilization of infectious plant material and to the active or passive dispersal of infected psyllids (Araque & Arévalo, 2018; Galindo, 2014).

Source: Elaborated by the authors based on DANE (2014)
Figure 1 Location of the citrus-producing regions in ColombiaThe color scale indicates the planted area, and the red lines mark the areas where the detection of HLB-associated bacteria has previously been reported
The degree-days of development models were elaborated for December 2018 and May 2019. Even though there is little thermal oscillation in the country due to its proximity to the equator, these months are the ones with the highest contrast in the average ranges of mean temperature (Instituto de Hidrología, Meteorología y Estudios Ambientales, 2017). In both, sites with temperatures above the lower threshold of development in 24 hours were identified, being 10.45 °C for D. citri (Nava et al., 2007), with the accumulation of 31 days for both dates.
In figure 2 is shown the DDD model for December, which indicates that in most of the country, there are favorable climatic conditions for the development of at least one generation of D. citri. In the northern zone (Caribbean region), where the presence of the disease is currently reported, the temperature was favorable with more than 600 heat units, which represented the possible development of three or more generations (egg-adult life cycle) of the psyllid during that month. In the Andean and Orinoquia regions, the climatic conditions found may favor the development of two to three generations, specifically in the departments of Antioquia, Arauca, Casanare, Santander, Tolima, and Vichada. In May, the favorable temperature for D. citri only occurred in areas north of La Guajira and some small areas of the departments of Bolívar, Cesar, Magdalena, and Tolima (figure 3). However, the conditions for the development of the psyllid occurred in most of the country, although the accumulated heat units for this month were lower than those recorded in December. These data coincide with those presented by Botero et al. (2011), who indicate that between November to January, in the departments of Cundinamarca, Santander and Tolima, there is a higher number of individuals of D. citri in the egg and nymph stages in C. latifolia and C. sinensis; likewise, for ornamental hosts (S. glutinosa) in Cundinamarca and Tolima, there were a higher number of individuals in the population fluctuations of D. citri during these months.
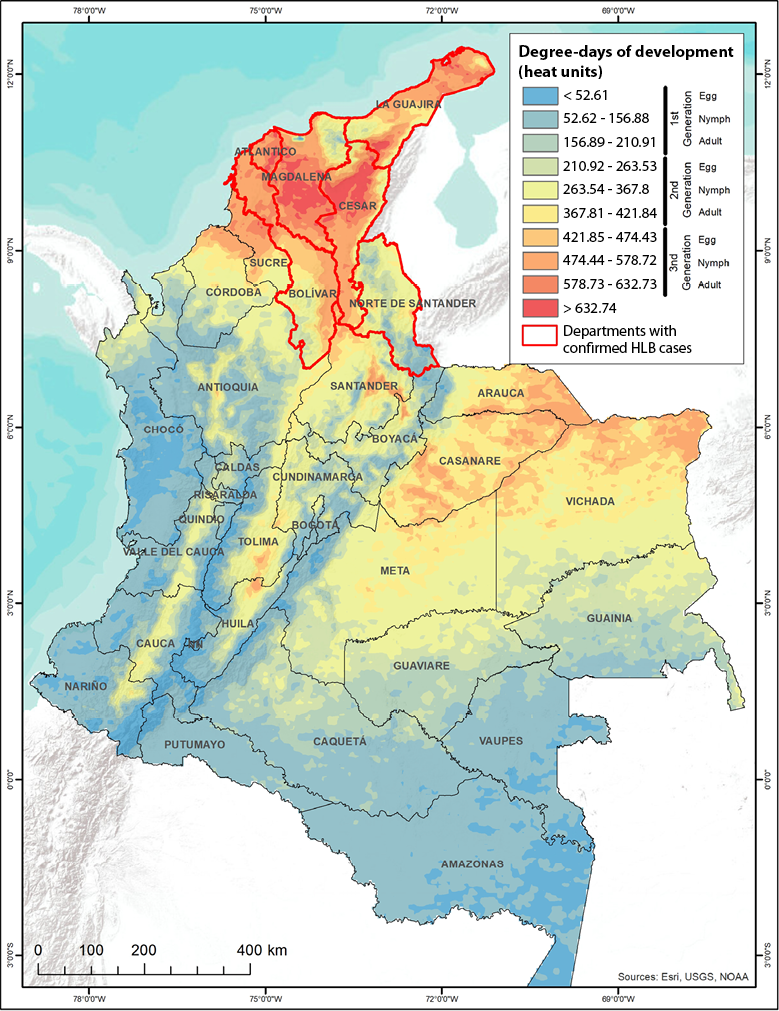
Source: Elaborated by the authors based on Wan et al. (2015) and Nava et al. (2007)
Figure 2 Degree-days of development model of D. citri for the Colombian territory in December 2018The color scale represents the amount of DDD, and the red lines mark the areas where the detection of the HLB-associated bacteria has previously been reported

Source: Elaborated by the authors based on Wan et al. (2015) and Nava et al. (2007)
Figure 3 Degree-days of development model of D. citri for the Colombian territory in May 2018The color scale represents the amount of DDD, and the red lines mark the areas where the detection of the HLB-associated bacteria has previously been reported
The maximum entropy potential distribution (Maxent) model for D. citri (figure 4) was created after reaching 5,000 iterations, resulting in an AUC of 0.898 in the model data, which, according to Peterson et al. (2011) and Phillips et al. (2006), presents a high prediction given that the sensitivity and specificity curves are close to 1. The variables that most contributed to the generation of the model were annual precipitation (39.4%), isothermality (9.5%), precipitation seasonality (6.9%), precipitation of the most humid quarter (5.8%), average daytime temperature range (5.8%), annual temperature range (5.4%), maximum temperature of the warmest month (5.1%), and minimum temperature of the coldest month (5.1%). The sum of these variables explained 78% of the model and coincided with the one obtained by Narouei-Khandan et al. (2016), in which study the variables of annual precipitation, minimum temperature of the coldest month and precipitation of the most humid quarter defined the distribution of the psyllid and also of the disease.
Precipitation has been reported to be a climatic variable that drastically decreases egg and nymph densities (Botero et al., 2011; Hall et al., 2013); in the model, this variable reduces the probability of the presence of D. citri when precipitation is higher than 1,000 mm per year. Temperature is another relevant variable: the optimal range for the growth of psyllid populations is between 25 °C and 28 °C, and the thresholds where it does not develop are <10 °C and >33 °C (Liu & Tsai, 2000). In the model, the probability of the presence of D. citri decreases almost to zero when the maximum temperature of the warmest month is higher than 34 °C and the minimum temperature of the coldest month is less than 10 °C, data similar to those obtained by Wang et al. (2019). Regarding isothermality, the probability of presence increases by up to 60% when temperatures are between 26.6 °C and 32.7 °C (Liu & Tsai, 2000).
In figure 4, sites with values close to 1 are those with the highest potential distribution for D. citri; that is, they have adequate conditions for the establishment of the disease. The areas with indices higher than 0.8 correspond to the northern region, where HLB is currently reported. However, departments such as Santander, Cundinamarca, Tolima, Valle del Cauca, Huila (in the Andean region), and Vichada and Casanare (in the Orinoquia region) have a high distribution of psyllids.
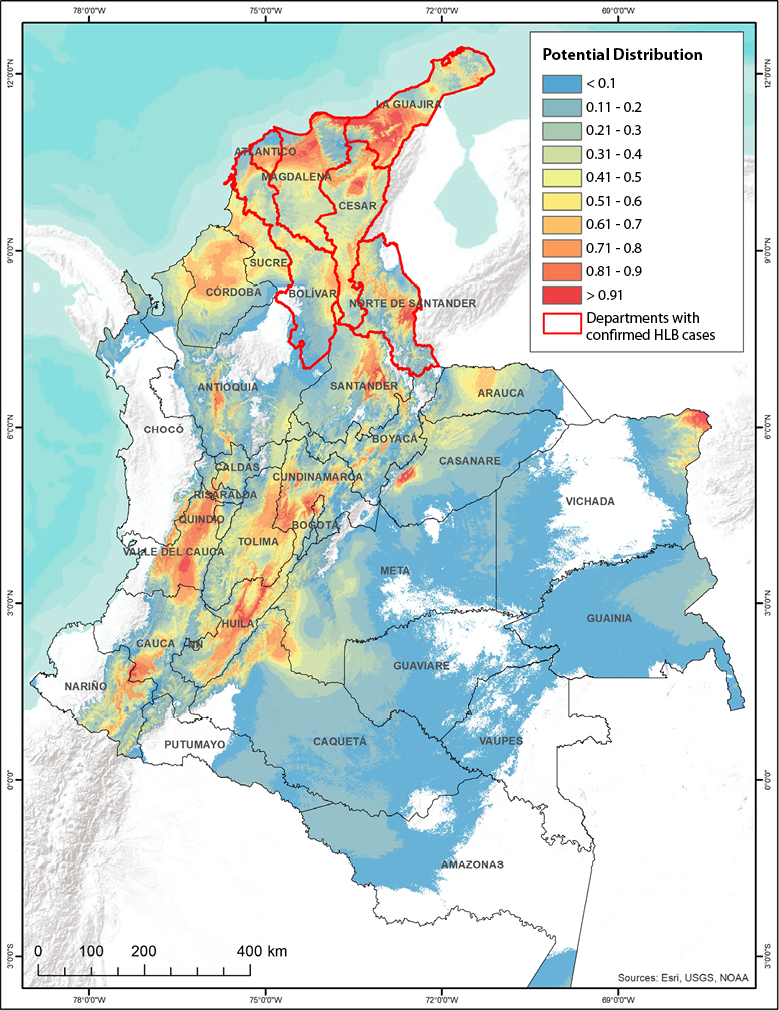
Source: Elaborated by the authors based on Hijmans et al. (2005), Ángel et al. (2014), Moncayo-Donoso et al. (2014), King (2012), and ICA (2010)
Figure 4 Potential distribution model of D. citri
In figure 5 are shown the risk areas for HLB based on the conjunction of the areas with hosts, the degree-days of development of the vector, and the potential distribution for December 2018. It can be noted that there are areas throughout Colombia with high and very high risks to the HLB disease. Extensively and more homogeneously in the Caribbean region, the departments of Atlántico, Cesar, La Guajira, and Magdalena have the largest surface area with very high risk and the confirmed presence of the disease. In the departments of Bolívar and Norte de Santander where HLB is also reported, there are areas with very high risk. The Andean region, where nearly 70% of the citrus is produced in Colombia, has very high risk areas, including the municipalities of Girón, Lebrija, Rionegro and San Vicente de Chucurí (Santander), where altogether, 10% of the commercial citrus is planted (DANE, 2014). There is also a risk in the departments of Caldas, Cauca, Cundinamarca, Huila, and Valle del Cauca, where the commercialization of citrus fruits has economic relevance. In the particular case of the department of Tolima, the areas at risk for HLB coincide with the findings of Araque and Arévalo (2018), which exhibit a high potential dispersal of D. citri due to the proximity of citrus farms and nurseries to roads.
From the generation of disease risk maps, the type of risk presented in each one can be territorialized by department and municipality. This input constitutes an outline of the possible areas vulnerable to HLB, which can serve as a reference for the implementation of actions that help control the disease.
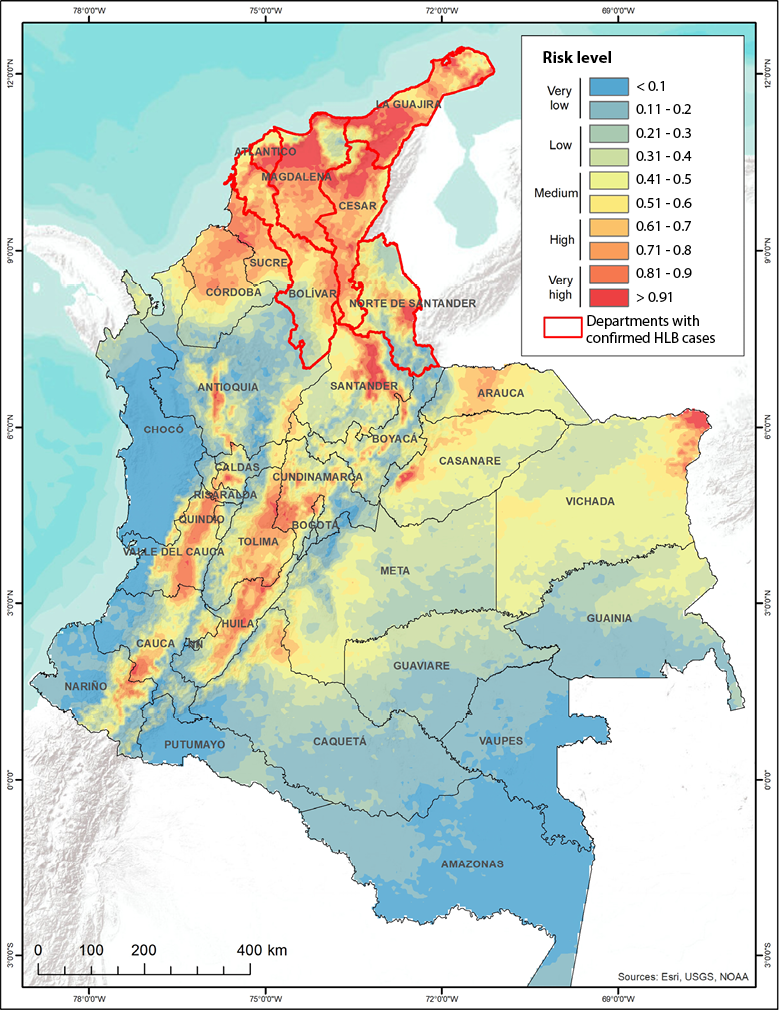
Source: Elaborated by the author
Figure 5 HLB dispersion risk map in the Colombian territory December 2018
According to the current study, the citrus zones of Colombia show large areas with optimal environmental and climatic conditions for the development of the disease. This implies that the over 160,000 ha of citrus fruits currently cultivated in Colombia have different risk levels of getting infected by HLB as follows: very high risk (5.1%), high risk (10.4%), medium risk (19.1%), low risk (28.7%), and very low risk (36.7%) in the environmental conditions of December 2018. The situation changes in May 2019, despite the proximity of the country to the equatorial axis and the low-temperature oscillation. For this month, there is only 0.01% of very high risk in the municipality of Uribia (La Guajira); 0.26% with high risk in small areas of the departments of Huila, Magdalena and Tolima; 3.9% with medium risk in the Caribbean and Andean regions (center and south); 35% with low risk, and 60.4% with very low risk in the rest of the country (figure 6). These data correspond to the reports by Botero et al. (2011), according to which in most areas of the departments of Caldas, Cundinamarca, Meta, and Santander for Citrus latifolia and C. sinensis, and also in the department of Córdoba for S. glutinosa, the production of eggs, nymphs and adults is reduced from the second quarter of the year.
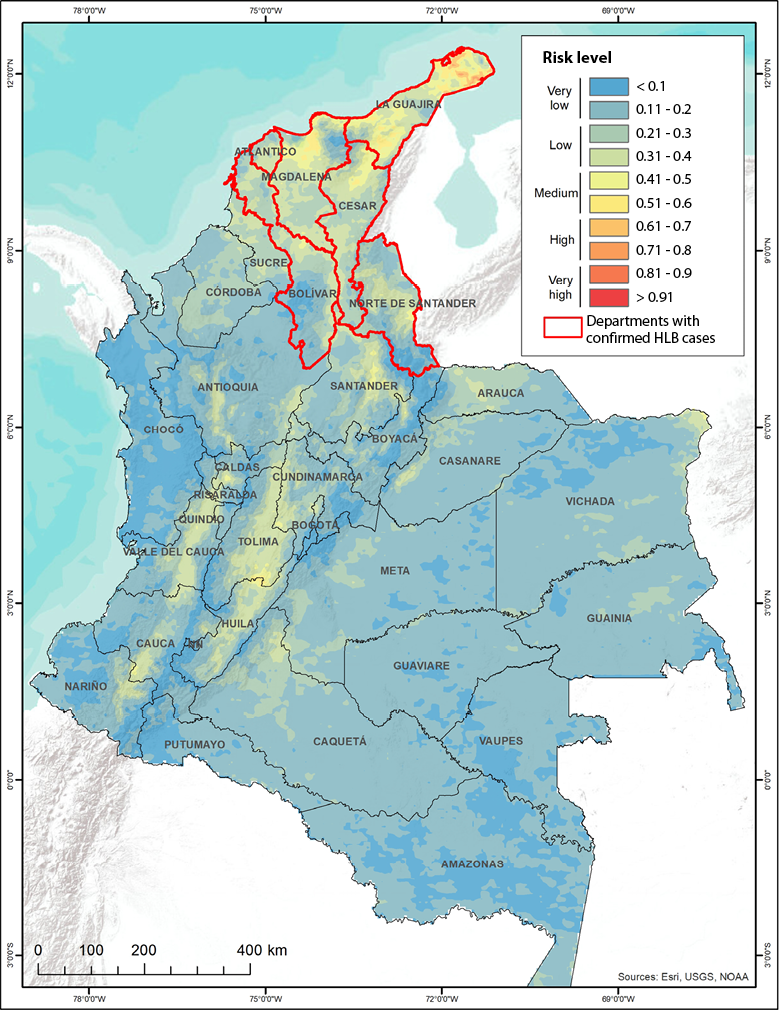
Source: Elaborated by the authors
Figure 6 HLB dispersion risk map in the Colombian territory, May 2019
This difference in the level of potential risk between December 2018 and May 2019 can be defined by the dynamic variable degree-days of development since the heat accumulated by the number of days reported in each of the images corresponds to the temperatures captured by the sensor (MODIS/Terra). In the case of the host and potential distribution variables, their information dynamism will be provided by the ability to update presence data (D. citri) and surface planted with citrus. Likewise, the spatial resolution of the environmental variables and the satellite inputs used to generate the risk model must be considered, as well as the records of the occurrence of the disease (Narouei-Khandan et al., 2016), as the actual surface represented by the model (1km × 1km) suggests differences on a more local scale, where other factors such as variety, plant age, management practices, among others, should be considered if a more accurate risk model is required (Udell et al., 2017).
The incorporation of other types of data such as crop density and proximity of citrus farms or nurseries to roads can improve the risk model since there are relevant variables such as the transport of infectious material and the planting of non-certified plants, which has been demonstrated to have substantial implications for the spread of the disease (Araque & Arévalo, 2018; King, 2012). This agrees with the studies by Thomas et al. (2017) and Galindo (2014), in which detections of D. citri and infective plant material are reported near main roads, which can be an important route of introduction and spread of the disease. The risk areas found in Colombia and the commercial hosts with the highest density are on two main roads (federal highways 45 and 55) that run from the north (where HLB occurs) to the disease-free areas of the central and western regions of the country.
Conclusions
This work proposes an alternative to strengthen the monitoring and surveillance of HLB and Diaphorina citri through the use of geospatial technology to locate areas of potential risk based on the location of host plants, degree-days of development, and potential distribution. The methodological proposal is based on the concept of the epidemiological triangle (Scholthof, 2007), according to the correlation between environment, pest, and host, and is presented as an option for monitoring the disease on a regional scale. Furthermore, it is an automatable procedure, provides immediate results, has a high spatio-temporal dynamic, can be developed with free software and with free satellite images, and uses information available in national and international databases.
The contingency areas (six departments of northern Colombia) where 333 positive cases have been detected (ICA, 2018), can be considered as a major source of infection for the rest of the citrus areas of the country since nearly 11,000 ha are vulnerable to the disease. The Andean and Orinoquia regions are free of the disease, although HLB monitoring, surveillance, and control must be constant since if the disease spreads and becomes established, it could cause economic and environmental damage to more than 100,000 ha of citrus in the area.
The environmental conditions in Colombia are optimal for the disease; the geographical location of the country and the type of landscape generate adequate temperatures for the development of a significant number of generations of D. citri. The potential distribution of D. citri and HLB extends to most of the citrus areas of Colombia; bioclimatic variables such as annual precipitation, minimum temperature of the coldest month, and precipitation of the most humid quarter, define the distribution of the disease.
The technology, especially geospatial, should be used in the detection of areas at risk and their territorial delimitation since it would strengthen monitoring actions and diagnostic processes, which could be carried out regionally or locally and with a high temporal dynamic. Combined with the experience gained in other countries, this technology can help Colombia restrict and control one of the most damaging citrus diseases found today.

