


 Inglés (pdf)
 Articulo en XML
 Referencias del artículo
 Enviar articulo por email
 Citado por SciELO
  Citado por Google
  Similares en
SciELO
Similares en
SciELO  Similares en Google
 Permalink
1. Introducción
Approximately 87% of the Colombian population lives in high and intermediate seismic hazard areas 1, and therefore, there is a high probability of disasters due to earthquakes. An example of this is the 300 deaths from the earthquake in Popayan in 1983 and the 1185 deaths from the earthquake in Armenia in 1999 2. Educational institutions are community service structures and, due to their importance, are expected to withstand the effects of an earthquake and ensure the safety of occupants. However, these types of buildings generally need to be reinforced, in some cases due to their age. An example of this is the Faculty of Engineering of the Del Valle University, located in the Meléndez Campus, of the city of Cali; it has 24 buildings comprising classrooms, auditoriums, laboratories, computer rooms and offices.
The structural system of most of these buildings is a reticular floor slab system, which is appropriate for vertical load stresses, but it does not respond appropriately to stresses from earthquakes, as evidenced in 1985 in Mexico, where a considerable number of buildings with this system suffered structural failures 3.
Conventional reinforcement techniques consist of increasing the cross-sections of structural elements, such as beams and columns, and adding braces or walls to increase stiffness and reduce lateral motion. If these methods are implemented on the buildings of the Faculty of Engineering, service will be suspended during the reinforcement because this approach involves alterations to most structural elements.
As an alternative to this problem, structural control systems have been developed to help mitigate the seismic risk in buildings; among these systems are passive control systems, which are the most simple and robust and can dissipate some of the energy generated by seismic excitations without an external power source, unlike active and semiactive systems that require external power 4-5. One of these devices is the tuned mass damper (TMD), which has been used worldwide to control vibrations in buildings, such as the Citicorp Building in New York (USA), the Taipei 101 Building in Taipei (China) 6, the Chiba Port Tower and the Crystal Tower in Japan. The 90-meter tall Parque Araucano building in Chile has two TMDs of 1% of the mass of the first vibration mode, which corresponds to 150 tons each, and these dampers are intended to reduce the transverse motion during an earthquake 7. Gutierrez and Adeli, in 2013, presented a list of 90 civilian structures with TMDs, with different uses and characteristics 8. Although TMDs have demonstrated their efficiency in reducing building vibrations due to wind and seismic excitations, research has been performed evaluating the influence of the structural inelastic behavior in the performance of the complete system, which can be positive or negative 9-11.
This article considers the application of the roof isolation system, which functions as a TMD, reduces the response of structures to earthquakes 12 and has been used for the seismic retrofitting of buildings 13. Two buildings with 9 and 12 stories in the Republic of Armenia include such systems; the shear force at the base of these buildings was reduced by 1.76 and 1.47 times on average, respectively, and the displacement at the upper story was reduced by 2.20 and 1.39 times on average, respectively 13.
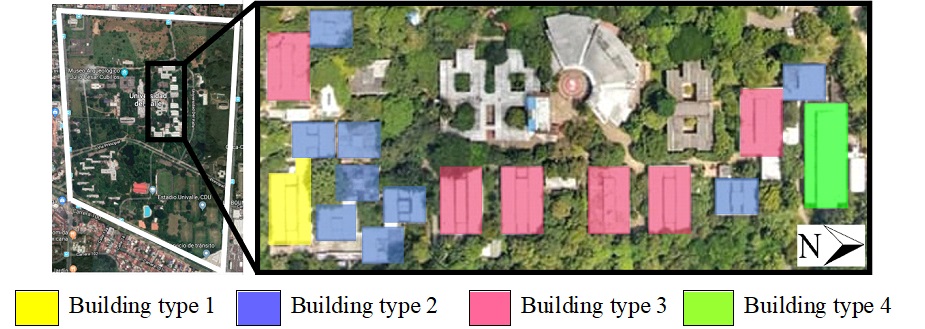
TMDs consist of an additional mass connected to the main structure with an element with a known stiffness and damping coefficient, which are tuned close to the predominant frequency of the main system to absorb some of the energy and reduce the response of the structure to a dynamic load 14. In this study, the existing roof of the building type under study was used as the additional mass, and the elements that provide stiffness and damping were elastomeric seismic isolators, namely, the alternative for the roof isolation system emerges as a structural retrofitting option. Eighteen of the Faculty buildings have a central story that protrudes from the rest of the structure, which is an advantage for the retrofitting system (Figure 1). To accomplish this, the columns need to be removed at the joint with the roof to build concrete spacer blocks on which the isolators are connected.

The most important variable in the design of TMDs is the mass ratio (𝜇), which represents the ratio of the TMD mass (𝑚2) to the mass of the main structure (𝑚1), which in most applications ranges from 1 to 10% 15. Many studies have presented formulations for optimum parameter values using different approaches and criteria for the design of TMDs 16-17. For this study, the dynamic properties of the TMDs were determined according to the optimum parameters established by Warburton in equations Ec. 1 and Ec. 2 for random excitations at the base 16, where γ opt is the frequency ratio and ξ opt is the damping ratio of the TMD.
The seismic isolators assessed in this study are made of high damping rubber (HDR) without a lead core and with chemical compounds added to the rubber sheets to increase the damping of the rubber by up to 20% 17. The results of the project led by the G-7 research group of the Del Valle University, entitled “Technological development of a low-cost seismic isolator for low rise buildings” 18, were used in this case, including the costs of devices 19 and the characteristics of the materials used 20-22.
2. Methodology
2.1 Buildings selected
The buildings highlighted in Figure 2 correspond to those with a central slab which protrudes from the rest of the structure; these buildings were classified into four types based on the characteristics of each building. Types 1 and 4 correspond to one building each, and types 2 and 3 include six and nine buildings, respectively.
The buildings are used for laboratories, research centers, offices, meeting rooms, classrooms, computer rooms, storage rooms, warehouses, electrical rooms, bathrooms and kitchenettes; a representative building was selected for each type (Figure 3).
The buildings have slab-column frame structures corresponding to the reticular floor slab system, in which the slab works in two directions and is lightened in areas far from the columns, which have capitals around them. The slabs have a thickness of 40 cm with 220x220 cm2 capitals, 30x40 cm2 beams on the axes of the columns, 20x40 cm2 beams at the ends of the capitals and 10x40 cm2 joists that form a mesh at the center of the slab (Figure 4). The typical distance between the columns of the buildings is 7.20 m, and there are three slabs, one first floor at level N:+3.2 m and two upper stories at levels N:+6.4 m and N:+8.0 m, except in building type 4, with a level of N:+8.9 m for the third slab.
2.2 Dynamic characterization
Ambient vibration measurements are useful for the identification of dynamic properties of buildings in their elastic range. Dynamic identification results can be used for model updating or validation of numerical models which allow to simulate the structural behavior of buildings and analyzing the effect of dynamic excitations. Ambient vibration tests were performed using four seismic accelerometers, one REF TEK model 130-SMA triaxial equipment and three REF TEK model 131B-01/1 uniaxial sensors. The accelerometers were located at four points on the slab of level N:+6.40 m of the buildings for three different arrangements. The triaxial sensor was set to record all measurements, and the three uniaxial sensors were placed in different points and directions. The measurements lasted five minutes for each of the three arrangements per building, and a sampling frequency of 100 Hz was used.
The recordings were processed to identify the predominant frequencies, vibration modes and associated damping ratios. These parameters were determined using the peak picking technique (PP), the Stochastic Subspace Identification (SSI) and the Natural Excitation Technique with the Eigensystem Realization Algorithm (NExT-ERA).
A Friedman’s analysis of variance by ranks was performed with the results of the three techniques, with the premise that if the hypothesis is null, then there is no significant difference between the data obtained 23. To accept the null hypothesis, the chi-square approximation (𝑥2 𝑟) of the statistical test must be less than the critical chi-square value at the pre-established significance level (𝑝) 23

Source: Owen elaboration.
Figure 3 Representative buildings: a) Type 1, area 2667 m2 and weight 2013 tons. b) Type 2, area 1164 m2 and weight 1022 tons. c) Type 3, area 2278 m2 and weight 1784 tons. d) Type 4, area 3333 m2 and weight 2885 tons.

Source: Owen elaboration
Figure 4 Reticular floor slab structural system (dimensions in centimeters).
For two degrees of freedom (𝑑𝑓=2), the critical chi-square value for a significance level of 0.05 is 𝑥2 0.05=3.84. The chi-square value for the experimental frequencies ranges between 0.18 and 0.67 (less than 3.84), and the 𝑝 value ranges between 0.72 and 0.91 (greater than 0.05); therefore, the hypothesis is null, and there are no significant differences between the results obtained by the three modal identification techniques, which means that these can be combined. Based on the above results, Table 1 shows the average of the experimental frequencies and their standard deviations (fde) for each building type that was used to update the finite element models.
Table 1 Averages of the experimental frequencies of the buildings
| Model | Type 1 | Type 2 | Type 3 | Type 4 | ||||
|---|---|---|---|---|---|---|---|---|
| f (Hz) | fde (Hz) | f (Hz) | fde (Hz) | f (Hz) | fde (Hz) | f (Hz) | fde (Hz) | |
| 1 | 4.27 | 0.03 | 3.09 | 0.03 | 4.04 | 0.04 | 2.39 | 0.06 |
| 2 | 4.71 | 0.08 | 5.07 | 0.10 | 4.45 | 0.09 | 2.81 | 0.08 |
| 3 | 5.25 | 0.13 | 5.81 | 0.02 | 4.86 | 0.05 | 3.94 | 0.03 |
Source: Owen elaboration.
2.3. Finite element models updating
The information from the dynamic characterization is used as reference to update the finite element models of the selected buildings. The computational modeling of the buildings was performed in a finite element software (SAP2000), using shell elements to model slabs and capitals and frame elements for beams and columns. The physical parameters selected to update the finite element models were those that could produce a significant variation between the modeling and the actual buildings condition during the ambient vibration tests: the reinforced concrete properties, the live load on the structure, the stiffness contributed by nonstructural elements and the flexibility of the foundation. For the compressive strength of the concrete, the variation range chosen was between 14 and 19 MPa based on some studies on the Faculty buildings 24-27 and according to paragraph C.8.5.1. of Regulation NSR-10 28.
In 2014 29, during a one-week survey that took the use of the space into account, Valencia conducted ambient vibration tests on type 1 building and estimated the live load to be approximately 147.2 N/m2. According to paragraph B.4.2.1 of Regulation NSR-10 28, the maximum live load expected for institutional buildings is 2000 N/m2; based on this, the variation range chosen was between 100 and 2000 N/m2.
The stiffness of nonstructural walls was associated with the elastic modulus and Poisson's ratio of an equivalent system, and the variation range chosen for the effective stiffness was from 0 to 2 times the elastic modulus of the walls 29. The foundation was represented by a series of dependent or interdependent springs. Different formulations were developed to determine the stiffness coefficients (K) 30-32. In this study, these coefficients were determined using the dynamic model of the Russian Technical Standard SNIPs 2.02.05-87 31, which considers the flexibility of the foundation and the inertial properties of the soils. To apply this model, the footings were classified by type, and the stiffness coefficients (K) were calculated assuming a 0.5K - 1.5K variation 29.
In the model updating process, MATLAB was used with the finite element software SAP2000 through its application programming interface (API). The updating consisted of an iterative process in which functions were used in MATLAB to open the model in SAP2000, change the selected parameters, analyze the model and store its dynamic properties in MATLAB. For this purpose, an objective function (OF) Ec. 3 that needs to be minimized was defined; this function depends on the frequencies and the Modal Assurance Criterion (MAC), which is a statistical indicator that expresses the degree of consistency between modal forms 33.
Table 2 Reinforced concrete properties from the model updating process
| Floor | Building type 1 | Building type 2 | Building type 3 | Building type 4 | ||||
|---|---|---|---|---|---|---|---|---|
| f'c (MPa) | E (MPa) | f'c (MPa) | E (MPa) | f'c (MPa) | E (MPa) | f'c (MPa) | E (MPa) | |
| 1 | 17.4 | 19602.4 | 18.5 | 20239.1 | 17.6 | 19716.5 | 18.3 | 20132.1 |
| 2 | 16.5 | 19070.8 | 18.3 | 20090.3 | 16.6 | 19162.6 | 17.9 | 19893.9 |
Source: Owen elaboration
Table 3 Difference between the experimental and analytic frequencies for the buildings
| Md | Type 1 | Type 2 | Type 3 | Type 4 | ||||||||
|---|---|---|---|---|---|---|---|---|---|---|---|---|
| fe (Hz) | fa (Hz) | %d | fe (Hz) | fa (Hz) | %d | fe (Hz) | fa (Hz) | %d | fe (Hz) | Fa (Hz) | %d | |
| 1 | 4.27 | 3.96 | 7.31 | 3.09 | 3.04 | 1.62 | 4.04 | 4.10 | 1.55 | 2.39 | 2.12 | 11.5 |
| 2 | 4.71 | 4.71 | 0.03 | 5.07 | 5.04 | 0.54 | 4.45 | 4.46 | 0.34 | 2.81 | 3.17 | 12.7 |
| 3 | 5.25 | 5.13 | 2.30 | 5.81 | 5.75 | 1.04 | 4.86 | 4.74 | 2.50 | 3.94 | 3.91 | 0.7 |
Source: Owen elaboration.
Where 𝜌 is the relationship between the analytical and experimental frequencies, 𝜑𝑚𝑗 is the experimental mode shape, 𝜑𝑎𝑗 is the analytical mode shape, 𝑊𝑤𝑗 is the frequency weight, 𝑊𝜑𝑗 is the mode weight and 𝑟 is the number of modes for the analysis 29.
Function fmincon was used to perform the optimization and find the parameter values that minimize the objective function. This function serves to modify the values in the SAP2000 structural model and calculate the frequencies and mode shapes of the model and the objective function using the experimental data mentioned. When the difference between the experimental and calculated frequencies is less than 15% and the MACs have a correlation higher than 90%, the function fmincon ends and returns the searched values of the selected parameters.
Table 2 shows the properties obtained for the reinforced concrete. The live load values varied between 320 and 793 N/m2, the effective stiffness factors of the nonstructural walls varied between 0.15 and 1.40 and the stiffness coefficients of the soil-foundation dynamic system varied between 0.4 and 1.9 times with respect to the initial values.
Table 3 shows the differences between the average experimental frequency and the analytical frequency obtained in the updating process for each mode. Each process from the interaction between MATLAB and SAP2000 lasted approximately 25 to 28 hours on a computer with a 3.3 GHz processor and 8 GB RAM. Md corresponds to the vibration mode, fe corresponds to the average experimental frequency, fa corresponds to the analytic frequency, and %D corresponds to the percentage difference between fe and fa.
2.4 Seismic records
This study used three seismic records listed in the seismic Microzonation of Cali, adjusted and verified according to recommendations in Regulation NSR-10, which correspond to Chile in 2005 (100 s duration) with a depth of 61 km and magnitude of 7.9 Mw, Mexico in 1985 (140 s duration) with a depth of 21 km and magnitude of 8.1 Mw and New Zealand in 1991 (30 s duration) with a depth of 15 km and magnitude of 5.8 Mw (Figure 5).


A Response History Analysis was performed to evaluate the current structural behavior of the buildings and the performance of the retrofitting alternatives. Scaling and adjustment of the accelerograms were performed according to section A.2.7 of the NSR-10 Code. Surface response, including site effects, was calculated through software EFE-SIO 34, considering the soil properties and the effective peak acceleration coefficient for the seismic zone (0.25 g). Irregularity type 2P was considered for the building type 1, according to the NSR-10 Code.
2.5 Index of flexibility (IFL) and demand-capacity ratio (DCR)
The seismic analysis showed that the buildings do not meet the requirements for IFLs and DCRs. The IFLs indicate the susceptibility of the structure to excessive deflections. According to paragraph A.6.4.1 of Regulation NSR-10, the maximum value allowed for IFL is 1% for reinforced concrete structures. The IFLs were analyzed in the three levels of each type of building, namely, in the first floor and the two upper stories. The maximum IFL values were 2.4%, 2.1%, 2.2% and 2.7% for Type 1, Type 2, Type 3 and Type 4 buildings, respectively (Figure 6).
All buildings were classified as structures with minimum energy dissipation capacity and the seismic analyses were performed in the linear range. The demand-capacity ratio (DCR) is expressed as the quotient between the equivalent stresses, calculated according to the seismic analysis, and the effective strength of the structure. The DCR for the entire structure is defined as the highest of the indices evaluated individually on the structural elements 28. The maximum overstressed bending-compression-buckling ratios due to the three earthquakes used for each building type are greater than 1.0 for all columns, showing that they do not meet the requirements of Regulation NSR-10. The highest DCR values were 9.2, 8.2, 8.1 and 8.8 for Type 1, Type 2, Type 3 and Type 4 buildings, respectively.
2.6 Building vulnerability
According to paragraph A.10.5.1 of Regulation NSR-10, the seismic vulnerability of existing buildings is expressed as the inverse of the overall flexibility index and the inverse of the overall DCR, which represents a fraction of the stiffness and a fraction of the strength, respectively, a new building would have if it was constructed in compliance with the regulations. Table 4 shows the percentages for each building type.
2.7 Seismic protection alternatives
2.7.1 Conventional reinforcement
The conventional reinforcement for the buildings consists of concrete jacketing around columns and the addition of metal beams underneath the existing slab to form frames and improve the slab strength and energy dissipation; in addition, the beams are complemented with metal braces to increase the lateral stiffness of the buildings (Figure 7).
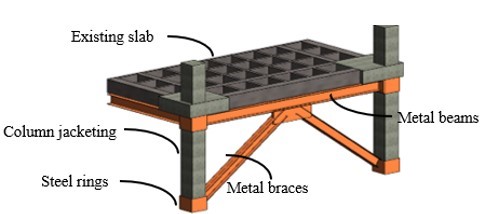
The column jacketing consists of the demolition of the existing covering and the subsequent placement of a steel reinforcement, which involves the demolition of the capitals to continue with the longitudinal reinforcement steel. This leads to shoring up the slab during the construction work and prohibiting the use of the building. The next step is to add the concrete jacket up to the dimensions required by the structural design. In addition, concentric metal bracing was used, which consists of two diagonal elements that connect to the structural steel beam above which the reinforced columns will be attached; these columns require two metal rings at the top and bottom of the braced sections.
The described conventional reinforcement design was performed for all building types and the results were used for comparison with the proposed roof isolation alternative described next. Both seismic protection alternatives are comparable because they reach the same performance level of limited safety, according to the NSR-10. The performance level for both seismic protection alternatives was evaluated through nonlinear static analyses (pushover).
2.7.2 Roof isolation system
The roof isolation system works as a TMD, which consists of an additional mass connected to the main structure with an element with a known stiffness and damping coefficient. In this study, the main structure corresponds to the building without the upper slab, which was used as the mass for the device, and the elements that provided the stiffness and damping were elastomeric seismic isolators. The properties used were from the seismic isolators developed and manufactured by the G7 research group of the Del Valle University. These devices were designed for a five-story building located in the city of Cali, Colombia, and were experimentally tested in the real scale at the School of Civil Engineering and Geomatics 19-22.
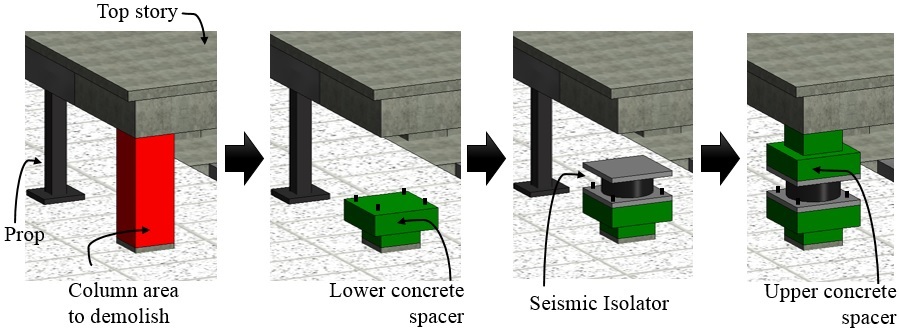
Before the demolition of the columns, the top story must be verified to be well supported by props to prevent an abrupt collapse (Figure 8). The reinforcing steel of the new concrete spacer blocks must be set using epoxy anchors to then pour the concrete. The seismic isolator has to be inserted between the two reinforced concrete blocks, which must be larger than the device to anchor them (Figure 8).
As a normative framework, the part of paragraph A.3.9 of Regulation NSR-10 that indicates that the use of energy dissipating elements is allowed was taken into account, considering the requirements of FEMA 450 or ASCE/SEI-705 28.
The preliminary design of the TMD was performed by determining the properties of the seismic isolators and verifying their compliance with regulatory requirements using the software AIZLA 35. Subsequently, through an iterative process, the TMD properties are entered into the SAP2000 software, and the structural analysis is performed, verifying the drifts and DCRs and ensuring that the design of the isolators complies with the new load and motion requirements. The iterative process ends when the drifts are less than 1%, the DCRs are less than one and the design of the seismic isolators meets the requirements. The design process was carried out in two stages; in the first stage, excessive motion was reduced, decreasing the drifts to less than 1%, but the DCRs of the columns varied in the range of 0.7 and 1.7. To reduce the DCRs of the noncompliant columns, the use of metal jacketing was proposed as a minimum impact solution. Table 5 shows the final design of the roof isolation system for each building. Table 6 shows a summary of the properties of the seismic isolators designed with the software AIZLA 35. In the case of building type 4, two types of seismic isolators were designed to obtain the best TMD behavior.
Table 5 Final design of the roof isolation system
| Property | Building type | |||
|---|---|---|---|---|
| 1 | 2 | 3 | 4 | |
| Mass (Ton*s2/m) | 12.5 | 3.4 | 12.2 | 36.5 |
| Mass ratio (%) | 7.3 | 3.8 | 7.9 | 15.6 |
| Effective stiffness (Ton/cm) | 11.6 | 2.1 | 8.6 | 18.0 |
| Damping (%) | 10% | 10% | 10% | 10% |
Source: Owen elaboration.
Table 6 Properties of seismic isolators for the roof isolation system
| Property | Building type | ||||
|---|---|---|---|---|---|
| 1 | 2 | 3 | 4 | ||
| Number of isolators | 10.0 | 4.0 | 10.0 | 10.0 | 8.0 |
| Damping ratio (%) | 10.0 | 10.0 | 10.0 | 10.0 | 8.0 |
| Total height (cm) | 25.2 | 28.4 | 25.8 | 25.2 | 25.4 |
| Diameter (cm) | 50.0 | 38.0 | 45.0 | 50.0 | 46.0 |
| Effective stiffness (Ton/cm) | 1.16 | 0.53 | 0.86 | 1.20 | 1.01 |
| Vertical stiffness (Ton/cm) | 1961.0 | 539.7 | 1078.1 | 1987.7 | 1557.2 |
| Shear modulus (kg/cm2) | 6.5 | 6.5 | 6.5 | 6.7 | 6.7 |
| Effective damping (Ton*s/m) | 2.41 | 1.34 | 2.05 | 3.23 | 2.73 |
| Vertical damping (Ton*s/m) | 98.94 | 42.56 | 72.58 | 127.01 | 112.42 |
| Yield strength (Ton) | 4.0 | 2.0 | 3.1 | 4.13 | 3.5 |
Source: Owen elaboration.
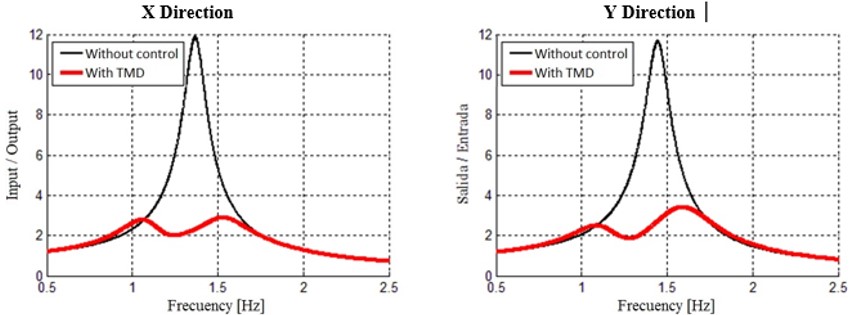
With the incorporation of a TMD in a structure, the natural frequency (fn) of the main system is divided into a lower frequency (f1) and a higher frequency (f2) 15 to decrease its vibration amplitude. To assess the performance of the TMDs in reducing the vibration amplitudes of the fundamental frequency of the building types, a logarithmic frequency sweep of the acceleration at the base columns lasting 1000 seconds in duration at a frequency range of 0.5 Hz to 3 Hz was generated to identify the reduction in the greater amplitude frequencies using the transfer function in each building type, with and without the TMD device (Figures 9 to 12) in the X and Y directions.
The accelerations in the story generated by the sweep at the base were used as the output signal; the analysis of the transfer functions (FT) at different points shows a similar behavior, and therefore, Figures 9 to 12show the representative results for each building type.
The TMD was tuned for the vibration mode that had the highest mass involvement associated with each structure without the central upper story. In the case of the type 1 building, the second vibration mode was considered; for the other building types, the tuning was done with the first vibration mode. However, for the two fundamental frequencies with the highest mass participation, their amplitudes were significantly reduced, which shows the effectiveness of the devices designed for each structure.
The decreased motion with the TMD in the buildings was analyzed, and reductions between 50 and 90% were observed with the earthquakes used; as a representative example, Figure 13 shows the motion that occurred at the upper slab in the more flexible direction of the structures for the 1985 earthquake in Mexico.

Source: Owen elaboration.
Figure 9 Amplitude of the FT for the acceleration sweep at the base of building type 1.

Source: Owen elaboration
Figure 10 Amplitude of the FT for the acceleration sweep at the base of building type 2.
Source: Owen elaboration.
Figure 11 Amplitude of the FT for the acceleration sweep at the base of building type 3.

Source: Owen elaboration.
Figure 12 Amplitude of the FT for the acceleration sweep at the base of building type 4.

3. Results
The conventional reinforcement and the retrofitting with the control system meet the IFL and DCR required by Regulation NSR-10 for structural elements. The comparison of the seismic response of both alternatives shows that the roof isolation system can reach the same effectiveness levels of a conventional reinforcement and reduce the DCR values to less than one. In the case of the roof isolation system, the drifts were analyzed in the first two levels of each building, namely, in the floor structure of levels N:+3.2 m and N:+6.4 m, because the roof isolation system is arranged on the third level. In all cases, drifts of less than 1% are obtained for the three earthquakes used (Figure 14). For the two retrofitting alternatives, the drifts meet the 1% limit required by Regulation NSR-10.

The roof isolation system decreases the seismic stresses on the structural elements and reaches DCR values of less than 1 for the columns, which in the previous analysis had values greater than the allowed values. DCR values of less than 1 are also obtained with the conventional reinforcement (Figure 15); however, an invasive intervention must be carried out, which implies the suspension of service in the buildings.

Determining the costs of each proposal analyzed is a very important factor because it indicates the viability of each proposal. For this reason, implementation costs were calculated for the conventional reinforcement proposals and for the alternatives based on the roof isolation system. The activities considered for conventional reinforcement include the rental of machinery, enclosures, demolition, debris removal, formwork installation, epoxy and reinforcing steel application and concrete pouring.
To calculate the costs of the alternatives with the roof isolation system for the building types, an analysis was done on the group of columns that needed intervention, where the existing slab for the TMD is used, and the metal jacketing for the columns that required it was also considered. To determine the costs of the reinforcement and retrofitting alternatives, a unit price analysis (APU) was performed, based on the unit price lists of the State Government of Valle del Cauca. The cost of the seismic isolators was provided by the G7 research group of the Del Valle University 19-21 and by a commercial company from the United States.
Table 7 Comparison of the implementation costs by building type
| Alternative | Building type | |||
|---|---|---|---|---|
| 1 | 2 | 3 | 4 | |
| Conventional reinforcement | $ 572 939 USD | $ 228 922 USD | $ 548 182 USD | $ 667 033 USD |
| TMD with local isolators | $ 93 688 USD | $ 48 858 USD | $ 79 071 USD | $ 140 510 USD |
| Reduction (%) | 84% | 79% | 86% | 79% |
| TMD with commercial isolators | $ 125 952 USD | $ 72 359 USD | $ 108 835 USD | $ 184 076 USD |
| Reduction (%) | 78% | 68% | 80% | 72% |
Source: Owen elaboration.
Table 7 shows the cost of both alternatives. The implementation costs of the retrofitting alternative with the control system decrease between 79 and 86% compared to the conventional alternative, considering seismic isolators from the company Surtidor Industrial; there are also reductions of between 68 and 80% considering the devices supplied by the commercial company in the United States.
4. Conclusions
Eighteen of the 24 buildings of the Faculty of Engineering of Del Valle University have a central story that protrudes from the rest of the structure, which is an advantage in applying a roof isolation system that functions as a TMD. The buildings were classified into four types, and a representative building was selected for each type. Seismic vulnerability analyses for the four building types showed that the stiffness of the buildings is between 31 and 40% of that of a new building, and the strength is between 7 and 8% of that of a new building.
The dynamic properties of the buildings were identified through an experimental modal analysis of the behavior of the structure under ambient vibrations. An analysis of variance was performed on the results of the three techniques used, and it indicated that there were no significant differences.
Building models were created in the finite element software SAP2000 and fit based on the results of the dynamic characterization by varying the physical parameters that would cause a significant variation between the models and the constructions. These parameters included the reinforced concrete properties, the live load on the structure, the stiffness provided by nonstructural elements and the flexibility of the foundation. The results obtained were satisfactory, with differences of up to 13% between the experimental and calculated frequencies and a correlation between modal forms greater than 90%.
Using the transfer functions from the acceleration at the base and the acceleration at the story of level N:+6.40 m obtained with and without the control system, the effectiveness of the TMD is apparent because it significantly reduces the amplitudes of the vibration frequencies in the first two natural modes, which have the most associated mass involvement.
The roof isolation system decreases the dynamic response of the first two vibration modes and allows the strength of the structural elements to withstand the seismic stresses, which shows that the designs are satisfactory.
This study shows that both the conventional reinforcement and the retrofitting with roof isolation are effective seismic protection alternatives; however, the conventional alternative involves an invasive intervention and a suspension of building use. With the roof isolation system, the construction is less complex and can be executed in less time.
Continuous structural monitoring of the buildings is essential after implementing the roof isolation to verify its effectiveness. As a representative example, the arrangement of the monitoring system installed in building type 1 is recommended 31.

