


 Inglés (pdf)
 Articulo en XML
 Referencias del artículo
 Enviar articulo por email
 Citado por SciELO
  Citado por Google
  Similares en
SciELO
Similares en
SciELO  Similares en Google
 Permalink
Introduction
In Colombia, the poultry industry has an important role in the economy and food safety of the country. In 2019, commercial egg production was estimated at 14, 383,000 million eggs, representing an annual per capita intake of approximately 291 eggs. The estimated chicken meat production for the same year was 1,693,178 tons, for a per capita intake of about 36.5 kg/year (Fenavi 2020). This amount of chicken meat is about twice as much as the estimated beef intake for the same year (18.6 kg/per capita, FEDEGAN 2020). The Colombian poultry agribusiness depends almost entirely on imported corn to produce complete feeds. Annual corn production in Colombia is very low (about 1.6 million tons) compared with the annual demand of approximately 7 million tonnes (Fenalce 2020). The difference between supply and demand results in the need for animal feed producers to import corn, mostly from the United States.
Corn is quantitatively the major ingredient in poultry diets (with inclusion levels up to 50-60%) and corn quality is expected to have a significant impact on poultry health and performance. Transport of imported corn to local feed mills involves long journey distances and long storage times that create a risk for grain quality deterioration and contamination. Further, corn is known to be the cereal at highest risk of contamination with fungal toxins known as mycotoxins, which can be produced both in the field and during storage.
Depending on their concentration in feed, mycotoxins may affect the productive performance and/or the health of birds (Aguillón-Páez et al. 2020; Diaz 2020). However, no studies have been conducted comparing the performance of laying hens or broilers chickens fed diets formulated with Colombian or imported corn. The objective of the current study was to evaluate selected performance parameters in laying hens and broiler chickens receiving diets formulated with either locally grown corn or corn imported from the United States.
Materials and methods
The trials were conducted at the Poultry Research Facility of the College of Veterinary Medicine and Animal Science, National University of Colombia. Chemical analyses were carried out at the Toxicology and Animal Nutrition laboratories of the same college. The experiments were approved by the Ethics Committee of the College of Veterinary Medicine of the National University of Colombia under approval No. CB-FMVZ-UN-010-19.
Corn lots used to prepare the diets
Three batches were experimental corn samples were provided by the “Federación Nacional de Cultivadores de Cereales y Leguminosas” (FENALCE). The national corn was harvested in the Department of Tolima, while the corn from the United States was obtained at the Santa Marta seaport. Both imported and national corn were US2 grade according to the grain classification stablished in the “Official United States Standards for Grain” of the (USDA-GIPSA 1996).
Proximate composition and mycotoxin determination
Proximal analyses were carried out on a subsample collected from the national and imported corn lots used in the experimental diets. These analyses included the determination of percent dry matter (Method 2001.12), ash (Method 935.12), crude protein (Method 968.06), crude fat (Method 920.39) and crude fiber (Method 962.09). All methods used were carried out according to methodologies described by the AOAC (Association of Official Analytical Chemists International 2006). The following mycotoxins were determined by high-performance liquid chromatography (HPLC) in accordance with Colombian technical standards (NTC): aflatoxins B1, B2, G1 y G2 (NTC 1232), zearalenone (ZEA) (NTC 4881), ochratoxin A (NTC 5472), T-2 and HT-2 toxins (NTC 6027) and deoxynivalenol (NTC 5961). These analyses were conduc-ted on a Shimadzu Prominence system (Shimadzu Scientific Instruments, Columbia, MD, USA) equipped with a DGU-20A3R degassing unit, two LC-20AD pumps, a SIL-20ACHT autosampler, a CTO-20A column oven, an RF-20AXS fluorescence detector, an SPD-20AV visible-ultraviolet spectrophotometric detector and a CBM-20A bus module, all controlled by “LC Solutions” software. Fumonisins B1, B2, and B3 were analyzed by HPLC-tandem mass spectrometry (LC-MS/MS) according to the method described by (Martos et al. 2010).
Laying hen trial
In the first trial, eighty hens 24-week-old Hy-Line Brown were randomly distributed into two treatments, each with 40 individually caged birds. Each treatment group received a different experimental corn-soybean diet formulated with either locally grown or imported corn with the Rationmix program. The diets reached or exceeded the nutritional requirements of laying hens (NRC,1994) (Table 1). The diets were provided ad libitum for 20 weeks (weeks 24 to 43 of age). The response variables measured were body weight (at the beginning and the end of the trial), egg weight (daily), feed intake (weekly), egg production (weekly), egg mass (weekly) and feed conversion (weekly). For data reduction and data analysis the 20 experimental weeks were separated into 5 periods of 4 weeks each. Eggshell strength and egg yolk color were evaluated at the end of each period using the yellow-orange tone scale (1 to 15) developed by Roche Laboratories (currently DSM) (weeks 4, 8, 12, 16 and 20 of the experiment) to 60 eggs sampled at random from each treatment. At week 20, Haugh units were measured to 30 eggs per treatment collected at random, according to the methodology described by (Dudusola 2010). Also, at week 20, a total of 30 eggs per treatment were open to determine the possible presence of blood and flesh stains.
Broiler chicken trial
A total of 352 male one-day-old Ross 308 AP chicks was randomly distributed into two dietary treatments, with 8 replicate pens of 22 birds each. Each treatment received a complete diet containing or exceeding the required nutrients for chickens according to their age with the Rationmix program. The diets reached or exceeded the nutritional requirements of broiler chickens (NRC,1994) (Table 2), in which the same percentage of either locally grown or imported corn was included. For this trial the following response variables were measured: body weight (days 7, 14, 21, 28 and 35), feed intake (weekly), feed conversion (weekly), weight gain and mortality rate. At day 30 of age the CIELab color space of the breast and the fat vein (lateral apterium region) of each bird; this area was chosen because it does not contain any feathers or major blood vessels (Castañeda et al., 2005). Were measured in 6 birds selected at random from each replica using a Konica-Minolta CR-400 colorimeter, (Chiyoda, Tokio, Japón). The CIELab color space (also known as CIE L*a*b*, abbreviated L*a*b* or Lab) are the visible spectrum colors defined by the International Commission on Lighting (CIE) since 1976 (Manresa González and Vicente, 2007).
Table 1 Composition of the experimental diets for laying hens.

V.M.P = vitamin-mineral premix*Content per kg: IU: vit. A 800; ICU: vit. D3 1300; mg: vit. E 5. vit. K 2 vit. B1 0.7. vit. B2 3. vit. B6 1.5. vit. B12 7, biotin 0.1, folic acid 1, Mn 60, Zn 50, Cu 6, I 1, Se 0.5, Co 1; g: Pantothenic acid 6, niacin 30
Table 2 Composition of the experimental diets for the broiler chicken trial.

*Contet per kg: zinc 20.000 mg; iron: 8.400 mg; manganese: 35.000 mg; copper: 1.700 mg; iodo: 430 mg; selenium: 60 mg; vitamin A: 3.440.00UI; vitamin D3: 680.000UI; vitamin E: 4.000UI; choline: 172.000 mg; niacin: 9.000 mg; calcium pantotheate: 3.060 mg; vitamin B2: 1.430 mg; vitamin B2: 1.430 mg; vitamin K3: 856 mg; vitamin B12: 4.6 mg
It expresses color as three values: L* for lightness from black (0) to white (100), a* from green (-) to red (+) or redness and b* from blue (-) to yellow (+) or yellowness. Carcass yield (breast, leg and fat) were determined at day 35 to 4 chickens selected at random from each replicate pen (64 in total). Performance variables were analyzed using the replicate pen as the experimental unit.
Fatty acid profile determination of corn oil, egg yolk and broiler chicken muscle
A 5 g sample of each type of corn used 10 eggs selected at random from each dietary laying hen treatment and 9 samples of breast muscle from each broiler chicken treatment were analyzed for fatty acid composition. The lipid extraction of both the yolk and muscle fat was performed according to the method described by (Folch et al. 1957).
Corn kernel oil was extracted by shaking finely ground kernel samples with diethyl ether for 12 hours. The percentage fatty acids of the extracted lipids were determined by gas chromatography according to the methodology described by (Aguillón-Páez et al. 2020). In brief, about 20 μL of the extract (containing about 2 mg of lipids) were taken and added to 160 μL of toluene and 20 μL of Meth-Prep II transesterification reagent (Alltech Associates, Inc., Deerfield, IL, USA). The mix was left at room temperature for 30 min and then 1 μL of the solution was injected into the gas chromatograph for the determination of the fatty acid methyl esters (FAME). The FAME were separated on an SGE BPX70 capillary gas chromatograph (GC) column (SGE Analytical Science, Australia) with a 30 m × 0.32 mm inside diameter × 0.25 μm film thickness using a Shimadzu GC-2014 Gas Chromatograph (Shimadzu Scientific Instruments, Columbia, MD, USA) equipped with a flame ionization detector. Separation was obtained with a temperature ramp (initial temperature 80 °C for 2 min, 30 °C/min until 140 °C, then 10 min at 140 °C, 2.9 °C/min to 200 °C, and finally 2.9 min at 200 °C) using helium as the carrier gas and nitrogen as the make-up gas. The injection was made in split mode with a split ratio of 1:30. Retention times were compared with those of known standards (Supelco, Inc., Bellefonte, PA, USA).
Statistical analysis
The normality of the residuals was investigated with the Shapiro-Wilk test. Homogeneity of variances was determined by the Levene test. When variance was found to be non-homogenous, a non-parametric test was performed. Qualitative variables (e.g. mortality and presence of blood and flesh stains) were analyzed using the Chi-square test. For the performance parameters a completely randomized experimental design was used with the repetition as experimental unit. Statistical analyses were carried out using the STATISTIX version 9 program, under a significance level of 0.05.
Results
Proximate composition and mycotoxin content
Results of the proximal analysis, the fatty acid composition, and the mycotoxin content of the national and imported corns used in experimental diets are shown in Table 3. National corn had a higher value of dry matter when compared to imported corn (87.7% vs. 85.5%, respectively); however, the crude protein content of the imported corn was 0.7% higher compared to the national corn (8.4% vs. 7.1%, respectively). Crude fat was 1.2% higher in the national corn than in imported corn (4.5% vs. 3.2%, respectively), while the ash content differed by 0.2% (0.7% vs. 0.9%, respectively). Crude fiber content was 64% higher in the national corn compared to the imported (1.8% vs. 1.1%, respectively). The fatty acid composition of the oil extracted from both the national and imported corn were very similar. The most abundant fatty acid corresponded to linoleic acid (56.8 and 55.8% for the imported and national corn samples, respectively), followed by oleic (27.0 and 26.9%), palmitic (11.5 and 12.6%), stearic (1.7 and 2.0%) and α-linolenic acid (1.12 and 1.01%). No mycotoxins produced by Aspergillus spp. fungi were detected in any of the two samples (aflatoxins or ochratoxin A), but fusariotoxins were found in both. Imported corn contained deoxynivalenol, zearalenone and fumonisinas while national corn contained only fumonisinas.

Laying hen trial
Performance parameters
No significant differences (p >0.05) in average body weight was observed at the beginning or at the end of the experiment. The average body weights at the start of the experiment (week 24 of age) were 1834 ± 17 and 1794 ± 17 g for the hens fed the diets containing local or imported corn, respectively. The respective values for the end of the experiment (week 43 of age) were 2261 ± 28 g and 2185 ± 28 g. Also, no significant differences (p >0.05) were observed in feed intake, egg production, rate of lay or egg mass production in any of the 5 experimental periods evaluated (Table 4). However, egg weight was significantly higher (p = 0.025) at weeks 28-31 in the hens fed the diet containing locally-grown corn vs. imported corn (60.6 vs. 58.9 g, respectively); further, average egg mass was also significantly higher for the same weeks (p = 0.012) in the national corn treatment compared with the imported corn (1.65 vs. 1.61 kg/hen, respectively). Feed conversion differed significantly (p< 0.05) only during weeks 36-39, when it was lower for the hens fed the diet containing locally-grown corn (1.89 vs.1.96). When the data from the 20 experimental weeks was pooled, no significant differences were seen in any of the variables evaluated (Table 4). However, egg weight tended to be higher (p=0.062) for the hens fed the diet containing national corn (61.4 vs. 59.9 g) and feed conversion showed a slightly lower value for the same treatment (1.95 vs. 1.97).
Egg quality
Egg yolk color showed significant differences (p < 0.05) in the eggs collected at weeks 4, 12 and 20 of the trial (Table 5). Yolk color had higher values for the eggs from the hens fed locally-grown corn at weeks 4 and 12, but lower at week 20. Eggshell strength showed no significant differences between treatments at any of the sampling times tested. Haugh units were significantly higher in the eggs from the birds fed locally-grown corn compared with those fed imported corn (106 vs. 102). No differences (p = 0.519) were seen in the number of eggs with yolk or albumen stains between treatments.
Table 4 Performance parameters of laying hens fed diets containing national or imported corn for 20 weeks (weeks 24 to 43 of age).

Values are means ± S.E.M. of 40 replicate pens per treatment. Within a raw and column, values with different superscripts differ significantly (p<0.05). FCR = feed conversion rate
Table 5 Egg yolk color, eggshell strength, Haugh units and presence of blood and flesh stains in eggs laid by hens fed diets containing national or imported corn.

Except for Haugh units and presence of blood and flesh stains (30 observations per treatment. Values are means ± S.E.M. of 300 replicate per treatment. Within a raw and column, values with different superscripts differ significantly (p<0.05)
Yolk fatty acid composition
Overall, the percentage composition of fatty acids was very similar in the fat extracted from the eggs from either of the two treatments (Table 6); however, minor but significant differences (p< 0.05) were found for some fatty acids. In the eggs collected during week 12 there were significant differences between the national and imported corn treatments for the following fatty acids: myristic (0.28 vs. 0.30%), oleic (38.9 vs. 37.8%), α-linolenic (0.74 vs. 0.83%), and docosapentaenoic (0.32 vs 0.26%); the total percentage of n-3 fatty acids was also significantly different (1.84 vs. 1.96%), but not the n-6/n-3 fatty acid ratio. At week 16, significant differences were found between α-linolenic (0.71 vs. 0.81%) and docosapentaenoic acids (0.44 vs. 0.30%), and again in the total n-3 fatty acid content (1.92 vs. 2.08%); further, the n-6/n-3 ratio also differed significantly (11.4 vs. 10.6%). At week 20, significant differences were only found for α-linolenic (0.74 vs. 0.91%) and docosapentaenoic acids (0.40 vs. 0.32%).
Table 6 Fatty acid composition of egg yolks fat from eggs laid by laying hens fed diets containing national or imported maize (experimental weeks 12, 16 and 20).
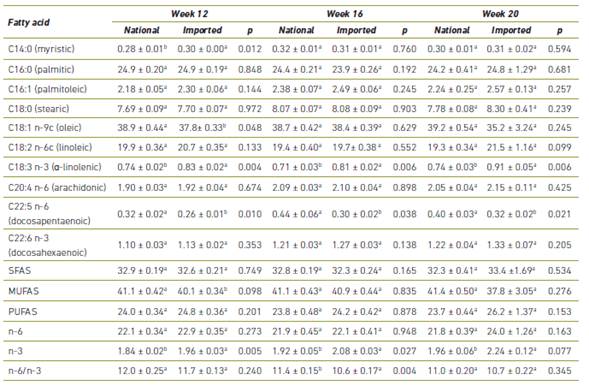
Values are means ± S.E.M. of 10 samples. Within a raw, means with different superscripts differ significantly (p<0.05). SFAS: saturated fatty acids; MUFAS: monounsaturated fatty acids; PUFAS: polyunsaturated fatty acids; n-6: omega-6 fatty acids; n-3: omega-3 fatty acids
Performance trial with broiler chickens
No significant differences in weekly feed intake were found between the two treatments, however, body weight was significantly higher (p < 0.05) in the chickens receiving the diet containing national corn at days 21 and 28 of age (1024 vs. 988 g and 1778 vs. 1737 g, respectively) (Table 7). Further, on day 21 the feed conversion ratio was significantly lower in the chickens receiving the diet containing locally-grown corn compared to those fed the imported corn diet (1.30 vs. 1.40). No significant differences were found in cumulative (35-day) feed intake, body weight gain, or mortality rate; however, the cumulative feed conversion rate was significantly (P < 0.05) lower in the chickens fed the diet containing national corn compared with those fed the imported corn (1.37 vs. 1.42). None of the so-called “color spaces” (L*a*b*) showed significant differences in the fat vein or breast skin color; however, the color space b* (yellow) had a tendency to show higher values in the chickens fed imported corn (2.09 vs. 2.0, and 6.71 vs. 6.63 in the fat vein and breast skin, respectively). Carcass yield values showed a significant difference (p = 0.009) only for breast percentage, which was 27.9% in the chickens fed the imported corn vs. 26.3% in those fed the national corn.
Table 7 Performance parameters, skin pigmentation and carcass yield in broiler chickens fed diets containing national or imported corn.

Values are means ± S.E.M. of 8-48-40 respectively replicate per treatment. Within a column, values with different superscripts differ significantly (p<0.05)
Table 8 Fatty acid composition of muscle (breast) fat in broiler chickens fed diets containing national or imported corn (at 35 days of age).
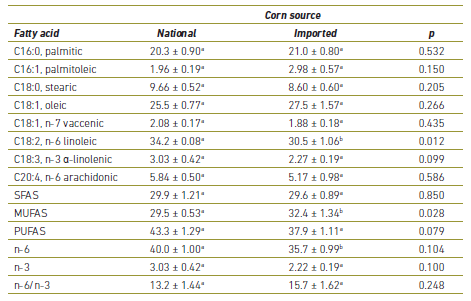
Values are means ± S.E.M. of 9 samples. Within a raw, means with different superscripts differ significantly (p<0.05). SFAS: saturated fatty acids; MUFAS: monounsaturated fatty acids; PUFAS: polyunsaturated fatty acids; n-6: omega 6 fatty acids; n-3: omega 3 fatty acids
Regarding the fatty acid composition of the breast muscle fat, significant differences (p < 0.05) were found in percent linoleic acid and total monounsaturated fatty acids (MUFAS). Even though the n-6/n-3 ratio did not differ significantly, the chickens fed locally-grown corn had a lower ratio (13.2) than those fed the imported corn (15.7) (Table 8).
Discussion
From the results of the laying hen trial it can be concluded that there are no significant differences in egg production or quality parameters when hens are fed diets containing corn from Colombia or from the United States (US2 grade). However, feed conversion, an important parameter in economic terms, presented significant di-fferences to the locally-grown corn at weeks 36 to 39. The better feed conversion obtained with national corn could be related to the higher crude fat content of the national corn compared to imported corn. Another possible explanation may be the different mycotoxin content found in the two lots of corn evaluated. The inclusion of imported corn (containing 484 ppb of deoxynivalenol) in a percentage of 56.68% in the diet results in DON levels in dietary levels of 274 ppb. In previous studies no effects in weight gain, food consumption, food efficiency, egg production the height of the white, specific gravity or resistance were found in layers receiving a diet containing 350-700 ppb of DON for 10 weeks (Hamilton et al. 1981 a,b). In the present study there was a trend towards a higher egg weight in the hens receiving national corn versus imported corn (61.4 vs. 59.9, p=0.06). In the studies mentioned before (Hamilton et al. 1981a,b) decreased egg weight proportional to the DON level in the diet (350-700 ppb) was observed, as well as a decrease in weight and shell thickness. Unfortunately, neither shell weight nor thickness were determined in the present study. The zearalenone found in the imported corn (40 ppb) do not pose a risk to birds. In 30-week-old laying birds receiving pure ZEA in the diet at concentrations of 0, 10, 25, 50, 100, 200,400 and 800 ppm, no effects on feed intake, body weight, egg production, Haugh units or shell thickness were found (Allen et al. 1981b).
Egg quality may be affected by factors such as bird lineage, feeding, handling and age of the bird, among others (García et al. 2016). The color of the yolk is determined by the content and transferability of carotenoids from the feed to the oocyte in formation; in turn, the degree of transfer depends on the particular liposolubility of each compound (Karunajeewa et al. 1984; Phillip et al. 1976). The main carotenoids of corn are zeaxanthin and lutein and the amount present in the grain seems to depend on the origin of the corn. The differences in egg yolk color found in the present study could be due to differences in carotenoid content between national and imported corn.
The so-called Haugh units (HU) are a means to estimate the egg protein quality by correlating the dense albumen height of the albumen surrounding the yolk with the egg weight. The test was developed by Raymond Haugh in 1937 (Haugh 1937) and it associates higher HU values with higher egg quality. The average values obtained in the two treatments of the present study can be both classified as “excellent”, since in both cases the value was greater than 90 (Arrué-Tobar 2018). However, although the values of HU were “excellent” in both treatments, there was a significant diffe-rence (p=0.002) in the actual values obtained when national and imported corn was included (106 vs. 102 HU, respectively). Differences in HU after feeding diets containing different varieties of corn (60% corn inclusion for 16 weeks) were reported in a previous study (Scheideler et al. 2008).
In contrast to egg production performance and egg quality variables, significant differences were observed in the percentage content of some fatty acids in egg yolk fat. The relevance of some of these differences, however, is difficult to establish. For example, what are the consequences of a myristic acid content higher in 0.02% when using imported corn compared to national corn (0.30 vs. 0.28%, respectively)? However, an interesting finding regarding the fatty acid profile was the consistently higher concentration (p<0.05) of linolenic acid in the egg yolks from the birds fed imported corn (0.83 vs. 0.74; 0.81 vs. 0.71 and 0.91 vs. 0.74% at weeks 12, 16 and 20, respectively). These higher ALA values were correlated with higher DHA values in the same eggs, which is related to the biochemical processes of elongation and desaturation of ALA towards DHA (Aguillón-Páez et al. 2020). These differences in ALA and DHA content resulted in a higher omega-3 fatty acid content and a better n-6/n-3 ratio in eggs of imported corn-fed birds compared to national corn-fed birds (11.4 vs. 10.6 at week 16, respectively). These ratios are similar to those found in layers fed diets with the addition of fatty acid sources meant to improve their n-6/n-3 ratio 10.5; (Aguillón-Páez et al. 2020). The differences in the fatty acid composition of the corn can be attributed to differences in ambient temperature during the development of the plants that can lead to stress either by heat or by cold (Harwood 1998); even mild changes in lipid metabolism can lead to different profiles in both lipids and their fatty acid composition. In addition, differences in the deposition of fatty acids in the grain may also be associated with the variety of corn and soil type (Agama-Acevedo et al. 2011).
From the results of the broiler chicken trial it can be concluded that there are significant differences in body weight were observed at days 21 and 28 of age, and in feed conversion rate at day 21; however, the cumulative 35-day performance showed a significant difference only for feed conversion rate. The difference in 0.05 feed conversión units in favor of the national corn might be of economic relevance, provided that the purchase price of both national and imported corn is similar. The higher feed conversion rate could be related to the higher crude fat content found in the national corn compared to the imported corn. Another possible explanation could be the different mycotoxin content found in the two corn lots. Even though the mycotoxin concentrations found are not expected to exert adverse effects in chickens, the presence of the fusariotoxins DON and ZEA in the imported corn (not found in the national corn) could have been associated with grain deterioration since fungi use the corn kernel nutrients as a source of energy (Christensen and Kaufman 1965; Diaz 2020). Although no significant differences in skin color were recorded, the magnitude of space b* (yellow tone) was higher for both breast and the fat vein skin in the chickens fed national corn. This difference might be due to a lower content of carotenoids in imported corn compared to national corn.
The carcass yield measurements showed a higher breast yield (p<0.05) in chickens fed the diet with imported corn (27.9 vs. 26.8%), while the other two carcass yield variables (leg yield and fat) showed no significant differences. Interestingly, it was found that the breast yield obtained in this trial was much higher than the one reported in a previous study in which 35 days old broiler chickens fed corn-soy diets had a yield of just 22.2% (Café et al. 2002); in this same study the percentage of abdominal fat was 2.43%, which was more than double the values obtained in the present trial (1.05 and 0.91% for the national and imported corn diets, respectively). These differences may be related to the different breeds used in these trials or to the formulation of the experimental diets.
The breast fatty acid profile showed a significantly higher linoleic acid (C18:2, n-6) content in the chickens fed the imported corn; further, the percentage of the only n-3 fatty acid found in breast fat, α-linolenic acid was higher in the birds fed national corn (3.03 vs. 2.22%). These two factors led to a better (lower) n-6/n-3 ratio in the breast fat in the chickens fed the national corn diet (13.2 vs. 15.7). Low n-6/n-3 ratios (4/1 to 5/1) are considered ideal for humans to prevent coronary heart disease and other illnesses (Simopoulus 2009; Valencak et al. 2015).
Conclusions
Taken together, the results of the present studies indicate that the are some differences in performance parameters that favor the use of national corn in poultry diets instead of imported corn. These differences, however, must be analyzed in the context of the purchase price of grain, which varies over time but generally favors the imported corn.

