


 Inglés (pdf)
 Articulo en XML
 Referencias del artículo
 Enviar articulo por email
 Citado por SciELO
  Citado por Google
  Similares en
SciELO
Similares en
SciELO  Similares en Google
 Permalink
Introduction
Free uroflowmetry is a diagnostic tool recommended by different management guidelines for men with lower urinary tract symptoms (LUTS)1,2,3. Its non-invasive nature, simplicity, and low cost make it a first-line screening test, more attractive than the flow/pressure study, even though the latter is the gold standard for diagnosing infravesical obstruction4,5,6,7.
Maximum flow (Qmax) is regarded as the most important uroflowmetric element for diagnostic accuracy and has been extensively studied8,9. Other uroflowmetry parameters such as average flow rate (Qave), voiding time (Vtime), and time to maximum flow (TQmax) have received less attention in the literature, and are frequently underestimated in clinical practice. However, Qave is a valuable "radiograph" of the total evacuation, in contrast to the isolated point described by Qmax10,11. Its relevance may increase in cases of intermittent flow or in patients who strain to start urination11. In addition, Vtime and TQmax may support the diagnosis of infravesical obstruction, especially in cases of prolonged urination12,13,14,15,16.
Since few studies have simultaneously measured and compared the discriminative capacity of uroflowmetric variables different from Qmax in terms of infravesical obstruction, we set out to measure them in a cohort of men who underwent urodynamics due to lower urinary tract symptoms.
Materials and methods
We carried out a retrospective evaluation of all urodynamic studies performed in our Institute between January 2012 and February 2021. Information was collected with the following inclusion criteria: men older than 40 years, storage or voiding symptoms, no history of neuropathic bladder, no history of prostate cancer, and evacuated volumes between 150 ml and 500 ml during free uroflowmetry and during pressure-flow studies. We recorded in all cases the value of Qmax, Qave, Vtime, TQmax, evacuated volume, post-void residual (RPM), detrusor pressure at Qmax (PdetQmax), and the result of the Schäfer nomogram. The Institutional Ethics Committee approved the research protocol.
Urodynamic studies were performed following the recommendations of the International Continence Society (ICS)4,17,18. Patients performed free flowmetry in their preferred position and were asked not to squeeze the penis, not push, and not move the urinary stream around the funnel. Qmax measurement was done with artifact correction. Vtime measurement was made by moving the marker towards the actual end of urination, avoiding errors due to dripping associated with the patient's coughing or movements. Cistometry and pressure-flow studies were performed after free flowmetry.
Pressure-flow studies' interpretation was based on the passive urethral resistance relationship (Passive Urethral Resistance Relation, LinPURR, Schäfer's nomogram)6,7,19. Obstructive pattern was defined as a LinPUR 3,4,5, or 6. No obstruction was considered a LinPURR 0 or 1. Patients with a LinPURR 2 were excluded, as it was considered equivocal.
Statistical analysis: variables are presented with means and standard deviations. The Kolmogorov-Smirnov test was used to determine the normality of continuous variables. The differences between the two groups were made using the Student's t-test for variables with normal distribution and the Mann-Whitney U for variables without normal distribution. The values of sensitivity, specificity, positive likelihood ratio (LR+), and negative likelihood ratio (LR-) were calculated for the different cutoff points of the flowmetric variables. The performance values of Qmax, Qave, Vtime, and TQmax were calculated as areas under the curve (AUC) on the receiver operator characteristic (ROC) curves. An AUC of 1.0 was considered perfect discrimination, and a value of 0.5 was considered the absence of discriminatory power. A p lower than 0.05 was considered a statistically significant difference. The difference between the ROC curves was obtained by applying the DeLong test with the statistical software Medcalc (Mariakerke, Belgium). The other statistical calculations were made with the software The Statistical Package for the Social Sciences (SPSS version 17.0, Chicago, USA).
Results
We obtained information from 5.434 consecutive urodynamic studies performed from January 2012 to February 2021. According to the selection criteria, we identified 432 studies for inclusion in our study. Table 1 depicts the distribution of age and uroflowmetry variables in two groups according to the degree of obstruction in the Schäfer nomogram: group 1, patients with LinPUR 0 or 1, and group 2, patients with LinPUR 3,4,5 or 6. The mean age showed statistically significant differences and was 63.6 years for group 1 and 64.8 years for group 2 (p = 0.02). Group 1 had statistically superior results compared to group 2 in terms of Qmax (16.3 versus 10.4 ml/s, respectively, p < 0.001), Qave (7.5 versus 4.9 ml/s, respectively, p < 0.001), and evacuated volume (316.3 versus 260.9 ml, respectively, p < 0.001). The values of group 1 were statistically lower than those of group 2 in terms of Vtime (51.4 versus 67.4 seconds, respectively, p < 0.001), TQmax (15.4 versus 20.0 seconds, respectively, p < 0.001), PdetQmax (28.4 versus 68.7 cmH20, respectively, p < 0.001), and PVR (72.3 versus 117.7 ml, respectively, p < 0.001).
Table 1 Age and voiding parameters
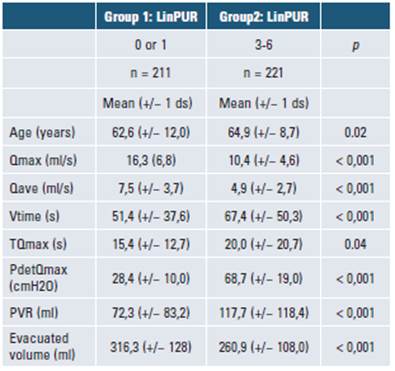
Qmax: maximum flow; Qave: average flow; Vtime: voiding time; Tqmax: time to maximum flow; PdetQmax: detrusor pressure at maximum flow; PVR: post-void residual; ds: standard deviation; s: seconds; ml: mililiters.
Table 2 presents the sensitivity, specificity, and likelihood ratio for the different cutoffs of Qmax, Qave, Vtime, and TQmax. The highest sensitivity values for each variable were 83% for a Qmax less than or equal to 15 ml/s, 95% for a Qave less than or equal to 10 ml/s, 85% for a Vtime greater than 30 seconds, and 81% for a TQmax greater than 8 seconds. The highest specificity values for each variable were 97% for a Qmax less than or equal to 5 ml/s, 66% for a Qave less than or equal to 5 ml/s, 67% for a Vtime greater than 50 seconds, and 72% for a TQmax greater than 16 seconds. The highest likelihood ratio for obstruction was 4.46 and corresponded to a Qmax less than or equal to 5 ml/s. The best likelihood ratio for non-obstruction was 0.19, related to a Qave less than or equal to 10 ml/s.
Table 2 Sensitivity, specificity
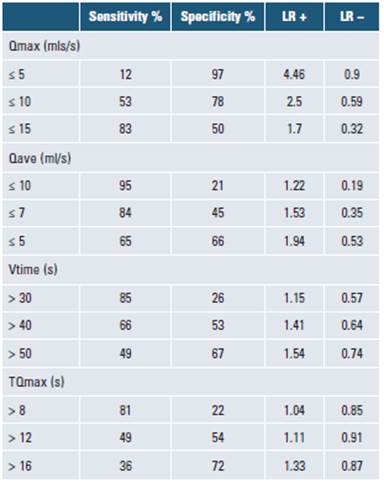
LR+ y LR- for different cutoffs. Qmax: maximum flow; Qave: average flow; Vtime: voiding time; TQmax: time to maximum flow; LR+: positive likelihood ratio; LR-: negative likelihood ratio; s: seconds; ml: mililiters.
The ROC curves for Qmax, Qave, Vtime and TQmax showed an AUC of 0.75 (95% confidence interval = 0.710.79, p < 0.001), 0.71 (95% confidence interval = 0.660.75, p < 0.001), 0.62 (95% confidence interval = 0.57-0.67, p < 0.001) and 0.55 (95% confidence interval = 0.50-0.60, p = 0.03) respectively, as displayed in Figure 1.
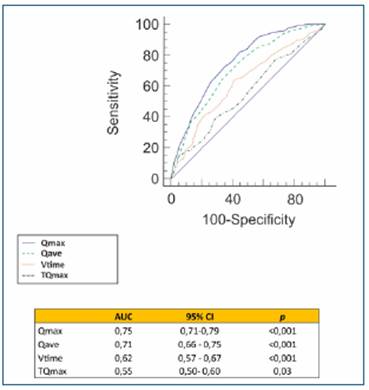
Qmax: maximum flow; Qave: average flow; Vtime: voiding time; TQmax: time to maximum flow; AUC: area under the curve. Described p-values refer to the comparison between each AUC and AUC: 0,5.
Figura 1 ROC curves comparison and area under the ROC curve (AUC) for different uroflowmetry parameters.
The difference between areas of the ROC curves was in favor of Qmax compared to Qave (difference = 0.04, p = 0.005), Vtime (difference = 0.12; p < 0.001), and TQmax (difference = 0.19; p < 0.001). Likewise, it was significantly higher in Qave than in Vtime (difference = 0.08; p < 0.001) and TQmax (difference = 0.15; p < 0.001). There was no statistically significant diffe-rence between areas of the ROC curves of Vtime and TQmax (difference = 0.06, p = 0.02).
Discussion
Uroflowmetry is recommended as part of LUTS workup during the initial evaluation or when considering a surgical correction1,3. Its main shortcomings are intra-individual variability, dependence on evacuated volume, and a questionable accuracy in predicting infravesical obstruction5,20. Different recommendations have been proposed to optimize its predictive ability, such as the realization of multiple measurements, obtaining evacuated volumes greater than 150 ml and less than 500 ml, the application of home devices, the introduction of nomograms, and the use of volume corrected flow rats18,21,22,23,24,25
Qmax has been the most evaluated flowmetric parameter. The multicenter ICS BPH study evaluated 1271 men between 45 and 88 years old and found that a Qmax cutoff of 10ml/s had a 47% sensitivity and a 70% specificity for diagnosing infravesical obstruction, defined as a Schàffer 3-6 category9. A meta-analysis that included 16 publications found that a Qmax cutoff of 10ml/s had mean sensitivity and specificity of 68.3% and 70.5% to diagnose infravesical obstruction, respectively, with observed sensitivity ranges between 16-100% and specificity between 26-100%8. The values we obtained in the present study (sensitivity of 53% and a specificity of 78% for a Qmax threshold less than or equal to 10 ml /s) are within the ranges described in the literature and are very similar to those in the ICS BPH study.9
The mentioned limitations inherent to flowmetry and the suboptimal values described for Qmax sensitivity and specificity justify the analysis and consideration of other flowmetric parameters proposed in our study. Qave, for instance, may be more representative than Qmax in some patients in whom a "normal" Qmax is accompanied by a low Qave10,11. The situation can be seen in patients who strain to evacuate or in cases of intermittent flows, where Qmax as a sole parameter may lead to erroneous interpretations11.
There are few publications with direct comparisons between Qmax and Qave. Shoukry et al. evaluated prospectively 173 patients and found that the correlation with obstructive symptoms was better with Qmax than with Qave26. However, the study was descriptive, and a flow-pressure assessment was not available as a reference. Oelke et al. compared in 168 men the two variables' discriminative capacity to diagnose infravesical obstruction and reported an AUC in the ROC curves of 0.84 for Qmax and 0.82 for Qave27. The present study is in line with the mentioned publications, as the area under the ROC curve was greater for Qmax than for Qave (0.75 versus 0.71, p = 0.005). Still, individual values of the Qave can be beneficial in the clinical context. For instance, the diagnosis of obstruction will be more plausible in a patient with a Qave less than or equal to 5 ml/s because, according to our study, this cutoff has a sensitivity, specificity, LR + and LR- of 65%, 66%, 1.94, and 0.53, respectively.
The evaluation of Vtime and TQmax has been limited in the literature. Plateau, intermittent, or "saw tooth" flow patterns, all with prolonged urination times, are commonly described as suggestive of an obstructive pattern, but this classification has not been correlated with Vtime15. Varderbrink et al. found that children undergoing meatoplasty achieved shorter evacuation times than before surgery (19.5 sec vs. 29.3 sec, p = 0.03)28. Nishimoto et al. conducted evaluations in 105 patients, including five who underwent transurethral surgery12. According to their work, obstruction was associated with prolonged evacuation times, and a Qmax/time ratio less than or equal to 0.78 indicated inappropriate urination. Shimizu et al. evaluated the flowmetry of 171 men with and without infravesical obstruction, finding that the Qmax/Vtime ratio was a better predictor of an obstruction than the Qmax and that its value was not affected by the volume evacuated29. Similarly, our study supports the notion that infravesical obstruction is associated with longer Vtime and TQmax. In particular, a Vtime greater than 50 seconds and a TQmax greater than 16 seconds showed the highest LR + (1.54 and 1.33, respectively).
Our study demonstrated statistically significant discriminative power for Qave, Vtime, and TQmax, with AUC values of 0.71 (p < 0.001), 0.62 (p < 0.001) and 0.55 (p = 0.03), respectively. Therefore, these parameters have clinical applicability and may complement Qmax for predicting infravesical obstruction. The benefit can be more evident in cases of Qmax located in the "gray zone" between 10 ml/s and 15 ml/s or cases with misleading symptomatology. For instance, for a patient with prostatic enlargement, voiding symptoms, and Qmax of 14 ml/s, the obstruction diagnosis will be more plausible if Qave is lower than 5 ml/s and TQmax is higher than 16 seconds. In another hypothetical case, a patient with a 30 ml prostate, storage symptoms, no voiding symptoms, and Qmax of 9 ml/s will be more likely diagnosed with infravesical obstruction if Qave is lower than 5ml/s and Vtime is greater than 50 seconds.
The present study has strengths and limitations. Each group included more than 200 patients, which is proper to estimate any AUC with a marginal error of 0.0730. We excluded cases with evacuated volumes lower than 150 ml or higher than 500 ml to prevent non-representative results4. LinPUR 2 patients were excluded to get a clear contrast between the obstructive pattern group and the non-obstructive group pattern: there was a statistically significant difference between the groups in terms of flowmetric parameters, PdetQmax, and PVR. Limitations that need to be mentioned are 1) its retrospective nature carried a higher risk of selection and information bias; 2) the precision could be affected because only one free flowmetry was done instead of several different measurements; 3) we did not include clinical and imaging variables that would have enriched the obstruction diagnosis, such as the International Prostate Symptom Score and the ultrasound measurement of intravesical protrusion and detrusor thickness8; finally, 4) the sample size of 211 patients in each group might not have the power to find differences lower than 10% between areas of the ROC curves30.
Conclusion
Our study demonstrated that Qave, Vtime, and TQmax have a statistically significant discriminatory power to predict infravesical obstruction and complement the information provided by Qmax. Although Qmax is the flowmeter variable with the best area under the ROC curve, in daily practice, the clinician should interpret the flowmetry by evaluating all the flowmetry variables and not just Qmax.

