


 Inglés (pdf)
 Articulo en XML
 Referencias del artículo
 Enviar articulo por email
 Citado por SciELO
  Citado por Google
  Similares en
SciELO
Similares en
SciELO  Similares en Google
 Permalink
1. Introduction
By considering the concepts of sustainable development and social responsibility, passenger and freight transport can deplete the planet’s natural processes and, in turn, the quality of life of Earth’s inhabitants. Transport has become vital for the economic and social development of societies around the globe. Mass transportation has increased over time, and fossil fuels have been used indiscriminately to satisfy the population’s growing demand of transportation and the permanent improvement of road infrastructure.
The environmental and social implications of unorganized and inefficient transportation systems may hinder the ability of a society to achieve sustainability; thus, it is essential to regulate the growth of transport systems.
Globally, the majority of primary energy sources are used for the local transportation of passengers and goods; 57% of the world’s oil demand is used in the transportation sector. Similarly, 95% of the energy used for transport originates from fossil fuels [1]; likewise, in Ecuador, 99% of all transportation energy is sourced from fossil sources [2].
The annual energy demand of Ecuador’s transportation sector is equivalent to 46 million Barrels of Oil Equivalent BOE, 37% of which is consumed by heavy duty vehicles (HDV) and 32% by light duty vehicles (LDV). This consumption pattern combined with an old and inefficient vehicle fleet comprised mostly of heavy freight trucks and untargeted fuel subsidies has resulted in excessive consumptions and irresponsible driving habits. The present research has focused on analyzing the transport situation in Ecuador to identify wasteful energy consumption patterns and opportunities to improve energy efficiency.
Energetic and social assessments of the transport sector and its available infrastructure were performed. These assessments provided information to identify specific opportunities for achieving energy and economic efficiency. This paper presents a methodology to evaluate the best technical opportunities, which prioritizes the opportunities and generates action plans accordingly. As such, it holds the potential to serve as a guideline for decision makers.
To identify the best opportunities, several different aspects must be taken into consideration, such as an understanding of the industrial and productive chain, a detailed study of the currently available road infrastructure, and a study on energy consumption. These aspects are directly related to the use of transportation services. Each of these factors could play a very important role in enabling societies to achieve sustainable development in regards to transport systems.
The results show different opportunities for energy efficiency, including technical, social, and political aspects. A combination of these facets, then, would lead to an understanding of the most important opportunities aligned with political projects and, ultimately, the sustainable development of society.
2. The transportation energy matrix
At present, the energy deficit and the degradation of the natural environment are consequences of excessive fossil fuel consumption. If the current trend continues, proven oil reserves would be depleted in approximately 42 years [3]. The current circumstances of the transportation sector in Ecuador do not differ much from that of countries in Latin America and the Caribbean. Ecuador’s transportation sector demands more energy than any of its other socioeconomic needs; unlike other, similar, countries, where the residential and industrial sectors are those that demand the most energy, e.g., Brazil, Cuba, Guatemala, Haiti, Honduras, Nicaragua, Trinidad & Tobago, Uruguay, and Venezuela [4].
According to the British Petroleum Outlook and Energy Outlook Mobil Exxon the energy demand of the transport sector is situated in third place [5, 6]. However, according to the Organization of the Petroleum Exporting Countries (OPEC), the energy demand of the transportation sector is equivalent to 57% of the total energy consumption worldwide and is expected to reach 60% by 2035 [1]. It is worthwhile to note that developing countries and their transportation energy demand in varies. In the United States, the transportation sector is the second largest socioeconomic sector in terms of energy demand [7]. The United States is also the highest consumer of energy worldwide [8]. China is the third largest global energy consumer, as the industrial sector tends to drive energy consumption and economic growth in this particular country [9]. Its transportation sector is the second largest consumer after that of the United States [8].
Excessive energy consumption by the transportation sector is expected to grow as a consequence of the rapid population growth. Urban areas are more populated than rural regions, and “for the first time ever, the majority of the world's population lives in a city, and this proportion continues to grow” [10]. It is expected that the population in urban areas will double by the middle of the twenty-first century [10]. In addition, the gross domestic product (GDP) is projected to grow worldwide at a rate of 3.1% from 2014 to 2019 and 2.4% from 2020 to 2025 [11]. The outcome of this growth will result in an increase in car ownership around the world [1]; according to the International Energy Agency, there will be 2 billion LDV on the road by 2050 [12]. This increase in car ownership will continue in parallel with the increase in the population, and it is desired that this energy consumption trend is stopped by providing other modes of transportation.
In terms of Ecuador´s energy matrix and energy balance, among all of the socioeconomic sectors, the transportation sector is the most vulnerable due to many reasons, such as the use of subsidies for fossil fuels. This practice leads to a discriminatory use of LDVs and SUVs. The greatest beneficiaries of such subsidies are mainly the middle to high income society. According to the World Trade Organization (WTO) (2006), “introducing a subsidy or any other government measure within a perfect market framework leads to inefficiency in the economy and is welfare-diminishing.” [13]. The state expenditure on fossil fuel subsidies was estimated to be approximately 4,539.64 million USD in 2012 [14], which may vary according to current demand.
According to the energy balance presented by the Ministry Coordinator of Strategic Sectors in 2013, the total energy demand in 2012 was equivalent to 77.2 million BOE. The transportation sector accounted for 49% of this total energy demand, which is equal to 46 million BOE [2]. The industry sector was responsible for 17%, and the residential sector was responsible for 13%, while the other sectors accounted for 21% of the total demand, as is shown in Fig. 1.

Source: [2] Ministry Coordinator of Strategic Sectors Ecuador (MICSE)
Figure 1 Ecuador’s 2012 Energy Demand by Socioeconomic Sector
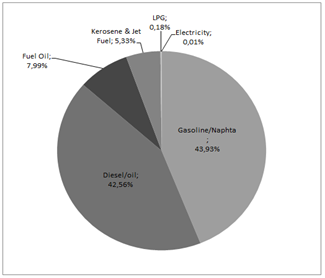
Source: [2] Ministry Coordinator of Strategic Sectors Ecuador (MICSE)
Figure 2 Energy Consumption by Fuel Type in Transport Sector by 2012
It must be considered that, among the transportation sector, the subsector that consumes the most energy is that of road transport. The highest demand within this sector corresponds to freight transport, which includes Light Duty Vehicles (LDV) that are less than 3 tons and High Duty Vehicles (HDV) that are more than 3 tons. The majority of the energy consumed is gasoline (44%), followed by diesel (43%). Fig. 2 shows all of the fuels used in transportation.
The total gasoline consumption in 2012 was 20.22 million BOE; Of which, 67% was used in LDV freight transport, 16% was used by cars and Sport Utility Vehicles (SUVs), 11% was used by HDV, and 6% was used by other types of vehicles, which include motorcycles and a very small share of buses [2].
In contrast, the consumption of diesel in 2012 was 19.61 million BOE. Compared to the use of gasoline, the use of diesel shows a completely opposite trend, as 78% of diesel is consumed by HDVs, 17% is consumed by LDVs, 5% is consumed by buses, and a very small share is consumed by cars and SUVs [2].
It has been determined that there is a high rate of inefficiency in the transport sector where freight transport has been identified as the higher consumer of the total energy demand in this sector. This has hindered the ability of decision makers to both remove the subsidy and make improvements in the introduction of new car technology. As a result, the desired level of sustainable development cannot be accomplished at the present time.
However, according to [15] the article, “Sustainable Passenger Transport: Back to Brundtland”, both dimensions and threshold values have been established for 2030 that would allow for the attainment of sustainable development and sustainable passenger transport. Therefore, these values might allow society to improve the quality of life of its citizens. Nevertheless, at present, the following question arises: Will Ecuador be able to accomplish these thresholds? As shown in Fig. 3, the threshold values can be observed.
Table 1 Main dimensions indicators and suggested 2030 threshold values for sustainable development and sustainable passenger transport

Source: Adapted from [15]
Analyzing Ecuador´s situation, there are some dimensions that do not exist. However, the purpose of presenting this information is to provide policy makers with indicators that need to be acquired. The dimensions that are available to compare the thresholds are as follows:
Satisfying basic human needs - the current GDP is equal to USD 5,720 per capita [16]
Promoting intragenerational equity - Gini coefficient - 0.485 [17]
Promoting intergenerational equity - 6% renewable energy [2]
Impacts of transport activities must not threaten long -term ecological sustainability - 13.11 kWh per capita per day [2].
After identifying the existing indicators, it is necessary to determine the other dimensions’ indicators to monitor and use them to attain the goals of sustainable development and sustainable transport.
3. The fleet
By 2013, Ecuador’s fleet was composed of mostly small individual passenger vehicles with 69% of the park, followed by LDVs with 24%, collective transport and medium duty vehicles with 3% in each group, and finally, 1% made up of heavy duty vehicles.
Table 2 shows the Ecuadorian vehicle fleet by energy source and vehicle type; it is important to specify that less than 1% of the vehicles differ in energy source from diesel or gasoline.
Currently, the automotive industry is undertaking massive changes regarding safety regulations with the reform, INEN RTE 034, where minimum security elements became obligatory. This has successfully implemented systems for active and passive safety [19].
In Fig. 4, in 2009, a market fall is identified; this fall is partly due to the global economic crisis of 2009. Meanwhile, starting in 2011, vehicle sales in Ecuador declined, largely due to the restrictions placed on imports and the requirements of security systems [19].

Source: [18] National Institute for Energy Efficiency and Renewable Energy
Figure 3 Energy Consumption by Fuel Type in Transport Sector by 2012
Table 2 Desegregated Ecuadorian Fleet by 2013

Source: Adapted from [18] National Institute for Energy Efficiency and Renewable Energy

According to the National Plan of Good Living (PNBV) in Ecuador, it is expected that the massive introduction of electric vehicles in 2016 [20] would lead to a great opportunity to change the industrial and energy matrices. This plan includes the introduction of 3,000 vehicles per year until 2022 [21].

4. Strengths and weaknesses in the current situation: Tables and Figures
The old transportation fleet has resulted in a high rate of emissions during the last decade. Transport contributes to more than 50% (18,300 kton CO2-eq.) of the total emissions of GHG. One of the reasons for this issue is the high growth rate of the fleet, which is becoming a global pattern [22]. In 2007, vehicles registered by the National Transportation Agency (ANT) reached 920,000 units [23]; by 2012, this number was as high as 1,590,000 [24].
Moreover, pollution problems include a lack of regulation, policy control and management. For instance, the responsibility for controlling the quality of vehicles belongs to the municipalities. As a result, there is a decrease in car maintenance, which causes a substantial increase in GHG emissions. Although the country size is perfect for implementing an optimization control system, society’s cultural aspects must, first, be modified. The national government can work along with municipalities by implementing similar systems and control platforms where regulations and control methods can become part of the culture and, thus, accepted by the society. Only then can efficient actions can be put into place.
In contrast, the road infrastructure in the country has been improved over the past ten years. Ecuador´s infrastructure is second best in South America, according to the World Economic Forum [25]. As a result, efficiency has increased. However, this is only one of the components of energy efficiency in road transport. Moreover, it has been considered that part of the solution will be the optimization of the logistic chains in freight transport, an area where energy efficiency can be increased dramatically.
5. Information management
Proper analysis of certified and verified information has been crucial for the development of this study. The baseline information is the most important tool for decision makers. The main objective of information management during this study has been to collect data from different institutions and analyze it to make it reliable, as the gathering of information and management would be an efficient tool for policy makers.

The collected information has generated knowledge through complex analytical processes applied to the data set.
The information management process began with the identification of information requirements. The research team has analyzed and identified the data sources, statistics, charts, graphs, and scientific papers required to undertake the investigation. After this, data management was performed to collect data from different institutes, such as the Ministry of Transport and Land Works (MTOP), the National Transit Agency (ANT), the National Institute of Statistics and Census (INEC), the Internal Revenue Service (SRI), and the Association of Automotive Enterprises of Ecuador (AEADE). To assure official information management, we collected these data via government platforms. This reduced the validation time of data, as it involved shorter periods of analysis.
Thereafter, a process of unification and organization was performed. At this point, missing data were identified and filled in; then, a process used to identify differences in the data requirements and considerations were taken into account by the institutions to manage information consolidation. The research team used technical criteria to make selections of data that would be considered useful for research. Finally, information was subject to a variety of analytical processes and served to certify the results.
6. Public policy
Based on the findings, consumption trends, and historical data, the future energy consumption of the transport sector is expected to grow. Energy and economic facets have the same tendencies, along with similar emissions of GHG, which are increasing due to the high prevalence of fossil fuel consumption. Car ownership is increasing in parallel to population growth, yet this trend must be broken.
According to the Latin-American Energy Organization in Ecuador, the ratio of proven oil reserves to oil production (R/P) is 52.78 years [4]. If the trend continues, the ratio of R/P would be reduced over the years. For this reason, a strategic policy plan is imperative to achieve sustainable development in the transport sector.
A first step could be the implementation of a well-developed transition plan for the use of energy. This plan would include an integration of urban public transportation in all the cities to discourage the use of private cars. Some suggestions include things such as Avoid Shift Improve approaches, Non-Motorized Transportation, the use of Transit Oriented Development TOD, Transit Demand Management TDM, and land use planning. Moreover, the implementation of logistic chains for freight transports must be considered. Finally, these measures would be supplemented with a gradual reduction of subsidies, and a continuing education program for the general population during all phases of the process, since it has become clear that the population needs to have a modal shift in the way they mobilized.
Among the thresholds previously presented [15] the following indicators need be considered as part of a national policy, as they are potentially realistic and attainable in sustainable passenger transport for the medium to long term:
Daily per capita energy consumption for passenger transport - Maximum 5.6 kW h per capita per day
Daily per capita travel distance by motorized transport - Minimum 9.2 km per capita per day
Public Transport Accessibility Level (PTAL) - Minimum PTAL 3 g
The amount of renewable to total energy used for transport - Minimum 15%
In contrast, some of the indicators needed to attain sustainable development have already been met, but still needs to be considered are as follows:
7. Conclusions
It has been identified that the highest demand for energy in Ecuador, of all the socioeconomic sectors, originates from the transportation sector. Current trends indicate that energy consumption is expected to grow along with an increase in the vehicle fleet, and, in turn, GHG emissions. It has been shown that, around the world, there have been efforts to attain sustainable development and sustainable passenger transport [15]. However, only a few of the thresholds have been met. The purpose of this paper is to promote the development of a national policy in the transportation sector. We have identified three thresholds as possibilities through which to discontinue the current trends of excessive energy consumption. If these thresholds are met, GHG emissions would be significantly reduced.
As a result, the quality of life of the Ecuadorian society would improve, attaining most of the standards put forth by the Good Living Plan of the Republic of Ecuador [20].
The reduction of subsidies in fuels for LDVs and SUVs, together with a strong investment in sustainability, is imperative to improve the public transport systems. In this sense, it could become the perfect first step towards a more energy efficient transport sector. With the same objective in mind, a broad and powerful communication plan must be implemented to change population behavior in regards to the use of transportation.

